
1-20 of 17273
Keywords: VIKOR
Close
Follow your search
Access your saved searches in your account
Would you like to receive an alert when new items match your search?
Journal

Focusing on clothing science whether fabric design production machinery management or retailing.
in Exploration and exploitation of bamboo fibrous polymeric clothing and multifunctional applications
> International Journal of Clothing Science and Technology
Published: 01 September 2026
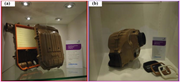
Figure 1 Natural fiber polymer composites application in Röchling automotive’s air filter box and inside trim components Maruschke, (2016) Two photos of natural fiber polymer composites used in automotive parts. The image contains two photos side-by-side. Panel A shows an open air filter box... More about this image found in Natural fiber polymer composites application in Röchling automotive’s air f...
in Exploration and exploitation of bamboo fibrous polymeric clothing and multifunctional applications
> International Journal of Clothing Science and Technology
Published: 01 September 2026
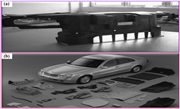
Figure 2 (a) A front-end grill opening reinforcement for the Ford Montageträger ( Link to the website ). (b) Flax, hemp, sisal, wool and other natural fibers utilized in fabricating fifty Mercedes- Benz E-Class components Sue Elliott-Sink (2005) A composite image showing two photos of automot... More about this image found in (a) A front-end grill opening reinforcement for the Ford Montageträger ( Li...
in Exploration and exploitation of bamboo fibrous polymeric clothing and multifunctional applications
> International Journal of Clothing Science and Technology
Published: 01 September 2026
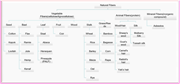
Figure 3 Categorization of natural fibers Xu et al. (2023) A diagram categorizing natural fibers into various types and subcategories. A flowchart categorizing natural fibers into three main types: Vegetable Fibers, Animal Fibers, and Mineral Fibers. Vegetable Fibers are further divided into Seed, Bast, Leaf, Fruit, Wood, Stalk, and Grass/Reeds. Seed fibers include Cotton, Kapok, and Loofah. Bast fibers include Flax, Ramie, Jute, Hemp, and Kenaf. Leaf fibers include Sisal, Abaca, Henequen, and Pineapple (PALF). Fruit fibers include Coir. Wood fibers include Wheat, Rice, Barley, Maize, Oat, and Rye. Stalk fibers include Bamboo and Bagasse. Grass/Reeds fibers include Corn and Rape. Animal Fibers are divided into Wool/Hair and Silk. Wool/Hair fibers include Sheep's wool, Goat's wool, Camel's hair, Rabbit's hair, and Yak's hair. Silk fibers include Mulberry Silk and Tussah Silk. Mineral Fibers include Asbestos. More about this image found in Categorization of natural fibers Xu et al. (2023) A d...
in Exploration and exploitation of bamboo fibrous polymeric clothing and multifunctional applications
> International Journal of Clothing Science and Technology
Published: 01 September 2026
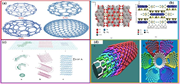
Figure 4 Instances of some nanoparticles used in fabricating bamboo polymeric nanocomposites (A) Differing structural forms of fullerene. (B) Sepiolites. (C) Different structural formations of carbon allotropes (D) carbon nanotubes structure (C) Kausar, (2022) , Iqbal Khan et al. (2021) , Kim et al. (2010) A collage of four images showing different types of nanoparticles used in fabricating bamboo polymeric nanocomposites. The image consists of four distinct sections, each depicting different types of nanoparticles used in fabricating bamboo polymeric nanocomposites. The first section, labeled (a), shows three different structural forms of fullerene molecules, including C60, C70, and C180. The second section, labeled (b), presents a detailed view of sepiolites, highlighting their crystal structure and dimensions. The third section, labeled (c), illustrates various structural formations of carbon allotropes, demonstrating their unique configurations and measurements. The fourth section, labeled (d), displays the intricate structure of carbon nanotubes, showcasing their complex and layered formations. More about this image found in Instances of some nanoparticles used in fabricating bamboo polymeric nanoco...
in Exploration and exploitation of bamboo fibrous polymeric clothing and multifunctional applications
> International Journal of Clothing Science and Technology
Published: 01 September 2026
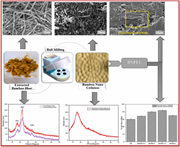
Figure 5 Nanocellulose/bamboo nanocomposites fabrication via ball milling strategy Verma et al. (2024) A composite image showing the process of fabricating nanocellulose/bamboo nanocomposites via ball milling. The composite image consists of one photo, one diagram, and three scanning electron microscope (SEM) images. The photo shows extracted bamboo fiber, which is then processed using a ball milling machine depicted in the diagram. This process results in bamboo nano cellulose, which is combined with boron nitride to form BNPEC. The SEM images show the morphological differences between untreated bamboo fibers, NaOH-treated bamboo fibers, and the proper dispersion of boron nitride sheets in the final composite. The diagram also includes graphs showing the X-ray diffraction (XRD) patterns of treated and untreated bamboo fibers, the XRD pattern of bamboo nano cellulose, and a bar graph comparing the tensile strength of different BNPEC composites. The images and graphs illustrate the structural and mechanical improvements achieved through the fabrication process. More about this image found in Nanocellulose/bamboo nanocomposites fabrication via ball milling strategy ...
in Exploration and exploitation of bamboo fibrous polymeric clothing and multifunctional applications
> International Journal of Clothing Science and Technology
Published: 01 September 2026
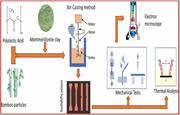
Figure 6 Fabrication steps and mechanical features of MMT/PLA bamboo nanocomposites Kumar and Babu 2024) A diagram illustrating the fabrication process of bamboo PLA MMT nanocomposites. A flowchart illustrating the fabrication process of bamboo PLA MMT nanocomposites. The process begins with... More about this image found in Fabrication steps and mechanical features of MMT/PLA bamboo nanocomposites ...
in Exploration and exploitation of bamboo fibrous polymeric clothing and multifunctional applications
> International Journal of Clothing Science and Technology
Published: 01 September 2026
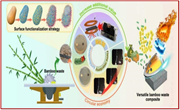
Figure 7 MXene/wastes Bamboo/PVA nanocomposites route for improved EMI shielding efficiency Wang et al. (2024a) An illustration of a process converting bamboo waste into versatile composites with enhanced properties. The image illustrates a process where bamboo waste is transformed into a versatile composite material through a surface functionalization strategy. The process involves several stages, starting with the preparation of bamboo waste, which is then processed into a composite material. The central part of the image highlights the enhanced properties of the resulting composite, including improved electromagnetic interference shielding efficiency, mechanical strength, flame retardancy, and antibacterial features. The image also emphasizes the circular economy aspect, indicating that the process adds value to waste materials. Various applications of the composite are depicted, such as electronic components and protective materials. More about this image found in MXene/wastes Bamboo/PVA nanocomposites route for improved EMI shielding eff...
in Exploration and exploitation of bamboo fibrous polymeric clothing and multifunctional applications
> International Journal of Clothing Science and Technology
Published: 01 September 2026
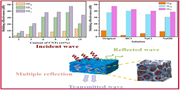
Figure 8 Mechanical and flame-retardant features of BF/CNTs/PLA nanocomposites Xu et al. (2024) Two bar graphs and a diagram illustrate the shielding effectiveness of nanocomposites with varying CNT content and different solutions. The image contains two bar graphs and a diagram. The first bar graph on the left shows the shielding effectiveness (SE) of nanocomposites with varying content of CNTs (wt percent). The x-axis represents the content of CNTs (wt percent) ranging from 1 to 15, and the y-axis represents the shielding effectiveness in decibels (D B) ranging from 0 to 50. The graph includes three data series: SE_R (reflection), SE_A (absorption), and SE_T (total). The second bar graph on the right shows the shielding effectiveness of nanocomposites post-immersion in different solutions. The x-axis represents the solutions (Original, H C l, N a C l, N a O H), and the y-axis represents the shielding effectiveness in decibels (D B) ranging from 0 to 50. This graph also includes three data series: SE_R (reflection), SE_A (absorption), and SE_T (total). More about this image found in Mechanical and flame-retardant features of BF/CNTs/PLA nanocomposites Xu ...
in Exploration and exploitation of bamboo fibrous polymeric clothing and multifunctional applications
> International Journal of Clothing Science and Technology
Published: 01 September 2026
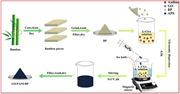
Figure 9 Fabrication routes of GO/PANI/BP nanocomposites Wua et al. (2024) A diagram illustrating the fabrication process of GO/PANI/BP nanocomposites. The diagram illustrates the step-by-step fabrication process of GO/PANI/BP nanocomposites. It begins with bamboo, which is cut, cleaned, and dried to produce bamboo pieces. These pieces are then ground, washed, filtered, and dried to obtain bamboo powder (BP). The BP is mixed with a solution containing aniline, graphene oxide (GO), and ammonium persulfate (APS) to form an L-CSA solution. This mixture undergoes ultrasonic dispersion for thirty minutes. The resulting solution is then subjected to an ice bath and stirred magnetically at five degrees Celsius for six hours. The final product, GO/PANI/BP nanocomposite, is obtained after filtering, washing, and drying the stirred solution. More about this image found in Fabrication routes of GO/PANI/BP nanocomposites Wua et al....
in Exploration and exploitation of bamboo fibrous polymeric clothing and multifunctional applications
> International Journal of Clothing Science and Technology
Published: 01 September 2026
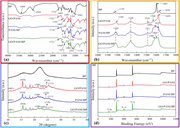
Figure 10 (a) FT-IR spectra. (b) Raman spectra. (c) XRD patterns. (d) XPS full spectra of BP, GO/PANI, PANI/BP and GO/PANI/BP respectively Wua et al. (2024) Multiple graphs depict various spectra and patterns of different materials. Panel A shows a line graph of FT-IR spectra with the x-axis labeled as Wavenumber (cmˆ-1) and the y-axis labeled as Transmittance (a.u.). The graph includes four lines representing BP, GO/PANI, PANI/BP, and GO/PANI/BP, each with distinct peaks and troughs. Panel B displays a line graph of Raman spectra with the x-axis labeled as Wavenumber (cmˆ-1) and the y-axis labeled as Intensity (a.u.). This panel also includes four lines representing BP, GO/PANI, PANI/BP, and GO/PANI/BP, each showing different spectral features. Panel C presents a line graph of XRD patterns with the x-axis labeled as 2θ (degree) and the y-axis labeled as Intensity (a.u.). The graph includes four lines representing BP, GO/PANI, PANI/BP, and GO/PANI/BP, each with specific peaks labeled with Miller indices. Panel D shows a line graph of XPS full spectra with the x-axis labeled as Binding Energy (eV) and the y-axis labeled as Intensity (a.u.). More about this image found in (a) FT-IR spectra. (b) Raman spectra. (c) XRD patterns. (d) XPS full spectr...
in Exploration and exploitation of bamboo fibrous polymeric clothing and multifunctional applications
> International Journal of Clothing Science and Technology
Published: 01 September 2026
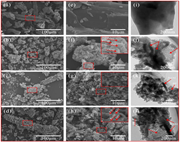
Figure 11 SEM images of BP (a, e), GO/PANI (b, f), PANI/BP (c, g) and GO/PANI/BP (d, h). TEM images of BP (i), GO/PANI (j), PANI/BP (k) and GO/PANI/BP (l) ( Wua et al., 2024 ) A collage of scanning electron microscope images and transmission electron microscope images of various nanomaterials. The image consists of twelve sub-images arranged in a grid. The first row contains four scanning electron microscope images labeled (a) through (d), showing different nanomaterials: BP, GO/PANI, PANI/BP, and GO/PANI/BP respectively. Each of these images has a scale bar of 100 micrometers. The second row contains four magnified views of the corresponding images in the first row, labeled (e) through (h), with a scale bar of 10 micrometers. The third row contains four transmission electron microscope images labeled (i) through (l), showing BP, GO/PANI, PANI/BP, and GO/PANI/BP respectively, each with a scale bar of 200 nanometers. The images highlight the structural differences and compositions of the nanomaterials, with annotations indicating the presence of GO (graphene oxide) and PANI (polyaniline) in the respective composites. More about this image found in SEM images of BP (a, e), GO/PANI (b, f), PANI/BP (c, g) and GO/PANI/BP (d, ...
in Exploration and exploitation of bamboo fibrous polymeric clothing and multifunctional applications
> International Journal of Clothing Science and Technology
Published: 01 September 2026
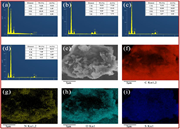
Figure 12 BP EDS spectra (a), GO/PANI (b), PANI/BP (c) and GO/PANI/BP (d) and the elemental contents SEM images of GO/PANI/BP (e). C (f), N (g), O (h) and S (i) elemental mapping images of GO/PANI/BP Wua et al. (2024) ) The image contains multiple panels showing energy dispersive X-ray spectroscopy (EDS) spectra, scanning electron microscope (SEM) images, and elemental mapping images. The image consists of nine panels. Panels A through D show EDS spectra for different samples: BP, GO/PANI, PANI/BP, and GO/PANI/BP. Each spectrum displays peaks corresponding to elements C, N, O, and S, with tables listing the weight percent (Wt percent) and atomic percent (At percent) of these elements. Panel E shows an SEM image of GO/PANI/BP at a scale of 5 micrometers, revealing the surface morphology. Panels F through I display elemental mapping images of GO/PANI/BP for C, N, O, and S respectively, each at a scale of 5 micrometers. These mappings show the distribution of each element within the sample, with C, N, and O being highly concentrated and evenly distributed, while S is more uniformly dispersed. More about this image found in BP EDS spectra (a), GO/PANI (b), PANI/BP (c) and GO/PANI/BP (d) and the ele...
in Exploration and exploitation of bamboo fibrous polymeric clothing and multifunctional applications
> International Journal of Clothing Science and Technology
Published: 01 September 2026
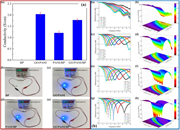
Figure 13 (A) BP conductivity, GO/PANI, PANI/BP and GO/PANI/BP (a), circuit linked by BP (b), GO/PANI (c), PANI/BP (d) and GO/PANI/BP (e). (B) RL values and 3D RL of BP (a, b), GO/PANI (c, d), PANI/BP (e, f) and GO/PANI/BP (g, h) Wua et al. (2024) A composite image showing graphs and photographs of different materials and their conductivity and reflection loss. The image contains multiple graphs and photographs. The first part of the image shows a bar graph depicting the conductivity of different materials: BP, GO/PANI, PANI/BP, and GO/PANI/BP. The y-axis represents conductivity in S/cm, and the x-axis lists the materials. The bar graph shows that GO/PANI has the highest conductivity, followed by GO/PANI/BP, PANI/BP, and BP. Below the bar graph, there are four photographs showing circuits linked by different materials: BP, GO/PANI, PANI/BP, and GO/PANI/BP. Each photograph includes a display showing current and voltage measurements. The second part of the image contains multiple line graphs and 3D surface plots showing the reflection loss (RL) values for BP, GO/PANI, PANI/BP, and GO/PANI/BP. Each set of graphs includes a 2D line graph and a 3D surface plot. The x-axis represents frequency in GHz, and the y-axis represents reflection loss in dB. The 3D plots show the reflection loss as a function of frequency and thickness. More about this image found in (A) BP conductivity, GO/PANI, PANI/BP and GO/PANI/BP (a), circuit linked by...
in Exploration and exploitation of bamboo fibrous polymeric clothing and multifunctional applications
> International Journal of Clothing Science and Technology
Published: 01 September 2026
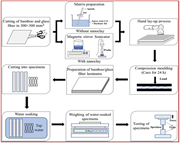
Figure 14 Composites fabrication procedure Syed et al. (2024) A flowchart illustrating the fabrication process of fiber-reinforced polymer composites. A flowchart illustrating the fabrication process of fiber-reinforced polymer composites. The process begins with the cutting of bamboo and glass fiber into 300x300 mm squares. Matrix preparation follows, involving the mixing of epoxy resin L12 and hardener K6 using a spatula and stirrer. The mixture can be prepared with or without nanoclay, utilizing a magnetic stirrer and sonicator. The hand lay-up process is then employed to layer the materials. Next, compression molding is applied for 24 hours to cure the composites. The cured laminates are cut into specimens, which are then soaked in water. The water-soaked specimens are weighed, and finally, the specimens are tested for tensile and flexural properties. More about this image found in Composites fabrication procedure Syed et al. (2024) A...
in Exploration and exploitation of bamboo fibrous polymeric clothing and multifunctional applications
> International Journal of Clothing Science and Technology
Published: 01 September 2026
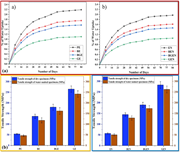
Figure 15 (A) Curves of water uptake (a) devoid of nanoclay (b) with nanoclay. (B) (a-Left hand) Tensile features of dry and water-soaked samples (devoid of nanoclay), (b-Right hand) Tensile features of dry and water-soaked samples (with nanoclay) Syed et al. (2024) A combination of line graphs and bar charts depicting water uptake and tensile strength of samples with and without nanoclay. The image contains four graphs. Two line graphs on the top row show the percentage of water uptake over a number of days for samples devoid of nanoclay and samples with nanoclay. The x-axis represents the number of days, ranging from 0 to 84, and the y-axis represents the percentage of water uptake, ranging from 0 to 2.4 percent. The line graphs compare four different sample types: PE, BE, BGE, and GE for the first graph, and EN, BEN, BGEN, and GEN for the second graph. Each sample type is represented by a different color line. The bottom row contains two bar charts showing the tensile strength in megapascals (MPa) of dry and water-soaked samples. The x-axis lists the sample types, and the y-axis represents the tensile strength, ranging from 0 to 300 MPa. The bar charts compare the tensile strength of dry specimens and water-soaked specimens for samples devoid of nanoclay and samples with nanoclay. All values are approximated. More about this image found in (A) Curves of water uptake (a) devoid of nanoclay (b) with nanoclay. (B) (a...
in Exploration and exploitation of bamboo fibrous polymeric clothing and multifunctional applications
> International Journal of Clothing Science and Technology
Published: 01 September 2026
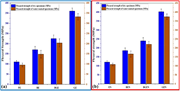
Figure 16 (a) Flexural features of dry and water-soaked samples (without nanoclay). (b) Flexural features of dry and water-soaked samples (with nanoclay) Syed et al. (2024) Two bar graphs comparing flexural strength of different composite materials in dry and water-soaked conditions. Panel A: A bar graph comparing the flexural strength of dry and water-soaked composite materials without nanoclay. The horizontal axis lists the materials: PE, BE, BGE, and GE. The vertical axis measures flexural strength in MPa, ranging from 0 to 400. The graph uses two colors: blue for dry specimens and orange for water-soaked specimens. The flexural strength values for dry specimens are approximately 100 MPa for PE, 150 MPa for BE, 250 MPa for BGE, and 350 MPa for GE. The flexural strength values for water-soaked specimens are approximately 90 MPa for PE, 130 MPa for BE, 220 MPa for BGE, and 320 MPa for GE. Panel B: A bar graph comparing the flexural strength of dry and water-soaked composite materials with nanoclay. The horizontal axis lists the materials: EN, BEN, BGEN, and GEN. The vertical axis measures flexural strength in MPa, ranging from 0 to 450. The graph uses two colors: blue for dry specimens and orange for water-soaked specimens. More about this image found in (a) Flexural features of dry and water-soaked samples (without nanoclay). (...
in Exploration and exploitation of bamboo fibrous polymeric clothing and multifunctional applications
> International Journal of Clothing Science and Technology
Published: 01 September 2026
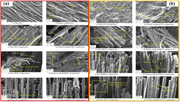
Figure 17 (A) SEM images of dry and water-soaked samples (devoid of nanoclay). (B). SEM image of dry and water-soaked samples (devoid of nanoclay) Syed et al. (2024) A collage of scanning electron microscope images showing dry and water-soaked samples. The image consists of two main sections labeled (A) and (B), each containing multiple scanning electron microscope (SEM) images. Section (A) displays SEM images of dry and water-soaked samples devoid of nanoclay. The images in this section are labeled as follows: a) Dry PE, b) Water-soaked PE, c) Dry BE composites, d) Water-soaked BE composites, e) Dry BGE composites, f) Water-soaked BGE composites, g) Dry GE composites, and h) Water-soaked GE composites. Each image highlights specific features such as glass fiber, bamboo fiber, fiber matrix bonding, and matrix traces. Section (B) also shows SEM images of dry and water-soaked samples devoid of nanoclay, labeled as follows: a) Dry EN composites, b) Water-soaked EN composites, c) Dry BEN composites, d) Water-soaked BEN composites, e) Dry BGEN composites, f) Water-soaked BGEN composites, g) Dry GEN composites, and h) Water-soaked GEN composites. These images similarly highlight features like glass fiber, bamboo fiber, and matrix traces. More about this image found in (A) SEM images of dry and water-soaked samples (devoid of nanoclay). (B). S...
in Exploration and exploitation of bamboo fibrous polymeric clothing and multifunctional applications
> International Journal of Clothing Science and Technology
Published: 01 September 2026
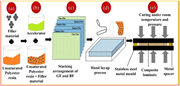
Figure 18 Stepwise procedure for fabricating the BF/GF-USP hybrid composites Jeyakumara et al. (2024) A diagram illustrating the fabrication process of hybrid composites using glass fiber, bamboo fiber, and unsaturated polyester resin. A flowchart illustrating the fabrication process of hybrid composites using glass fiber, bamboo fiber, and unsaturated polyester resin. Panel A shows the combination of filler material with unsaturated polyester resin. Panel B depicts the addition of an accelerator to the mixture. Panel C illustrates the stacking arrangement of glass fiber and bamboo fiber layers. Panel D shows the hand layup process where the stacked layers are placed into a stainless steel metal mold. Panel E demonstrates the curing process under room temperature and pressure, resulting in a composite laminate with metal spacers. More about this image found in Stepwise procedure for fabricating the BF/GF-USP hybrid composites Jeyakum...
in Exploration and exploitation of bamboo fibrous polymeric clothing and multifunctional applications
> International Journal of Clothing Science and Technology
Published: 01 September 2026
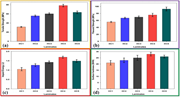
Figure 19 (a) Tensile strength of differing BF/GF-USP hybrid nanocomposites. (b) Flexural strength of differing BF/GF-USP hybrid nanocomposites. (c) Impact energy of varying BF/GF-USP hybrid nanocomposites. (d) Hardness of varying BF/GF-USP hybrid nanocomposites Jeyakumara et al. (2024) Four bar graphs compare mechanical properties of different hybrid nanocomposites. The image contains four vertical bar graphs comparing mechanical properties of different hybrid nanocomposites. Panel A shows tensile strength in megapascals (M P A) for five different laminates labeled HC1 to HC5. HC4 has the highest tensile strength, followed by HC5, HC3, HC2, and HC1. Panel B displays flexural strength in megapascals (M P A) for the same laminates. HC5 has the highest flexural strength, followed by HC4, HC3, HC2, and HC1. Panel C illustrates impact energy in joules (J) for the laminates. HC4 shows the highest impact energy, followed by HC5, HC3, HC2, and HC1. Panel D presents surface hardness in Brinell hardness number (B H N) for the laminates. HC4 has the highest surface hardness, followed by HC5, HC3, HC2, and HC1. More about this image found in (a) Tensile strength of differing BF/GF-USP hybrid nanocomposites. (b) Flex...

