
1-20 of 8425
Keywords: ORGANIZATIONAL DEVELOPMENT
Close
Follow your search
Access your saved searches in your account
Would you like to receive an alert when new items match your search?
Journal

Publishing work that contributes to the continuous improvement of health care organisations providing a forum for current thinking on the theoretical and practical aspects of quality and management in health care.
Journal Articles
Leveraging the MBNQA framework to advance quality assurance in healthcare
Available to Purchase
Int J Health Care Qual Assur 1–19.
Published: 22 June 2026
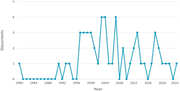
Annual paper publication (year 1980–2024) A line graph showing the numbe...
Available to Purchase
in Leveraging the MBNQA framework to advance quality assurance in healthcare
> International Journal of Health Care Quality Assurance
Published: 22 June 2026
Figure 1 Annual paper publication (year 1980–2024) A line graph showing the number of documents published annually from 1980 to 2024. A line graph showing the number of documents published annually from 1980 to 2024. The x-axis represents the years, ranging from 1980 to 2024, and the y-axis re... More about this image found in Annual paper publication (year 1980–2024) A line graph showing the numbe...
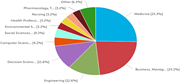
Subject area A pie chart showing subject areas and their respective perc...
Available to Purchase
in Leveraging the MBNQA framework to advance quality assurance in healthcare
> International Journal of Health Care Quality Assurance
Published: 22 June 2026
Figure 2 Subject area A pie chart showing subject areas and their respective percentages. A pie chart displays the distribution of subject areas. The chart is divided into twelve segments. Medicine represents twenty-five point three percent, the largest segment. Business, Management, and relat... More about this image found in Subject area A pie chart showing subject areas and their respective perc...
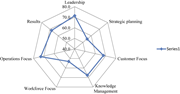
Radar chart A radar chart with multiple axes labeled Leadership, Strateg...
Available to Purchase
in Leveraging the MBNQA framework to advance quality assurance in healthcare
> International Journal of Health Care Quality Assurance
Published: 22 June 2026
Figure 3 Radar chart A radar chart with multiple axes labeled Leadership, Strategic planning, Customer Focus, Knowledge Management, Workforce Focus, Operations Focus, and Results. A radar chart displays data points connected by lines, forming a spider web-like structure. The chart has seven ax... More about this image found in Radar chart A radar chart with multiple axes labeled Leadership, Strateg...
Journal Articles
From “that's how it was done” to “this is how we improve”: norm shifts, organisational culture and quality in laboratory practices
Available to Purchase
Int J Health Care Qual Assur 1–13.
Published: 19 June 2026
Journal Articles
Int J Health Care Qual Assur 1–21.
Published: 18 June 2026
in Lean and clinical risk management: an integrated implementation framework
> International Journal of Health Care Quality Assurance
Published: 18 June 2026
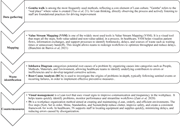
Figure 1 Examples of LM tools. Source: Authors' own work A diagram illustrating various Lean Management tools used in healthcare. A diagram illustrating various Lean Management tools used in healthcare. The diagram is divided into four sections: Data gathering, Mapping, Waste identification, a... More about this image found in Examples of LM tools. Source: Authors' own work A diagram illustrating v...
in Lean and clinical risk management: an integrated implementation framework
> International Journal of Health Care Quality Assurance
Published: 18 June 2026
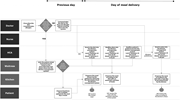
Figure 2 Process “as is”. Source: Authors' own work Flowchart of meal delivery process involving doctor, nurse, HCA, waitress, kitchen, and patient. The flowchart illustrates the meal delivery process involving several roles: the doctor, nurse, healthcare assistant (HCA), waitress, kitchen sta... More about this image found in Process “as is”. Source: Authors' own work Flowchart of meal delivery pr...
in Lean and clinical risk management: an integrated implementation framework
> International Journal of Health Care Quality Assurance
Published: 18 June 2026
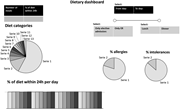
Figure 3 Dietary dashboard structure. Source: Authors' own work Multiple graphs depict dietary dashboard structure, including pie charts, bar graphs, and selection options. The image contains multiple graphs and selection options that depict a dietary dashboard structure. Panel A shows a pie c... More about this image found in Dietary dashboard structure. Source: Authors' own work Multiple graphs d...
in Lean and clinical risk management: an integrated implementation framework
> International Journal of Health Care Quality Assurance
Published: 18 June 2026
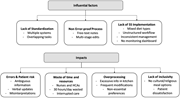
Figure 4 Influential factors and impacts. Source: Authors' own work A diagram of influential factors and their impacts. The diagram illustrates influential factors and their impacts. It is divided into two main sections: Influential factors and Impacts. The Influential factors section includes... More about this image found in Influential factors and impacts. Source: Authors' own work A diagram of ...
in Lean and clinical risk management: an integrated implementation framework
> International Journal of Health Care Quality Assurance
Published: 18 June 2026
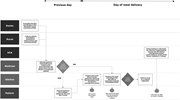
Figure 5 The new process. Source: Authors' own work A flowchart illustrating the new meal delivery process for patients. The flowchart illustrates the new meal delivery process for patients. The process involves several roles: the doctor, nurse, healthcare assistant (HCA), waitress, kitchen st... More about this image found in The new process. Source: Authors' own work A flowchart illustrating the ...
in Lean and clinical risk management: an integrated implementation framework
> International Journal of Health Care Quality Assurance
Published: 18 June 2026
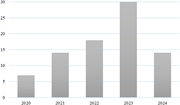
Figure 6 Number of Incident reporting cases from 2020 to 2024. Source: Authors' own work A bar graph showing the number of incident reporting cases from 2020 to 2024. The bar graph compares the number of incident reporting cases across the years 2020 to 2024. It features five vertical bars, ea... More about this image found in Number of Incident reporting cases from 2020 to 2024. Source: Authors' own ...
in Lean and clinical risk management: an integrated implementation framework
> International Journal of Health Care Quality Assurance
Published: 18 June 2026
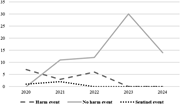
Figure 7 Number of patient safety events by type from 2020 to 2024. Source: Authors' own work A line graph depicting the number of patient safety events by type from 2020 to 2024. A line graph depicting the number of patient safety events by type from 2020 to 2024. The horizontal axis represen... More about this image found in Number of patient safety events by type from 2020 to 2024. Source: Authors'...
in Lean and clinical risk management: an integrated implementation framework
> International Journal of Health Care Quality Assurance
Published: 18 June 2026
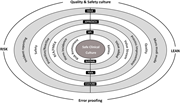
Figure 8 Framework lean and risk, an integrated approach combining lean and risk management principles. Source: Authors' own work A diagram of an integrated approach combining lean and risk management principles. The conceptual framework represents a multi-layered, integrated approach designed... More about this image found in Framework lean and risk, an integrated approach combining lean and risk man...
Journal Articles
Int J Health Care Qual Assur 1–20.
Published: 15 June 2026
Includes: Supplementary data
in Cross-cultural communication in a women’s health service: a mixed-methods evaluation
> International Journal of Health Care Quality Assurance
Published: 15 June 2026
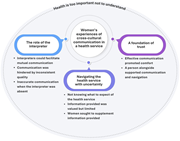
Figure 1 Thematic map of women’s cross-cultural communication experiences A thematic map of women’s cross-cultural communication experiences in a health service. A thematic map of women’s cross-cultural communication experiences in a health service. The map is divided into one central concept ... More about this image found in Thematic map of women’s cross-cultural communication experiences A thema...
Journal Articles
Int J Health Care Qual Assur 1–18.
Published: 10 June 2026
Journal Articles
Hospital service quality and patient loyalty: a comparative analysis of government and private hospitals in Chhattisgarh
Available to Purchase
Int J Health Care Qual Assur 1–20.
Published: 09 June 2026
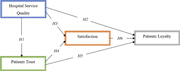
Conceptual (hypothesized) model. Source: Authors’ own work
Available to Purchase
in Hospital service quality and patient loyalty: a comparative analysis of government and private hospitals in Chhattisgarh
> International Journal of Health Care Quality Assurance
Published: 09 June 2026
Figure 1 Conceptual (hypothesized) model. Source: Authors’ own work More about this image found in Conceptual (hypothesized) model. Source: Authors’ own work
