
Purpose
This study aims to provide a framework for assessing the technical condition of a house to determine its market value, including the identification of other price-setting factors and their statistical significance. Time on market (TOM) in relation to the technical condition of a house is also addressed.
Design/methodology/approach
The primary database contains 631 houses, and the initial asking price and selling price are examined. All the houses are located in the Brno–venkov district in the Czech Republic. Regression analysis was used to test the influence of price-setting factors. The standard ordinary least squares estimator and the maximum likelihood estimator were used in the frame of generalized linear models.
Findings
Using envelope components of houses separately, such as the façade condition, windows, roof, condition of interior and year of construction, brings better results than using a single factor for the technical condition. TOM was found to be 67 days lower for houses intended for demolition – as compared to new houses – and 18 days lower for houses to refurbishment.
Originality/value
To the best of the authors’ knowledge, this paper is original in the substitution of specific price-setting factors for factors relating to the technical condition of houses as well as in proposing the framework for professionals in the Czech Republic.
1. Introduction
Buying a house is typically the largest single investment for homeowners and selling a house is also an important decision (Khezr, 2015). The housing sector accounts for a significant share of investment in the economy. Based on Coldwell–Banker–Richard–Ellis (CBRE, the American commercial real estate services and investment firm) statistics, the share represents 62% of all investments during the first three quarters of 2020 in the Czech Republic (CBRE, 2022).
The subject of this research is the residential real estate segment, specifically the housing segment. The growing number of housing transactions requires an accurate determination of the fair market value. This requirement is for tax purposes or determining the asking price correctly, both in expert and appraisal practice and the real estate sector in general.
In the context of market value, houses are very specific assets representatives of the real estate sector, unlike classic commercial products (Endel et al., 2020; Wickramaarachchi et al., 2021), and form a heterogeneous market (Nam, 2020; Cupal, 2015).
Based on the International Valuation Standards, three basic approaches are recognized for real estate valuation. First is the cost approach, which is based on the cost that the same construction would require. The cost approach provides an indication of value (cost value) using the basic economic principle that a buyer will pay no more for an asset than the cost to obtain an asset of equal utility. This approach reflects physical deterioration and all other relevant forms of obsolescence and its impact to cost value (International Valuation Standards 2017, 2017). Second is the context of the income approach, where the expected cash flow generated by the building over its useful life, that is, potential long-term rental income, must be considered. Finally, the market approach is based on comparing identical or comparable real estate for which reliable pricing information is available. In the case of real estate, it is almost impossible to find identical real estate because these products are characterized by high heterogeneity. This heterogeneity impacts valuation accuracy (Dunse et al., 2010; Cupal, 2017). Knowledge of the prevailing market conditions is necessary for successfully determining the value by the market approach (International Valuation Standards 2017, 2017).
Market value is affected by many factors that can have either a strong or weak influence. Considering the highest possible number of significant price-setting factors of house properties is the fundamental objective of determining the market value and estimating the selling price. Most previous research identified elementary price-setting factors, such as the size of the house, location, technical condition, equipment and other factors. However, similar research is not available for the Czech residential housing market conditions. Some research studies focused on flood risk and its impact on market value; however, the impact of this price-setting factor has not been proved (Cupal, 2015).
Based on the best practice approach, some of the mentioned price-setting factors are used in the field of expert and appraisal practices in the Czech Republic. Nevertheless, the significance of these factors has not yet been proved. The appraisal is, therefore, a science and an art to a specific degree (Renigier-biłozor et al., 2019). Based on authors’ experiences and previous market analysis, houses are largely heterogeneous properties in the context of quality, size and technical condition. Some price-setting factors affect asset liquidity, especially time on market (TOM) (Wickramaarachchi et al., 2021).
A part of the price-setting factors can be easily quantified, such as house size, distance from the city center or age of the house. However, determining some price-setting factors is very subjective. Typically, the technical condition of the house (i.e. all building structures and parts) is used, specifically when it is not possible to conduct a detailed technical survey and detailed information is not available. Technical condition, often represented by age, is a significant price-setting factor in several research studies. However, the method of evaluating a specific condition is not usually described (Ventolo and Williams, 2005; Owusu-Manu et al., 2019; Rong and Sun, 2014; Ooi et al., 2014). Based on the market knowledge, a large number of sold houses were built in the past and repeatedly renovated and rebuilt. The paradigm that houses in the poor technical condition is hardly sold and are available for a long TOM is common in the community of professionals in the Czech Republic. In fact, Mcgreal et al. (2009) supports this paradigm by stating that the “oldest properties take longer to sell.” Nonetheless, there is no consensus on this issue. In Filippova and Fu’s (2011) research, the effect of the condition of building on TOM was not proved. Additionally, liquidity, represented by TOM, affects selling price (Filippova and Fu, 2011; Hui and Yu, 2012; Anderson et al., 2013; An et al., 2013; Mcgreal et al., 2009; He et al., 2020).
Thus, there is no standard or strict framework or recommendations on how to address the technical condition of houses in determining their market value in the Czech Republic. The research reacts to this gap and brings the framework of technical factors as well as the implementation of the liquidity indicator in the analysis of the market and determination of market value, respectively.
2. Objectives
This study aims to propose a framework for addressing the technical condition of houses, based on market value and empathy with the most significant housing structures, and recommend appropriate price-setting factors that can be easily used and are relevant to the local Czech market.
Based on these objectives, the two hypotheses are as follows:
Specific variables related to the technical condition of houses (such as the condition of the roof, condition of windows, condition of the bathroom, condition of façade and year of construction) can be replaced by a generalized single technical condition variable.
Houses in bad technical condition (i.e. house to refurbishment, house to demolition) spend a longer TOM than new houses.
This research supports professionals engaged in expert and appraisal practices and those in the real estate sector. As mentioned above, research focused on the price-setting factors of houses in the Czech Republic is limited, thus, making this study unique. The proposed framework can be used to support current valuation approaches. Additionally, it helps to understand the relationships among the technical condition determinants and their correct use. The preference for selling prices makes this different from other works focused on price-setting factors (Özsoy and Şahin, 2022; Gordon and Winkler, 2016; Khezr, 2015; Hui and Yu, 2012; Endel et al., 2020).
3. Literature review
Several factors affect the residential property value: location, housing type, accommodation (e.g. number of bathrooms), design and layout, energy performance, number of storeys, extent of grounds, gardens, site topography, state of repair, finishing standard and historical association (Shapiro et al., 2012). The authors preferred the segmentation of variables by Sirmans et al. (2005). Housing properties have several characteristics (price-setting factors) that may affect their value. These characteristics can be divided into the following groups: neighborhood, location, public services, external environment, structural elements, internal elements, external elements, marketing and sales factors and financial (Sirmans et al., 2005).
3.1 Neighborhood and location
Several studies label locality as a significant price-setting factor (Haider and Miller, 2000; Ferlan et al., 2017; Rong and Sun, 2014; Kliment et al., 2020; Mbachu and Lenono, 2005; Nachem, 2007; Anon, 2014; Frew and Wilson, 2002). It usually includes the availability of services, such as schools, work options, stores, social life opportunities and good interconnectivity to the city center. Price setting factors related to public services are considered e.g. He et al. (2020) and Zoppi (2015). At the local level, the price of flats was examined in Prague, the capital of the Czech Republic. Every extra minute of the commute to the city center was found to have a negative impact on the price of an average apartment. (Lukavec and Kadeřábková, 2017)
The group characteristics of public services overlap with the location of the group neighborhood. For example, Czinkan and Horváth (2019) estimated house prices to be lower by 11% if the distance from the center of the microregion in Hungary is about ten minutes.
3.2 External environment
This group is covered by the neighborhood and locality characteristics; however, some factors can be highlighted. From the perspective of positive effects on the price, lake or ocean view and availability of greenery are discussed (Jim and Chen, 2010; Anon, 2014; Ferlan et al., 2017). Conversely, some negative effects on the price are highlighted due to higher noise and air pollution levels (Burinskiene et al., 2011; Mccord et al., 2018). This is often connected to some local sources of pollutants in the neighborhoods, such as livestock farms, industrial zones and roads (Brandt and Maennig, 2011; Chen et al., 2013; Sirmans et al., 2005).
3.3 Structural elements
The size of the houses was often discussed in characterizing houses (Yavas and Yang, 1995; Ferlan et al., 2017; Nachem, 2007; Rodgers, 1994; Burinskiene et al., 2011; Özsoy and Şahin, 2022; Wickramaarachchi et al., 2021; Tomal, 2021; Abidoye and Chan, 2016). However, the objective age and house condition are analyzed in detail. Broadly, age and technical conditions are significant price-setting factors (Ventolo and Williams, 2005; Owusu-manu et al., 2019; Rong and Sun, 2014; Ooi et al., 2014). More specifically, Ooi et al. (2014) used the Construction Quality Assessment System to follow the impact of construction quality on housing prices, examining nearly 100,593 sale transactions in Singapore. The authors found strong evidence that selling prices of houses and rate of appreciation are related to the construction quality of new homes. This effect was confirmed in both primary and secondary markets. The authors further highlight that good-quality houses will also generate higher capital gains for owners and investors in the future (Ooi et al., 2014). Contrastingly, Özsoy and Şahin (2022) found no price effect of the age of the house in the research they conducted in the city of Izmir, Turkey. They used ordinary least squares (OLS) regression and a quantile regression model based on listing prices. Researchers from the USA analyzed a large amount of data, specifically 322,433 residential sales during the period 2012–2015, and proved that the condition of the house has a significant influence on property value. However, the authors point out that technical condition is not a widely used variable in pricing models. This analysis also found that the impact of property conditions on price is lower when market conditions are strong. In contrast, when market conditions are weak, the condition of the property has a significant impact on price (Miller et al., 2018). Energy labels must also be considered, and some studies found that these were price-setting factors (Hyland et al., 2013; Brounen and Kok, 2011; Chegut et al., 2020). A study by Xu et al. (2017) provides a unique method of decomposing house prices to the price of land and the price of the structure of the house. Their study states that the increasing age of a house may not have a negative impact on prices and that even older houses have a higher price-growth rate than houses of lower age.
3.4 Internal and external elements
As part of the equipment of houses, two categories are considered. There are several research studies considering internal and external elements, including a fireplace (Rodgers, 1994), air conditioner (Yavas and Yang, 1995; Khezr, 2015; Rodgers, 1994; Wickramaarachchi et al., 2021), swimming pool (Khezr, 2015), balcony (Khezr, 2015; Mesthrige and Ka, 2017), number of parking spaces, (Cirman et al., 2015; Wickramaarachchi et al., 2021; Khezr, 2015; Özsoy and Şahin, 2022) number of bathrooms (Yavas and Yang, 1995; Ferlan et al., 2017) and heating (Yavas and Yang, 1995; Rodgers, 1994). The results and significant levels vary by country.
3.5 Marketing and sales and financial factors
As these are economically related categories, both are again considered together. Specifically, the focus is on the liquidity indicator TOM. Macroeconomic factors are suppressed because researchers focused only on the local market – the Czech Republic (Section 4.1).
TOM is a basic health indicator of the housing sector (Cesaroni, 2022). Typically, it is measured based on the time it takes to sell a property (Cheng et al., 2008). It can be defined by the formula: TOM (ΔT = TM – E(TA)) (Bucchianeri and Minson, 2013), where TM is the date of sale, in the conditions of the Czech Republic’s submission of a proposal for a deposit into the cadastre of real estate; and E(TA) is an estimate of the date of the initial posting in the advertisement.
The real estate market efficiency indicator can be also represented by IΔP (IΔP = PM/E[PA]), where IΔP represents the index of price change; PM is the selling price; E(PA) is an estimate of the initial asking price, share between initial asking price (i.e. estimation of asking price should be burdened with as little variance as possible) and selling price (i.e. with its unequivocal selling time days).
There is no clear opinion on the relationship between TOM and selling price. Some studies found that selling price is affected by TOM – i.e. both positively and negatively – (Anderson et al., 2013; An et al., 2013; Mcgreal et al., 2009) and a nonlinear relationship was also indicated (He et al., 2020). Conversely, some studies did not find any influence of TOM on selling price (Anglin et al., 2003). In fact, TOM can be also affected by the availability of houses, transport connectivity or distance from the city center (Wickramaarachchi et al., 2021).
Very often, the size of the house is considered as a TOM-affecting factor (Mcgreal et al., 2009; Rossini et al., 2010; Jud et al., 1996; Li, 2004) Likewise, the age of the house and its technical condition are discussed as TOM-affecting factors (Mcgreal et al., 2009; Rossini et al., 2010; Filippova and Fu, 2011; Linggar et al., 2019).
Mcgreal et al. (2009) state that older properties take a longer time to sell. Increasing TOM as the building age rises is also confirmed (Linggar et al., 2019). Consistent with the research of Rossini et al. (2010), older houses get sold quickly through auctions in Adelaide, Australia. Conversely, any significant impact of the building condition on TOM was not indicated in Filippova and Fu’s (2011) study.
4. Data and methodology
4.1 Primary database
The primary database is a sample of 631 sold houses. The database was compiled by houses located in the district of Brno–venkov for the period March 2017 to February 2020. The district of Brno–venkov is a relatively compact urban area with approximately 222,300 inhabitants and is connected to Brno city, which has approximately 380,000 inhabitants. This area was chosen due to the similar accessibility to the city under the Brno metropolitan area, thus, offering relatively similar living conditions. It is examined using a microeconomic approach, and macroeconomic factors are not considered. Macroeconomic terms are assumed to be equal in the district because all macroeconomic indicators, such as unemployment rate, average wage, gross domestic product and inflation, are monitored at the district level and found to be equal for all municipalities.
4.2 Data collection
The database is composed of sales that were made in the form of an asking price mechanism and do not contain sales made through an auction or otherwise.
The database was first compiled from advertising published on a real estate portal (www.sreality.cz). Individual samples from real estate advertisements were tracked continuously and examined for core information from the Land Register. For individual samples, an asking price, a photograph of the object and a description available from the advertisement were first captured. During the period under study, the database was regularly expanded and checked for the selling price of individual houses. For each house, several data were registered, such as the cadastral territory, address (global positioning system), asking price and selling price, TOM, year of the sale, usable area of the house, size of the plot and other information contained in the real estate advertisement, including pictures of the property’s interior design and exterior architecture.
4.3 Variables
As the price-setting factors, variables were chosen and determined based on the specific housing market in the Czech Republic and the literature review. As stated, macroeconomic factors are assumed to be the same for all houses. Descriptive statistics summarize a given data set with all the included variables. Nominal variables have no measurement of variability and inherent rankings. Table 1 presents an overview of used price-setting factors. Variables inspired or related to other research are: asking price, useable area, area of building plot, size of municipality, distance from Brno city, IΔP, TOM, year of sale, risk of flood, direct train connection to Brno, direct bus connection to Brno, parking possibilities, swimming pool, air conditioner, heating system, energy label, technical condition, bathroom, year of construction, balcony/terrace, change in asking price and number of times the property was advertised. Locally related variables are new houses per inhabitant, Metropolitan area and other appliances.
Summary statistic of the variables
| Variable | Mean | SD | Min | Max |
|---|---|---|---|---|
| Asking price | 4 569,639.94 | 2 967,580.92 | 360,000.00 | 24,900,000.00 |
| Usable area | 181.26 | 94.52 | 30.00 | 772.00 |
| Area of building plot | 713.65 | 648.57 | 36.00 | 5,800.00 |
| Distance from Brno city | 16.29 | 8.14 | 1.20 | 36.50 |
| Size of municipality | 2,679.98 | 2,717.41 | 65.00 | 10,997.00 |
| IΔP | 0.88 | 0.15 | 0.14 | 1.84 |
| Time on market | 248.22 | 175.92 | 10.00 | 1,075.00 |
| Year of sale | 1.21 | 0.84 | 0.00 | 3.00 |
| New houses per inhabitant | 0.05 | 0.04 | 0.00 | 0.00 |
| Risk of flood | 0.11 | Dummy | ||
| Direct train connection to Brno | 0.30 | Dummy | ||
| Direct bus connection to Brno | 0.60 | Dummy | ||
| Parking possibilities | 1.31 | Dummy | ||
| Swimming pool | 0.12 | Dummy | ||
| Other appliances | 0.48 | Dummy | ||
| Fireplace | 0.17 | Dummy | ||
| Air conditioner | 0.03 | Dummy | ||
| Cost level of interior | 0.08 | Dummy | ||
| Number of flats | 0.16 | Dummy | ||
| Material base | 0.01 | Dummy | ||
| Number of floors | 0.57 | Dummy | ||
| Heating system | 0.97 | Dummy | ||
| Energy label | 0.00 | Dummy | ||
| Technical condition | 1.48 | Dummy | ||
| Shape of roof | 0.95 | Dummy | ||
| Roof material | 2.11 | Dummy | ||
| Roof elements | 2.82 | Dummy | ||
| Condition of roof | 0.97 | Dummy | ||
| Condition of windows | 1.16 | Dummy | ||
| Material base of windows | 0.39 | Dummy | ||
| Bathroom | 1.22 | Dummy | ||
| Façade condition | 0.97 | Dummy | ||
| Position of house | 1.65 | Dummy | ||
| Year of construction | 1.80 | Dummy | ||
| Balcony/terrace | 2.39 | Dummy | ||
| Attic | 0.56 | Dummy | ||
| Metropolitan area | 1.98 | Dummy | ||
| Change in selling price | 0.86 | Dummy | ||
| Number of times the property was advertised | 0.23 | Dummy | ||
To determine the influence of all price-setting factors, these factors were divided into groups based on the study of Sirmans et al. (2005), see in Figure 1.
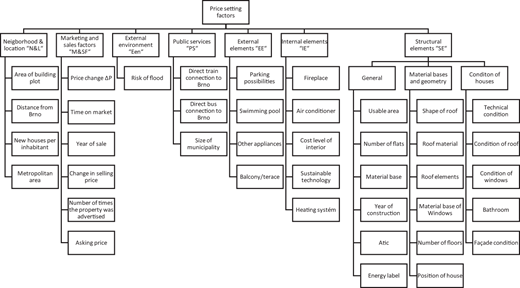
4.3.1 Neighborhood location “N&L”.
The distance from Brno city was considered (kilometers), and the building plot area, metropolitan area and new houses per inhabitant were included in this category.
4.3.2 Public services “PS”.
Price-setting factors for this category were not followed separately. Public services and public amenities are represented based on the size of municipalities and location of municipalities in the metropolitan area of Brno. However, a direct connection by bus or train to Brno was considered. This approach was chosen based on preresearch analysis of the housing market.
4.3.3 External environment “EEN”.
Based on our preresearch analysis, other variables were not included. Price-setting factors, including the source of noise and the existence of historical monuments, especially castles and churches, were tested. Multivariate regression analysis was provided for 98 samples of houses in the Brno–venkov district. The significance of these factors was rejected at 0.05 significance level (Kliment et al., 2020). The risk of the flood was followed.
4.3.4 Structural elements “SE”.
General technical variables such as usable area (sqm), number of flats in the house, number of floors, use of attic, the structure of the house (single, double and terraced) and estimated year of construction (in intervals 0–5, 5–30, 30–70 and above 70 years) were considered. Also, the material base of the house (brick and wood) was included. Wooden houses accounted for only 1% of the houses sold.
The category of material bases and geometry comes from the field of cost valuation and verify the assumption of connection of market value and cost of houses. Especially cost settings factors like the number of floors or roof shape (Alshamrani, 2017; Wang et al., 2006; Elhag et al., 2005). However, this issue will be deeply researched in another article as building components are considered the most significant parts in view of future costs for refurbishment. Also, these elements are easily characterized by pictures.
And finally, the technical condition of the houses was evaluated by applying the general technical conditions and condition of the envelope components (i.e. condition of façade, windows, roof, bathroom and year of construction) separately. The detailed values of variables are presented in Tables 2 and 3.
Distribution of the factor technical condition
| Technical condition | ||
|---|---|---|
| Factor distribution | No. of elements in the database [pcs] | Percentage share [%] |
| New house (up to 5 years) | 60 | 10 |
| Functional obsolescence | 210 | 33 |
| House for refurbishment | 356 | 56 |
| House to demolition | 5 | 1 |
| Total | 631 | 100 |
Distribution of the technical factors
| Variables | Factor distribution | No. of elements in the database [pcs] | Percentage share [%] |
|---|---|---|---|
| Shape of roof | Flat roof | 34 | 5 |
| Sloping (simple) | 592 | 94 | |
| Sloping (complex) | 5 | 1 | |
| Roof material | Foil covering | 8 | 1 |
| Asphalt strips | 3 | 0 | |
| Standard folded roofing | 568 | 90 | |
| Nonstandard folded roofing | 17 | 3 | |
| Sheet metal roofing | 35 | 6 | |
| Roof elements | Dormer | 116 | 18 |
| Roof window | 93 | 15 | |
| Light tube | 0 | 0 | |
| Combination | 0 | 0 | |
| Without roof element | 422 | 67 | |
| Condition of roof | New | 154 | 24 |
| Satisfactory | 354 | 56 | |
| For refurbishment | 112 | 18 | |
| To demolition | 11 | 2 | |
| Condition of windows | Original | 206 | 33 |
| Satisfactory | 119 | 19 | |
| New | 306 | 48 | |
| Material base of windows | Plastic | 386 | 61 |
| Wooden | 245 | 39 | |
| Aluminium | 0 | 0 | |
| Bathroom | New | 99 | 16 |
| After refurbishment | 127 | 20 | |
| Partial refurbishment | 216 | 34 | |
| Original | 189 | 30 | |
| Façade condition | Original | 272 | 43 |
| For refurbishment | 103 | 16 | |
| New | 256 | 41 | |
| Position of house | Detached house (in the middle of the plot) | 19 | 3 |
| Detached house (façade to the street) | 187 | 30 | |
| Terraced house | 425 | 67 | |
| Year of construction | Up to 5 years | 61 | 10 |
| Up to 30 years | 94 | 15 | |
| Up to 70 years | 399 | 63 | |
| Over 70 years | 77 | 12 | |
| Balcony/terrace | Balcony | 96 | 15 |
| Loggia | 2 | 0 | |
| Terrace | 385 | 61 | |
| Oriel window | 1 | 0 | |
| Architectural elements | 1 | 0 | |
| Without balcony/terrace | 146 | 23 | |
| Attic | Attic | 321 | 51 |
| Residential attic | 264 | 42 | |
| Full floor | 46 | 7 |
4.3.5 Internal elements “IE”.
The cost level of interiors (low and high), heating system, sustainable technologies (e.g. renewable energy, solar panels for hot water and photovoltaic panels), fireplace and air conditioning were considered as the internal elements.
4.3.6 External elements “EE”.
Parking possibilities, garage included, swimming pool and other appliances, such as a shed, wine cellar and pergola, are included in the price-setting factors category for external elements. These elements were considered based on knowledge of the local market. It is possible to find other forms of appliances in many cases. In addition, roof elements, such as skylights, sunroofs and the existence of a balcony or a roof terrace were also considered.
4.3.7 Marketing and sales factors, financial factors “M&SF”.
Indicators of market efficiency were considered. The share (IΔP) between the asking price and selling price (realizing a market transaction) was monitored. The reduction in listing price linked to the property’s (i.e. house) size was considered (Gordon and Winkler, 2016). Also, the TOM was monitored for all the database samples. One of the most important determinants of transaction/selling price is the asking price. Finally, a year of sale was registered for the samples. The variable for asking price and the variable change in the asking price were also included in this category, as well as the variable change in the asking price, which relates closely to the variable IΔP. The last variable included in this category is the number of times the property was advertised.
4.4 Methodology
Primary databases and two subdatabases, specified in Section 5, were evaluated via regression analysis. This method is frequently used for estimating a quantity (dependent variables and explanatory variables) according to the knowledge of other quantities (allow variables, explanatory variables and regressors). However, it assumes a linear functional relationship between individual regressors and dependent variables and represents a linear regression model. The linear regression model should be a suitable type of statistical model for obtaining an estimate of continuity that is dependent on variables (e.g. price, price index and insurance value). The most common and simplest method is the OLS estimator. However, this technique is suitable only if the Gauss–Markov assumptions are fulfilled. Usually, more than one regressor (predictor) is used; thus, a multiple linear regression model is needed. One explained variable is always available. Alternative models were tested using a generalized linear modeling approach. The log link function and exponential link function obtained the most accurate results (Seber and Lee, 2012; McMillen, 2004).
5. Correlation
The variables were investigated via the Pearson linear correlation and the Spearman nonparametric correlation. The Pearson correlation indicates a linear relationship between two ratio variables. The Spearman rank correlation specifies the dependence for ordinal data without the assumption of continuous and normally distributed variables.
6. Results
6.1 Correlation between variables
Table 4 shows the dependencies of variables that exceeded 0.40 (Table 4). The correlated variables relate to the technical conditions of the sampled houses. This indicates that it is redundant to analyze the components of the house envelope separately. It is suitable to use only the variable technical condition of the house.
Spearman correlation
| Spearman correlation | |||||||||
|---|---|---|---|---|---|---|---|---|---|
| Variable | Energy label | Technical condition | Condition of roof | Condition of windows | Material base of windows | Bathroom | Façade condition | Year of construction | Attic |
| Technical condition | –0.811058 | 1.000000 | 0.579540 | –0.478040 | 0.446902 | 0.706805 | –0.846930 | 0.656898 | –0.414814 |
| Energy label | 1.000000 | –0.811058 | –0.548676 | 0.483539 | –0.435910 | –0.673074 | 0.755318 | –0.611260 | 0.434231 |
The Spearman correlation was compiled for the ordinal variable, that is, the technical condition. This type of correlation is suitable for nonlinear dependencies robust to outliers. For this reason, this correlation was considered for ordinal variables, such as energy labels and technical conditions.
Pearson correlation x was compiled for the remaining variables. Some correlated variables were detected between the examined house components. We argue that this effect is caused by houses after a complete refurbishment when significant parts of the house envelope components are in very good condition. A strong correlation (0.66) was found between technical condition and year of construction, convincing us to use these two variables together. Even though many houses are classed as after complete refurbishment, higher age of houses was included; however, the house envelope components were in good condition, as good as a new structure. A strong correlation was found between the material base of windows and their technical condition (–0.86). Especially in the case of old houses prior to refurbishment, specifically where original wooden windows were used. Finally, a semi-strong correlation (0.41) between the position of houses and the year of construction can be argued by the typology of houses in the examined locality. The correlation between the attic and the number of floors is obvious. The top floor overlaps the attic, and the same situation is evident for the number of floors and roof elements. Table 5 shows the Pearson correlation with a strong correlation that is above 0.50.
Pearson correlation
| Pearson correlation | |||||||||
|---|---|---|---|---|---|---|---|---|---|
| Variable | No. of floors | Roof elements | Condition of roof | Condition of windows | Material base of windows | Bathroom | Façade condition | Year of construction | Attic |
| Number of floors | 1.000000 | ||||||||
| Roof elements | –0.503584 | 1.000000 | |||||||
| Condition of roof | 1.000000 | ||||||||
| Condition of windows | 1.000000 | ||||||||
| Material base of windows | –0.861150 | 1.000000 | |||||||
| Bathroom | 0.606419 | –0.588403 | 0.505847 | 1.000000 | |||||
| Façade condition | –0.503725 | 0.515089 | –0.653915 | 1.000000 | |||||
| Year of construction | 0.603288 | –0.542990 | 1.000000 | ||||||
| Attic | 0.613246 | 1.000000 | |||||||
6.2 Descriptive statistics: time on market vs technical condition
Descriptive statistics are shown for the two variables TOM and IΔP, according to the technical condition and year of construction. The layout of the examined database is evident in Table 6. Based on the average of TOM, houses in bad technical condition were sold more quickly than houses in good technical condition, labeled as functionally obsolete and new houses, respectively. Similarly, TOM, compared to new houses, was found to be lower by 67 days in the case of “house to demolition” and lower by 18 days for “house to refurbishment.” The difference in TOM between functionally obsolete houses and new houses varies slightly.
Summary statistic of variables technical condition and TOM
| Technical condition | N | Average TOM | Median TOM | St. dev TOM |
|---|---|---|---|---|
| Houses to demolition | 5 | 192.00 | 170.00 | 149.08 |
| Houses to refurbishment | 356 | 240.92 | 191.00 | 173.18 |
| Functional obsolescence | 210 | 258.91 | 204.00 | 177.44 |
| New houses | 60 | 258.73 | 209.00 | 190.79 |
The trend of lower TOM for houses in bad technical condition was confirmed by dividing houses by year of construction and age, respectively.
A clear trend was found for IΔP, but none was found for the variables technical condition and year of construction. IΔP represents the share between asking price and the selling price. Results vary slightly by up to 5%. This applies to the division according to the technical condition and year of construction (Table 7).
6.3 Regression
The price of real estate – selling price, for the purpose of this study – is considered a dependent variable, and the remaining variables should determine the price as predictor. The computed model using the OLS estimator under the Gauss–Markov assumption provided adj. R2 = 0.8878, indicating a good determination of variables (Table 8). This also confirmed the appropriate choice of predictors.
Results of OLS [dependent variable Ln (price)]
| OLS | |||
|---|---|---|---|
| Regression results | Ln (price) | ||
| Variable | coefficient | t stat | p-value |
| Intercept | 13.16083 | 87.09243 | 0.000000 |
| Asking price | 0.00000 | 19.55976 | 0.000000 |
| Usable area | 0.00028 | 2.30707 | 0.021396 |
| Area of building plot | 0.00006 | 3.44652 | 0.000608 |
| Distance to Brno | –0.01007 | –6.26363 | 0.000000 |
| Size of municipality | 0.00000 | 0.18120 | 0.856276 |
| ΔP | 1.30920 | 19.05303 | 0.000000 |
| Time on market | –0.00012 | –1.76871 | 0.077458 |
| New houses per inhabitant | –0.10956 | –0.40578 | 0.685052 |
| Year of sale | 0.02373 | 1.79547 | 0.073089 |
| Risk of flood | –0.02833 | –0.93267 | 0.351372 |
| Direct train connection to Brno | 0.01747 | 0.72887 | 0.466370 |
| Direct bus connection to Brno | 0.07195 | 3.13359 | 0.001812 |
| Parking possibilities | 0.05880 | 4.49415 | 0.000008 |
| Swimming pool | –0.01646 | –0.48685 | 0.626542 |
| Other appliances | 0.05465 | 2.70736 | 0.006978 |
| Fireplace | –0.05197 | –1.83759 | 0.066625 |
| Air conditioner | 0.00257 | 0.04446 | 0.964555 |
| Cost level of interior | –0.09486 | –2.19802 | 0.028334 |
| Number of flats | 0.07894 | 3.01421 | 0.002687 |
| Material base | –0.01243 | –0.14390 | 0.885628 |
| Energy label | 0.01278 | 0.74252 | 0.458065 |
| Number of floors | 0.09040 | 3.13312 | 0.001815 |
| Heating system | 0.10066 | 5.87129 | 0.000000 |
| Technical condition | 0.02210 | 0.65950 | 0.509833 |
| Shape of roof | 0.04156 | 0.80577 | 0.420697 |
| Roof material | 0.00882 | 0.43764 | 0.661806 |
| Roof elements | –0.00244 | –0.34059 | 0.733531 |
| Condition of roof | –0.06816 | –3.82831 | 0.000143 |
| Condition of windows | –0.00995 | –0.43270 | 0.665387 |
| Material base of windows | –0.08055 | –2.07703 | 0.038231 |
| Bathroom | –0.04768 | –3.01603 | 0.002671 |
| Façade condition | 0.03159 | 1.62906 | 0.103832 |
| Position of house | –0.05317 | –2.57463 | 0.010277 |
| Year of construction | –0.00474 | –0.22766 | 0.819987 |
| Balcony/terrace | –0.01973 | –2.94737 | 0.003331 |
| Attic | 0.01390 | 0.56040 | 0.575417 |
| Metropolitan area | 0.00808 | 0.83689 | 0.402993 |
| Change in selling price | 0.06306 | 2.21125 | 0.027400 |
| Number of times the property was advertised | 0.02387 | 1.00694 | 0.314377 |
A second model was based on the generalized linear modeling approach. The log link function was determined to be better than other models based on a comparison of the Akaike information criterion (AIC) and the Bayesian information criterion (BIC) (Chakrabarti and Ghosh, 2011). The AIC is a statistic that considers both the likelihood of the model and its complexity. In contrast to the AIC, the BIC severely penalizes complex models (Seber and Lee, 2012; Mcmillen, 2004; Chakrabarti and Ghosh, 2011).
In the case of the log link function, the Wald test was used for all the variables and the results of the generalized linear model (GLM) were preferred over those of the OLS model because of their higher accuracy, see Table 9.
Results of GLM (dependent variable Ln (price))
| GLM | ||
|---|---|---|
| Regression results | Ln(price) | |
| Variable | Wald. stat. | p-value |
| Intercept | 84,416.86 | 0.000000 |
| Asking price | 322.87 | 0.000000 |
| Usable area | 5.15 | 0.023268 |
| Area of building plot | 17.67 | 0.000026 |
| Distance to Brno | 18.02 | 0.000022 |
| Size of municipality | 0.22 | 0.635797 |
| IΔP | 388.72 | 0.000000 |
| Time on market | 1.60 | 0.205310 |
| New houses per inhabitant | 0.00 | 0.972808 |
| Year of sale | 8.45 | 0.037618 |
| Risk of flood | 0.43 | 0.511082 |
| Direct train connection to Brno | 0.06 | 0.809022 |
| Direct bus connection to Brno | 9.11 | 0.002546 |
| Parking possibilities | 42.80 | 0.000000 |
| Swimming pool | 0.22 | 0.641458 |
| Other appliances | 4.42 | 0.035484 |
| Fireplace | 4.28 | 0.038608 |
| Air conditioner | 0.02 | 0.899962 |
| Cost level of interior | 5.21 | 0.022398 |
| Number of flats | 8.49 | 0.014304 |
| Material base | 0.22 | 0.636429 |
| Energy label | 7.27 | 0.063756 |
| Number of floors | 6.42 | 0.011284 |
| Heating system | 37.83 | 0.000000 |
| Technical condition | 9.19 | 0.026893 |
| Shape of roof | 0.46 | 0.796451 |
| Roof material | 8.98 | 0.061538 |
| Roof elements | 0.9 | 0.636487 |
| Condition of roof | 19.98 | 0.000172 |
| Condition of windows | 1.2 | 0.548886 |
| Material base of windows | 2.13 | 0.144524 |
| Bathroom | 22.72 | 0.000046 |
| Façade condition | 1.97 | 0.373808 |
| Position of house | 10.71 | 0.004726 |
| Year of construction | 9.01 | 0.029149 |
| Balcony/terrace | 9.62 | 0.086651 |
| Attic | 2.19 | 0.334447 |
| Metropolitan area | 3.03 | 0.386705 |
| Change in selling price | 5.43 | 0.019842 |
| Number of times the property was advertised | 0.34 | 0.560937 |
The GLM exponential link function was considered, and the result varied only slightly and did not bring any significant changes as compared to the first GLM model.
Following hypothesis H1, two subdatabases (A and B) were modified from the primary database and examined. The selection of variables is based on previous OLS and GLM analyses. This step was made because these variables are found to be statistically significant at the 0.05 level, see Table 10.
Results of GLM subdatabase 2A a 2B [dependent variable Ln (price)]
| GLM | GLM | |||
|---|---|---|---|---|
| Regression results | 2A | 2B | ||
| Subdatabase | Ln(price) | Ln(price) | ||
| Variable | Wald. stat. | p-value | Wald. stat. | p-value |
| Intercept | 138523.6 | 0.000000 | 169,609.9 | 0.000000 |
| Asking price | 415.6 | 0.000000 | 376.3 | 0.000000 |
| Usable area | 4.5 | 0.034291 | 7.2 | 0.007407 |
| Area of building plot | 8.5 | 0.003491 | 12.3 | 0.000449 |
| Distance to Brno | 38.6 | 0.000000 | 49.5 | 0.000000 |
| IΔP | 395.6 | 0.000000 | 394.7 | 0.000000 |
| Year of sale | 6.0 | 0.112089 | 5.1 | 0.161405 |
| Direct bus connection to Brno | 7.8 | 0.005295 | 16.1 | 0.000060 |
| Parking possibilities | 31.3 | 0.000000 | 43.8 | 0.000000 |
| Other appliances | 6.1 | 0.013504 | 3.7 | 0.055375 |
| Fireplace | 4.0 | 0.044611 | 4.9 | 0.026989 |
| Cost level of interior | 6.4 | 0.011132 | 4.8 | 0.029112 |
| Number of flats | 7.5 | 0.023046 | 7.0 | 0.030139 |
| Number of floors | 39.2 | 0.000000 | 22.1 | 0.000003 |
| Heating system | 62.7 | 0.000000 | 36.8 | 0.000000 |
| Technical condition | 83.6 | 0.000000 | ||
| Position of house | 6.1 | 0.047345 | 8.4 | 0.015358 |
| Change in asking price | 2.1 | 0.142771 | 3.3 | 0.070168 |
| Condition of roof | 37.0 | 0.000000 | ||
| Condition of windows | 5.6 | 0.061417 | ||
| Bathroom | 26.5 | 0.000008 | ||
| Façade condition | 5.6 | 0.059530 | ||
| Year of construction | 9.4 | 0.024809 | ||
The components of the house envelope were divided into several variables. Variables from a group of structural elements “SE” were distributed to A and B subdatabases. In subdatabase A, the variable technical condition is included as a single variable to reflect the technical condition of houses. In subdatabase B, technical condition is distributed to variables, such as condition of roof, condition of window, bathroom, condition of façade and year of construction.
Based on the Wald test, values for the variable technical condition “functional obsolescence” and “new” showed the highest positive impact on selling price.
Descriptions of the variables and values are given below (Table 11). Subdatabase B contains more specified technical conditions represented by five variables. These variables follow the condition of the main parts of the building envelope, namely, the windows and roof. Comparing the Wald stat, the highest effect on selling price were from the variables technical condition and “functional obsolescence.”
Descriptions of the variables and values technical condition for GLM
| Variable | Value | Estimate | Wald. stat | p |
|---|---|---|---|---|
| Technical condition | New | 0.018271 | 44.6 | 0.000000 |
| Technical condition | functional obsolescence | 0.016645 | 53.8 | 0.000000 |
| Technical condition | house for refurbishment | 0.005082 | 44,625 | 0.021800 |
Based on the Wald stat, the highest effect on selling price were from the variables, such as the condition of roof, “satisfactory”; condition of windows, “original”; bathroom, “new”; condition of façade, “original”; and year of construction, “up to 70 years.”
Based on a comparison of the AIC and BIC of subdatabases A and B, subdatabase B was determined to be better. Lower AIC and BIC values indicate a better ability of the model to fit the observed data. Thus, models with lower AIC and BIC values are preferred (Seber and Lee, 2012; McMillen, 2004) see Table 12.
7. Framework and discussion
Following the research objective, proposing a framework for professionals in the Czech Republic focused on appropriately reflecting the technical conditions of houses in market value estimation and defining the most affecting price-setting factors are inseparable.
H1 Specific variables related to the technical condition of houses (such as the condition of roof, condition of windows, condition of bathroom, condition of façade and year of construction) can be replaced by a generalized single technical condition variable.
This hypothesis is slightly rejected based on a comparison of the AIC and BIC of subdatabases A and B. The subdatabase B reports a better model ability to fit the observed data and a higher informative value of the model. Using detailed variables leads to a reduction in both AIC and BIC. However, the decrease in AIC and BIC is not dramatic. Therefore, it is doubtful if the time spent on detailed analysis is properly appreciated. The authors recommend a proper analysis of the various envelope components, such as roof, façade, windows and interior condition. If the condition of these components varies slightly, it could be sufficient to reflect technical condition to a generalized single technical condition variable. After all, researchers often tend to use a single variable to represent the technical condition of a house (Miller et al., 2018; Ooi et al., 2014). However, if the condition of the various envelope components significantly varies, it is beneficial to take into account the partial conditions of individual components as proposed subdatabase by B.
Also, there are studies using the age of a house (Xu et al., 2017; Owusu-manu et al., 2019; Sirmans et al., 2005; Rong and Sun, 2014). This is not practical because houses can be refurbished, and the property’s age is misleading. As stated by Marsh (2017), especially in Europe, it is not common to consider the demolition of houses at the end of their life cycle. Thus, the valuator’s task is to consider proper variables.
H2 Houses in bad technical condition (i.e. house to refurbishment, house to demolition) spend a longer TOM than new houses.
This hypothesis was rejected based on the results shown in Table 6. The variable “house to refurbishment” had an average TOM of 241 days, whereas new houses had an average TOM of 259 days. Houses set for demolition had an average TOM of 192 days, compared to functional obsolescence houses, which had an average TOM of 259. Notwithstanding, there are only five houses labeled as houses to demolition.
On average, houses in bad technical condition (house to refurbishment) have a shorter TOM than new houses. Specifically, houses to refurbishment have an average of 18 days less TOM than new houses.
Also, H2 represents paradigm, which is common among the community of professionals in the Czech Republic, was not confirmed. The study results can be identified with the results of Filippova and Fu (2011). The impact of the condition of the building on TOM was not proved.
As a part of the objective, price-setting factors are recognized and can be applied in the Czech local market. It arose as a by-product of our analysis of price-setting factors focused on technical conditions.
The following summary comprises the variables that are recommended to be used in determining the market value and the list of other studies that consider these variables to be significant. The group of “N&L” contains the following variables of the area of building plot and locality, represented in this research by distance to the city of Brno (Ferlan et al., 2017; Rong and Sun, 2014; Kliment et al., 2020; Mbachu and Lenono, 2005; Nachem, 2007; Anon, 2014; Frew and Wilson, 2002). In the “PS” group, direct bus connectivity (Lukavec and Kadeřábková, 2017; Czinkan and Horváth, 2019) is recommended. Significant variables in the “M&SF” group are the asking price, price change IΔP, year of sale and nominal variable change in the asking price. The authors recommend adjusting the samples used to determine the market value; for example, by IΔP coefficient according to the local market situation. The significant variables in the “EE” group include parking possibilities (Cirman et al., 2015) and other appliances, such as a shed, wine cellar or pergola. From the “IE'” group, the following variables are recommended: fireplace (Rodgers, 1994) and cost level of interiors. The general and geometric variables from the “SE” group are usable areas (Yavas and Yang, 1995; Ferlan et al., 2017; Nachem, 2007; Rodgers, 1994; Burinskiene et al., 2011; Wickramaarachchi et al., 2021; Özsoy and Şahin, 2022; Tomal, 2021; Abidoye and Chan, 2016) number of flats, heating system and position of the house. The remainder price-setting factors are included in H1.
8. Conclusions
The first part of the research aims at the missing framework for using a variable of technical condition of houses to determine the market value. This is represented by H1: specific variables related to the technical condition can be replaced by a generalized technical condition variable that was rejected. Based on a comparison of AIC and BIC, subdatabase B reports a slightly better value. The subdatabase B contains specific variables, such as the condition of the façade, windows, roof, bathroom and age or year of construction. Authors recommend using the generalized single technical condition variable only in the case when the technical condition of separate components varies slightly. Nonetheless, the consideration of individual envelope components is preferred.
The second part of the research is represented by H2: Houses in bad technical condition (i.e. house to refurbishment and house to demolition) spend shorter TOM than new houses. Based on the analysis, TOM was found to be lower by 67 days in the case of the “houses to demolition” and by 18 days for houses to refurbishment compared to new houses. The difference in TOM between functional obsolescence houses and new houses varies slightly. No influence of technical conditions on IΔP was proved.
The most significant price-setting factors useful for the determination of the market value by professionals in the Czech Republic in the segment of housing were recommended, such as the usual price-setting factors of locality, asking price, size of the house or direct bus connection to the city of Brno. Additionally, less typical price-setting factors were proved to be significant, such as number of flats (in the case of multi-flat houses), the existence of fireplace or the availability of parking space.
The results of research, especially reconditioning of technical condition framework as well as an overview of the most significant price-setting factors, could be eventually implemented into legislative regulations regarding market value determination. However, this research is concerned with the microeconomic context of the metropolitan area of Brno city only.
The next step of our research will be the creation of a probit model and a two-stage least squares model for the IΔP and TOM variables. These findings will be useful for real estate experts and appraisers, and real estate agents.
The paper was supported by Specific Research of Institute of Forensic Engineering (id. No. FAST/ÚSI-J-20-6366) internal grant of Brno University of Technology.
