


This study aims to investigate the effect of vibration on ceramic tools under dry cutting conditions and find the optimum cutting condition for the hardened steel machining process in a computer numerical control (CNC) lathe machine.
In this research, an integrated fuzzy TOPSIS-based Taguchi L9 optimization model has been applied for the multi-objective optimization (MOO) of the hard-turning responses. Additionally, the effect of vibration on the ceramic tool wear was investigated using Analysis of Variance (ANOVA) and Fast Fourier Transform (FFT).
The optimum cutting conditions for the multi-objective responses were obtained at 98 m/min cutting speed, 0.1 mm/rev feed rate and 0.2 mm depth of cut. According to the ANOVA of the input cutting parameters with respect to response variables, feed rate has the most significant impact (53.79%) on the control of response variables. From the vibration analysis, the feed rate, with a contribution of 34.74%, was shown to be the most significant process parameter influencing excessive vibration and consequent tool wear.
The MOO of response parameters at the optimum cutting parameter settings can significantly improve productivity in the dry turning of hardened steel and control over the input process parameters during machining.
Most studies on optimizing responses in dry hard-turning performed in CNC lathe machines are based on single-objective optimization. Additionally, the effect of vibration on the ceramic tool during MOO of hard-turning has not been studied yet.
1. Introduction
Hardened steel's superior mechanical and thermal properties (high indentation resistance, hot hardness, high abrasiveness and modulus of elasticity ratio) have increased their use in the automotive, bearing and die-mold manufacturing industries (Mia and Dhar, 2017). To meet the increasing demand for hardened steel, maintaining product quality and minimizing the time to market without affecting the environment are very important in the current competitive market (Anand et al., 2019). To do that manufacturers often choose newer technologies over conventional approaches like grinding or heat-assisted machining. Again, these conventional approaches often have some crucial drawbacks, such as the need for additional setup changes in processes like grinding and alteration of the microstructure of the workpiece due to uneven heating and cooling during heat-assisted machining (Aouici et al., 2012; Agrawal et al., 2015). To make the production process of hardened steels economically sustainable and efficient, manufacturing industries are currently more enthusiastic about performing dry hard-turning operations at room temperature, which reduces the necessity for additional processing such as grinding (Bouzid et al., 2014). Dry hard-turning also facilitates the hard-turning operation seamlessly without affecting the environment too much and incorporating additional costs that are associated with the application of cutting fluids (Mia and Dhar, 2018).
In automated production, modern industries are trying to control the hard-turning process's input parameters by monitoring the tool's vibration signal. During machining, vibration in the cutting tool generates excessive tool wear, which can result in tool damage and a rough surface finish (Zeng et al., 2012). As a result, the manufacturing industry aims to decrease vibration to produce highly accurate machined surfaces and reduce tool wear to increase productivity (Devillez and Dudzinski, 2007). In this regard, to predict tool wear, mathematical modeling is often used to analyze the relationship between tool wear and vibration (Simon and Deivanathan, 2019; Herwan et al., 2019; Bagga et al., 2021).
To have precise and accurate control over the input parameters, optimization of the response parameters is required (Asiltürk et al., 2016). The optimum cutting condition reduces tool wear, surface roughness (Ra), cutting force and cutting power consumption, which eventually increases the productivity of the machining operation. Hence, researchers have utilized several advanced optimization techniques for the multi-objective optimization (MOO) of dry machining of hardened steels with ceramic tools, which include methods like response surface methodology (RSM), grey relational analysis (GRA), particle swarm optimization (PSO) method, artificial neural network and so on (Panda et al., 2020; Kursuncu and Biyik, 2021; Bagga et al., 2021).
Though the dry hard-turning operation is eco-friendly and free from the additional cost of cutting fluids, the responses of the machining parameters need to be optimized simultaneously considering the effect of vibration. No study has yet attempted MOO of cutting parameters using the fuzzy TOPSIS-based Taguchi method, considering the impact of vibration on the tool wear mechanism of ceramic tool wear. This study, thereby, intends to fill this gap in the literature by addressing the following research questions (RQs).
What is the optimum cutting condition for the MOO of dry hard-turning of steels using the ceramic tool?
What is the influence of each input parameter on the response parameters, during the simultaneous optimization of the responses?
What is the effect of vibration on the wear of the ceramic cutting tool, during the simultaneous optimization of the responses?
To accomplish the aforementioned RQs, a MOO technique combining the fuzzy TOPSIS and Taguchi method has been used in this study for the simultaneous optimization of the responses (Ra, cutting force, material removal rate and cutting power consumption). This study integrated these two methods for several reasons. The fuzzy TOPSIS method is capable of converting the responses into a single response and there is a lack of studies on implementing this method in the simultaneous optimization of dry hard-turning (Roy and Dutta, 2019). Additionally, this method allows the participation of the decision makers or experts in the process of weighing the performance characteristics for determining effective optimum solutions, whereas other MOO techniques like RSM and Taguchi-GRA lack the scope of incorporation of experts' opinions (Panda et al., 2016; Sahu and Andhare, 2017; Sharma et al., 2021). The second method used in this research is the Taguchi method, which allows the determination of the optimum solution based on the signal-to-noise ratio (S/N ratio) (Mia and Dhar, 2017). The optimal solution is achieved by calculating the S/N ratio, which is robust since it is less sensitive to variations in responses (Gurugubelli et al., 2022). Subsequently, the effects of individual cutting parameters on the vibration and wear mechanism of the ceramic tool wear have been examined during the study of the MOO, utilizing the analysis of variance (ANOVA) method. ANOVA can successfully determine the statistical significance of input parameters on the responses in the optimization of machining parameters (Mia and Dhar, 2017).
The findings of this study are expected to facilitate the dry hard-turning operations of steel since the optimum cutting parameter settings will reduce the effect of vibration, which will lead to the prevention of chipping in ceramic tools, along with the reduction of Ra, cutting force, cutting power consumption and maximization of material removal rate. This simultaneous optimization of the response parameters will increase the life of cutting tool and reduce material waste (Panda et al., 2016; Prasad and Babu, 2017). Previous studies on the optimization of the dry hard-turning mainly focus on the optimization of the responses without the consideration of the effects of vibration on tool wear (Panda et al., 2017; Campos et al., 2017; Meddour et al., 2018; Labidi et al., 2018; Mia and Dhar, 2017). In this regard, this research contributes to the literature on dry hard-turning operations by allowing more robust control of the input parameters and reducing the effects of vibration while simultaneously optimizing the machining responses. Moreover, the findings of this research can improve the productivity of the hardened steel manufacturing industries by reducing the setup time and additional cost required for tool change due to the premature failure of ceramic tools caused by the application of excessive cutting force and vibration. In hardened steel manufacturing industries, surface finish is another important machining response for quality manufacturing that can be improved with the application of this optimum cutting parameter. This will also eliminate the requirement of various finishing operations like grinding or honing. This study will allow manufacturing industries to reduce production costs by utilizing the optimized cutting parameters for dry hard-turning and reducing setup time and cost required for cutting fluid application, thus leading to more eco-friendly and sustainable machining.
The remainder of this article is organized as follows: Section 2 presents a systematic review of relevant literature. Section 3 presents the experimental procedures and methodologies. Section 4 presents the analysis and results. Section 5 presents the discussion. Finally, Section 6 refers to the conclusions section of the paper.
2. Literature review
2.1 Dry hard-turning
Hard-turning of steel under dry cutting conditions has become immensely advantageous as no additional cutting fluid is involved making the process cost-effective and eco-friendly (Anand et al., 2019). Cutting fluid disposal is quite difficult, and contact with the skin of the operator results in serious health problems, which makes it difficult to perform hard-turning (Davim, 2008). To facilitate the dry hard-turning process, ceramic cutting tools are frequently utilized to machine hardened steels owing to the fact that ceramic tools have high hot hardness and chemical resistance at elevated temperatures. For example, Panda et al. (2016) studied the hard-turning operations with mixed ceramic where Ra and tool flank wear were optimized using a combination of GRA and the Taguchi technique. A wiper ceramic insert was employed in the dry hard-turning of AISI 52100 steel by Campos et al. (2017) with the application of principal component analysis and RSM to determine the optimum machining conditions. Panda et al. (2017) employed RSM and PSO to optimize the cutting parameters in response to Ra in the study of hardened steel (AISI 4340) turning under dry conditions. According to their research, the nose radius of the ceramic tool, along with the feed rate, were the two most important input parameters for hard-turning. Mia and Dhar (2018) found RSM to be an effective tool in modeling Ra during dry hard-turning, where material hardness appeared as the most dominating factor.
2.2 Influence of vibration on machining results
Vibration is a significant problem in turning operations that impacts the machining process, specifically the tool wear (Zeng et al., 2012). Vibration is the term used to describe a system's oscillations per unit of time. In machining, vibration is induced due to a lack of stiffness amidst the cutting tool, the workpiece material, the tool holder, and the machine tool. Three different mechanical vibrations - free, forced, and self-excited vibrations are present during the turning process. However, vibration in the cutting tool during machining causes excessive tool wear, which leads to tool breakage and produces a rough surface finish. Because of this, the manufacturing industry aims to decrease the vibration in order to provide high-quality machined surfaces and minimize tool wear to achieve productivity (Devillez and Dudzinski, 2007). Vibration intensity can be measured by taking into account a variety of vibration criteria. The amplitude of the vibration is one of the measures for quantifying the vibration signal. Prasad and Babu (2017) measured vibration in terms of displacement during the turning of AISI 4140 steel to develop a predictive model for investigating the relationship between tool wear and vibration displacement. El-wardany et al. (1996) studied vibration signal features during cast iron machining using a high-speed steel drill bit. From their study, it is evident that kurtosis values in the frequency domain and time domain analysis are effective for monitoring the drill bit breakage.
In the prediction modeling for stress on the cutting tool and chip tool interface temperature, Arrazola et al. (2013) identified that displacement, one of the measures for the vibration signal, appeared as a significant factor. Additional machining factors may have an impact on displacement amplitude during turning. Ding and He (2011) developed a model for the prediction of tool wear using time and frequency domain signals. Simon and Deivanathan (2019) used the K-Star classifier to detect tool wear using vibration signals and statistical features in the drilling operation. Using vibration and force signal data, Bagga et al. (2021) employed ANN for the prediction of tool wear. Herwan et al. (2019) presented a feasible method to predict tool flank wear with the help of pattern classification of ANN using vibration signal analysis.
2.3 Optimization of input parameters and the research gap
The productivity of the machining parameters is greatly influenced by the input parameters (cutting speed, feed rate, and depth of cut) (Anand et al., 2019). Appropriate settings of the input parameters reduce the chance of material waste and additional setup change required for finishing operation (Tönshoff et al., 2000). Hence, the productivity of the machining process is improved by the determination of the optimum cutting parameter level concerning the response parameters (Labidi et al., 2018). To determine the optimum cutting parameter Labidi et al. (2018) used an Artificial Neural Network (ANN) and the desirability function (DF) in their research to simultaneously minimize Ra, cutting tool flank wear, and tangential force during the hard-turning of X210Cr12 (56 HRC) steel using a coated ceramic tool. Zerti et al. (2019) used RSM and an ANN to model the responses in the turning operation of hardened steel (59 HRC), where mixed-coated ceramic was used as a cutting tool with respect to input parameters. Meddour et al. (2018) utilized the non-dominated sorting genetic algorithm (NSGA-II) integrated with an ANN in the prediction and modeling of responses (Ra, cutting force). Their study showed that the prediction of optimal parameter values using NSGA-II was more reliable than the DF approach. Şahinoğlu and RaFigurehi (2020) studied the effects of varying hardness (10, 15, and 20 HRC) and input parameters on the responses in dry hard-turning using RSM. Their study identified feed rate as the most significant input parameter in hard-turning.
Sharma et al. (2021) compared the Taguchi-Grey approach, teaching learning-based optimization (TLBO) and a grey regression for MOO of stainless steel 316L alloy under dry cutting conditions, where grey theory showed better performance. Abbas et al. (2022) utilized a multi-objective emperor penguin colony algorithm (MOEPCA), multi-objective Pareto search algorithm (MOPSA) and multi-objective genetic algorithm (MOGA) in the MOO of Ra and productivity during the hard-turning of AISI 4340 steel.
Several studies have been carried out in recent years to optimize the multiple responses of steel machining with the presence of cutting fluids and cryogenically treated cutting tools. Mia and Dhar (2017) predicted the optimum cutting conditions using the Taguchi L36 experimental design for machining hardened steel using a high-pressure coolant system (HPC). Priyadarshini et al. (2020) applied a fuzzy TOPSIS-based Taguchi method for MOO during the turning of mild steel. Nas and Altan Özbek (2020) utilized Taguchi-based GRA to reduce the Ra and tool wear with the application of uncoated carbide tools in the hard-turning of hot work tool steel. Singh et al. (2022) employed the fuzzy TOPSIS method to identify the optimum machining input parameters in the machining of EN-31 steel under both dry-cutting conditions and minimum quantity lubrication (MQL) conditions.
The Taguchi method determines the optimum levels for the input-cutting parameters while minimizing the effects of uncontrollable factors. The Taguchi orthogonal array was previously implemented to design a machining experiment and investigate the statistical significance of the input parameters on the responses in various machining setups. Asiltürk and Akkuş (2011) used a Taguchi L9 orthogonal array to design an experiment for machining hardened AISI 4140 steel in order to reduce the Ra (Ra and Rz). Based on their study, the feed rate, as a process parameter, significantly impacted Ra. Utilizing Taguchi signal-to-noise ratio (S/N ratio) analyses, Günay and Yücel (2013) identified the optimum cutting parameters in turning white cast iron using ceramic and cubic boron nitride (CBN) tools. To simultaneously optimize the Ra and material removal rate in the machining of X20Cr13 stainless steel (hardness of 180 HB) with a coated carbide tool, Bouzid et al. (2014) used a Taguchi L16 orthogonal array to design the experiment. Asiltürk et al. (2016) developed a prediction model using the Taguchi technique and RSM in machining a Co28Cr6Mo medical alloy. Yadav (2017) employed a Taguchi-RSM hybrid approach to model and optimized the Ra during duplex turning of AISI 1040 steel with a high-speed steel cutting tool. Using Taguchi L36 experimental design, Mia and Dhar (2017) predicted the optimum cutting conditions for turning hardened steel under a high-pressure coolant system (HPC). Tlhabadira et al. (2019) employed the Taguchi design to minimize Ra in the milling operation of AISI P20. The Taguchi L18 orthogonal array was implemented by Panda et al. (2020) to optimize the response parameters by employing the PSO method, RSM and genetic algorithm to turn hardened D3 steel under dry conditions. In MQL-assisted face milling of AISI O2 steel, Kursuncu and Biyik (2021) optimized Ra and cutting force using GRA and the Taguchi technique. Shagwira et al. (2022) applied a Taguchi L9 orthogonal array to design an experiment and optimize the responses in the machining of polypropylene with 80 wt. % quarry dust composite. Moreover, to optimize the Ra in the turning of EN8 steel, Gurugubelli et al. (2022) implemented a Taguchi L9 orthogonal array.
Apart from the implementation of parametric optimization of machining parameters during metal cutting, fuzzy TOPSIS was effective in various areas such as multi-response optimization of blended polymer composites (Şimşek and Uygunoğlu, 2016), optimization of drilling parameters for Al2O3 particles and sisal fiber-reinforced epoxy composites (Kamaraj et al., 2018), optimization of the input parameters such as pulse on time, duty cycle, discharge current, etc. in the electron discharge machining process (Roy and Dutta, 2019) and optimization of the machining parameters of metal matrix composites (Al–SiC-fly ash) (Tamiloli et al., 2019).
The literature review suggests that no previous study has attempted the simultaneous optimization of the responses like cutting power consumption, resultant cutting force, Ra and material removal rate, in relation to input process parameters (cutting speed, feed rate and depth of cut) in turning hardened steels using fuzzy TOPSIS based Taguchi Signal to noise ratio optimization technique, while considering the effect of vibration on tool wear. The review of the existing literature also revealed a lack of research on the correlation between average flank tool wear and vibration peak amplitude with respect to cutting parameters in dry hard-turning using ceramic tools. This is a conspicuous research gap that this study aims to address. In addition, this study also attempts to investigate the statistical relationship between the three-dimensional vibration signal peak amplitude with average flank wear and the impact of cutting parameters on the vibration signals with statistical analysis, which has not yet been explored with the MOO of the input process parameters either.
3. Experimental procedures and methodology
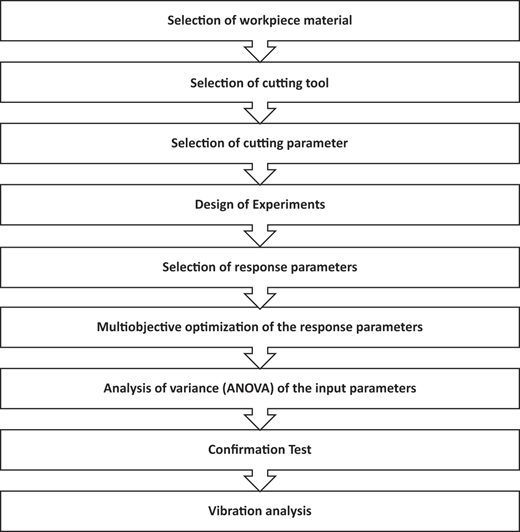
In this section, various stages of the experiment have been presented in a step-by-step manner. Each stage of the experimentation has been described in the following subsections. The flowchart of the experimental procedure has been shown in Figure 1.
3.1 Selection of workpiece material
In this study, a medium-carbon steel shaft with a 310 mm length and 63 mm diameter was used as the workpiece material to perform hard-turning operation due to the excellent mechanical and thermal properties of hardened steels that increases the demand for hardened steels in manufacturing industries (Mia and Dhar, 2017). The shaft underwent sequential heat treatment to improve its mechanical properties and hardness. To improve the hardness of the work material, bulk hardening was performed by heating the shaft at 823 °C in an electric furnace. After the bulk hardening process was completed, tempering was carried out to reduce the work material's brittleness and increase its toughness. The workpiece material had an average hardness of 58.5 HRC after finishing the heat treatment cycle. The chemical composition of the hardened shaft is presented in Table 1.
3.2 Selection of the cutting tool
Ceramic tools exhibit less tendency to adhere to metals because of their high abrasion resistance and hot hardness during machining, which reduces the chance of formation of the built up edge along with less deformation at elevated temperatures. Hence, the ceramic tool has been chosen in this research as the cutting tool (Mir and Wani, 2017; Sahu and Andhare, 2017). Table 2 provides information about the cutting tool specifications.
3.3 Selection of cutting parameters
According to the literature findings, feed rate, cutting speed and depth of cut have been acknowledged as important input parameters for the optimization of hardened steel machining (Chinchanikar and Choudhury, 2013). Therefore, in this research work, feed rate, cutting speed and depth of cut were taken into consideration as input process parameters, and the values of each process parameter were established based on the recommendation of tool manufacturers and manufacturing industry standards. The level of each cutting parameter is represented in Table 3.
3.4 Design of experiments
The design of the experiment was carried out using the Taguchi L9 (3 × 3) orthogonal array, with three levels for each of the input parameters (Vc, f and ap) since the Taguchi L9 array provides robust design solutions with improved quality in minimum cost (Pundir et al., 2018). The Minitab18 statistical software was used to perform the Taguchi design, where Taguchi L9 orthogonal array provides nine experimental runs for the three cutting parameters. Table 4 presents the Taguchi L9 experimental design for this study.
Experimental results with the design of experiments
| Run | Input parameters | Response parameters | |||||
|---|---|---|---|---|---|---|---|
| Vc (m/min) | f (mm/rev) | ap (mm) | Surface roughness (μm) | Cutting force (N) | Cutting power consumption (W) | Material removal rate (mm3/min) | |
| 1 | 98 | 0.1 | 0.2 | 0.51 | 220 | 21,266 | 1,960 |
| 2 | 98 | 0.12 | 0.3 | 0.77 | 42 | 3,430 | 3,528 |
| 3 | 98 | 0.14 | 0.4 | 0.575 | 177 | 16,660 | 5,428 |
| 4 | 129.5 | 0.14 | 0.2 | 0.563 | 49 | 5050.5 | 3,626 |
| 5 | 129.5 | 0.1 | 0.3 | 0.4105 | 81 | 10,101 | 3,885 |
| 6 | 129.5 | 0.12 | 0.4 | 0.4525 | 173 | 22144.5 | 6,216 |
| 7 | 161 | 0.12 | 0.2 | 0.441 | 128 | 20,447 | 3,864 |
| 8 | 161 | 0.14 | 0.3 | 0.4915 | 200 | 31,717 | 6,762 |
| 9 | 161 | 0.1 | 0.4 | 0.301 | 205 | 32,683 | 6,440 |
3.5 Selection of response parameters
From the literature review, no studies have been found based on the simultaneous responses during the machining of hardened steels using a ceramic tool on a computer numerical control (CNC) lathe machine. Hence, the responses that were taken into account in this research work included resultant cutting force (F), Ra, cutting power consumption (P) and material removal rate (MRR). In hardened steel machining, Ra is one of the significant quality features that needs to be kept to a minimum since it influences the microstructure and morphology of the machined surface, and the optimum surface finish reduces the manufacturing cost by eliminating the grinding process (Mia and Dhar, 2017; Panda et al., 2016). Resultant cutting force, which was computed from the following Equation (1) and employed in this study for statistical analysis, is equivalently a decisive response parameter in hardened steel machining since it influences machine vibration, tool wear and power consumption (Muaz and Choudhury, 2019).
where, Fx, Fy and Fz are the feed force, transverse force and axial force components, respectively. P and MRR are the other two machining responses that indicate the efficiency of machining taken into consideration for the MOO of hardened steel machining. The calculation of P and MRR was calculated by using the following formula (Bouzid et al., 2014).
where Fz is the axial force components and Vc is the cutting velocity (m/min)
where the cutting speed is indicated by Vc (m/min), the feed rate is represented by f (mm/rev) and the depth of cut for turning operations is expressed by ap (mm).
3.6 Selection of measuring instruments
A Kistler dynamometer (Type 9129AA) with a piezoelectric force sensor, a charge amplifier (Type 5015A) and a sampling frequency of 1,000 Hz were utilized in the data acquisition of the three-dimensional cutting forces. The dynamometer was clamped with the compound rest of the machine, shown in Figure 2. Taylor Hobson Surtronic S-128, a portable Ra tester, was utilized to measure the machined Ra. A three-axis accelerometer (ADXL 345) with a sampling rate of 3,200 Hz was placed on the tool holder, presented in Figure 2, to investigate the effects of machine vibration on the cutting tool during each experimental run of this hard-turning study. The acceleration data recorded by the accelerometer were collected using an Arduino Uno with a clock speed of 16 MHz. The average flank wear was observed using a Scan Electron Microscope (SEM) (Hitachi VP-SEM SU1510) with a magnification of 70×.
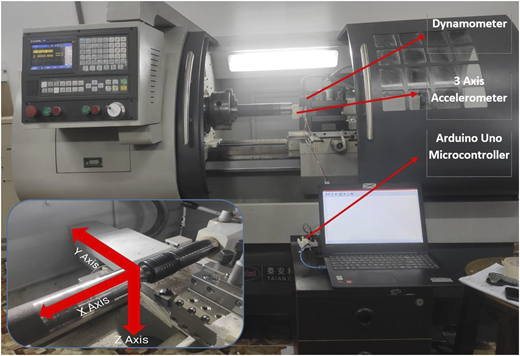
Experimental setup showing accelerometer and dynamometer attachment on CNC lathe machine
Experimental setup showing accelerometer and dynamometer attachment on CNC lathe machine
3.7 Experimentation
The hard-turning operation was performed on CNC lathe machine (CK6136A-2) with a power of 4 KW, shown in Figure 2. After completion of each experimental run with a run length of 20 mm on the workpiece, the three-dimensional cutting force and vibration signal was recorded. Each experimental run was performed with a new cutting-edge tool and the data of cutting force and vibration were recorded for further analysis. Average flank wear was visualized by using the microscope after the completion of each experimental run. With a sampling length of 4 mm for five sampling lengths, Ra was measured in the direction of the feed rate.
3.8 Fuzzy TOPSIS method
To determine the optimum cutting parameter settings in the MOO of the dry hard-turning process of steels, the fuzzy TOPSIS method has been utilized since it enables us to convert multiple responses to a single response that is further considered in the finding of the optimal solution. Moreover, this method allows the incorporation of the decision-makers or experts' opinions, while deciding the individual weights of the selected performance characteristics during simultaneous optimization (Bari et al., 2022; Pawanr et al., 2021).
The fuzzy TOPSIS method is used to evaluate multiple factors or alternatives concerning the given evaluation criteria, using data in numerical and linguistic forms. The steps of fuzzy TOPSIS (Bari et al., 2022) used in this study are discussed below.
Step 1: Equation (1) is used to create a decision matrix that comprises the performance ratings of each alternative for each criterion, with the rows representing the criteria and the columns representing the alternatives.
; ; presents the performance rating of the th alternative concerning th criterion,
Where represents the weight of the th criterion,
Step 2: The fuzzy weights for each criterion are determined through the geometric mean approach. Fuzzy weights are determined utilizing fuzzy addition and fuzzy multiplication shown in Equations (5)–(6)
Comparative fuzzy value of criterion to criterion .
is the geometric mean of the fuzzy comparison value of criterion to each of the other criteria.
is the fuzzy weight of the th criterion. It is indicated by a triangular fuzzy number.
Step 3: Equations (4)–(6) are used to create a normalized fuzzy decision matrix.
where;
where;
Step 4: Equation (7) presents the weighted normalized fuzzy decision matrix . Equation (8) is used to create the matrix by multiplying the values in the normalized fuzzy decision matrix by the importance weights of the evaluation criteria.
Step 5: Equations (10)–(11) are used to identify the fuzzy positive ideal solution (FPIS) and fuzzy negative ideal solution (FNIS) from the weighted normalized fuzzy decisions.
where and ,
Step 6: Equations (11)–(12) is used to calculate the distance between each alternative for the fuzzy positive ideal solution and fuzzy negative ideal solution, respectively.
where represents the distance between two fuzzy numbers.
Step 7: Equation (14) transforms the multi-response into a single response, allowing for the determination of the ideal solution from all alternatives , based on the relative closeness coefficient.
4. Analysis and results
4.1 Multi-objective optimization
In this research work, each experimental run was considered as an alternative, and the responses of this study were considered as criteria in the development of the fuzzy decision matrix and normalized fuzzy decision matrix, where the linguistic scores were assigned to each alternative considering all criteria (Roy and Dutta, 2019). Figure 3 shows the steps of the proposed research.
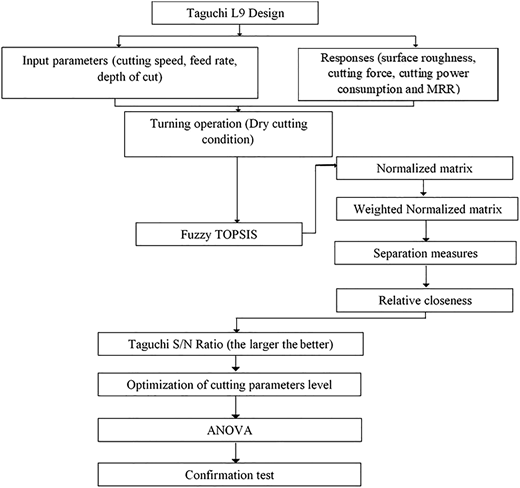
Experts in machining assigned a weight to each attribute in relation to a linguistic term. After that, the fuzzy weights of the criteria are determined utilizing Equations (5)–(6) as shown in Table 5.
Fuzzy weights for the response parameters
| Output parameters | Fuzzy weights |
|---|---|
| Surface roughness (μm) | (0.32,0.51,0.77) |
| Resultant cutting force (N) | (0.08,0.13,0.21) |
| Cutting power consumption (W) | (0.05,0.07,0.123) |
| Material removal rate (mm3/min) | (0.19,0.29,0.46) |
Table 6 shows the weighted normalized fuzzy decision matrix, which was determined utilizing Equations (8)–(9), after being performed normalization on each of the alternatives with the help of Equation (7). The FPIS for the responses of this hard study was calculated considering (0,0,0) for the Ra, F, P and (1,1,1) for the MRR. On the other hand, FNIS is calculated using (1,1,1) for Ra, F, P and (0,0,0) for MRR.
The alternative experiments are fuzzy weights and fuzzy decision matrix
| Alternatives | Ra (μm) | F (N) | P (W) | MRR (mm3/min) |
|---|---|---|---|---|
| 1 | (0.240,0.459,0.770) | (0.060,0.120,0.210) | (0.020,0.040,0.080) | (0.000,0.029,0.115) |
| 2 | (0.000,0.051,0.192) | (0.000,0.010,0.050) | (0.000,0.010,0.030) | (0.030,0.087,0.207) |
| 3 | (0.112,0.255,0.500) | (0.040,0.090,0.180) | (0.010,0.020,0.055) | (0.100,0.203,0.391) |
| 4 | (0.112,0.255,0.500) | (0.000,0.010,0.050) | (0.000,0.010,0.030) | (0.030,0.087,0.207) |
| 5 | (0.000,0.051,0.192) | (0.000,0.010,0.050) | (0.000,0.010,0.030) | (0.030,0.087,0.207) |
| 6 | (0.048,0.153,0.346) | (0.040,0.090,0.180) | (0.020,0.040,0.080) | (0.140,0.261,0.460) |
| 7 | (0.048,0.153,0.346) | (0.030,0.070,0.140) | (0.030,0.050,0.104) | (0.030,0.087,0.207) |
| 8 | (0.048,0.153,0.346) | (0.060,0.120,0.210) | (0.040,0.060,0.123) | (0.140,0.261,0.460) |
| 9 | (0.000,0.051,0.192) | (0.060,0.120,0.210) | (0.000,0.010,0.030) | (0.140,0.261,0.460) |
The separation measure of each alternative was determined using Equations (10)–(13) and, where FPIS was considered (0,0,0) for Ra, F, P and (1,1,1) for MRR, on the other hand, the value of MRR was taken as (1,1,1) and (0,0,0) for Ra, F and P for the FNIS calculation. After the determination of the separation measure using Equations (12)–(13), the closeness coefficient of each alternative was calculated using Equation (14), taking into consideration the separation measure of each alternative, and these calculations are presented in Table 7. Higher values of the closeness coefficient indicate higher rank.
di+, di−, CCi and S/N ratio values
| Alternatives | di+ | di− | CCi | S/N ratio |
|---|---|---|---|---|
| 1 | 1.683472167 | 2.45260842 | 0.592978877 | −4.54037 |
| 2 | 1.059995688 | 3.019038472 | 0.740135619 | −2.61419 |
| 3 | 1.259894528 | 2.859617626 | 0.694164143 | −3.17156 |
| 4 | 1.275712232 | 2.825317093 | 0.688928771 | −2.61419 |
| 5 | 1.059995688 | 3.019038472 | 0.740135619 | −2.74664 |
| 6 | 1.114374938 | 2.996482687 | 0.728919111 | −3.23688 |
| 7 | 1.273321704 | 2.822282156 | 0.689100375 | −2.43071 |
| 8 | 1.170271774 | 2.942423166 | 0.715448923 | −3.23436 |
| 9 | 1.000345848 | 3.099372444 | 0.755996442 | −2.90902 |
Afterward, the closeness coefficient shown in Table 7, which integrates all of the responses into a single response, was used in Taguchi S/N ratio calculation as a unique response to find the optimum cutting parameter setting for the hard-turning process. Minitab18, the statistical analysis software, was utilized to determine the S/N ratios and further used for ANOVA analysis. Table 7 presents the S/N ratios for the corresponding values at each level of machining parameters, where the ‘larger the better’ quality characteristic has been utilized. The S/N ratios have been calculated using Equation (17).
where n = Number of repetitions each experimental run.
= Measured value of the th experiment for each experimental run.
= Mean of the responses for each experimental run = .
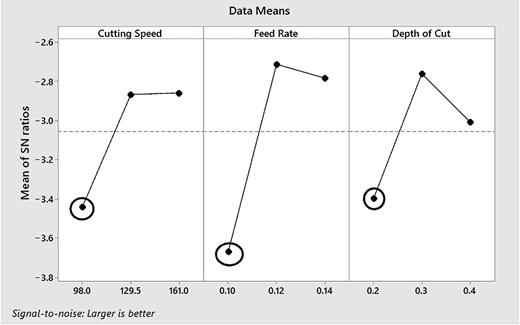
Finally, the main effect plot of the S/N ratio for the of the integrated responses is shown in Figure 4, which describes the changes in values against the three different levels of each factor.
4.2 Analysis of variance (ANOVA)
The effect of input-cutting parameters on the responses of the MOO has been investigated using an ANOVA analysis based on the closeness coefficient derived from the fuzzy TOPSIS approach. The statistical significance of the test is determined by the F-value in an ANOVA, which measures the variance in sample means relative to the variation within the samples (Das et al., 2016). The ANOVA of the closeness coefficient for the MOO as presented in Table 8 reveals that feed rate is the most dominant parameter for this MOO as the F ratio of 9.82 which is higher than Vc and ap. Additionally, the contributions of the cutting parameters have been observed, with f having the highest contribution (53.79%), followed by Vc (21.15%), and ap having the lowest contribution (5.49%).
ANOVA for CCi values of responses
| Source | Degree of freedom | Sum of squares | Adjusted sum of squares | Contribution (%) | F ratio |
|---|---|---|---|---|---|
| Cutting speed, Vc | 2 | 0.6723 | 0.33614 | 21.15 | 3.86 |
| Feed rate, f | 2 | 1.7109 | 0.85545 | 53.79 | 9.82 |
| Depth of cut, ap | 2 | 0.6212 | 0.31062 | 5.49 | 3.57 |
| Residual error | 2 | 0.1742 | 0.31062 | ||
| Total | 8 | 3.1786 |
According to the quality characteristic “larger the better,” the optimum cutting condition has been determined as a Vc of 98 m/min, f of 0.10 mm/rev, and ap of 0.2 mm, shown in Figure 4, to simultaneously minimize Ra, F and P while maximizing MRR.
4.3 Confirmation test
In the machining of hardened steels, the optimum cutting condition is always desirable to enhance productivity (Mia and Dhar, 2017). A confirmation test has been performed to ascertain the validity of the predicted optimal cutting parameter settings. The optimal S/N ratio for the optimization of the responses has been determined by using Equation (18) (Günay and Yücel, 2013).
where is the calculated optimum S/N ratio at the input parameters' optimum labels (dB), is the average of all input parameters S/N ratio (dB), are the average S/N ratio of the input parameters at the optimum label, respectively.
The predicted S/N ratio for the optimal setting was found to be −4.193 using Equation (18), whereas the experimental S/N ratio was −4.973. Since the error margin is within the confidence interval value of ±3.77 in the confirmation test, which was carried out using Equation (19-20), the optimal parameter settings for the MOO of the hard-turning process are thereby validated (Günay and Yücel, 2013).
here,
N = total number of experiments = 9
= error variance = 0.1742
= total degree of freedom associated with the estimate of mean = 6
In the second phase of this research, vibration signal analysis on the tool wear of ceramic tools was examined to investigate the impact of the designed level of input cutting parameters used in the study of MOO on the vibration signal feature so that the process parameters can be controlled efficiently to reduce tool wear.
4.4 Vibration analysis
In this study, the individual effects of the three axes' vibrations on the tool wear of ceramic tools were examined since chipping occurs when even the slightest vibration takes place during machining with ceramic tools (Aslantas et al., 2012). To investigate the relationship between the vibration signals and the wear of ceramic tools, fast Fourier transform (FFT) has been utilized in this research work as FFT has become more effective than time domain analysis for examining the significant frequency components and their respective amplitudes of each direction vibration signals (Dimla, 2002; Jáuregui et al., 2018). The FFT analysis has been performed using OriginPro 2021 software for the nine experimental runs and presented in Figures 5–7, respectively, to show the vibration peak components of each axis. Figures 5–7 illustrate the change of X, Y and Z direction vibration frequency where the frequency domain of the Fuzzy decision matrix and signals have been plotted in half of the sampling frequency (6,400 Hz), respectively in relation to amplitude for the nine distinct experimental runs.
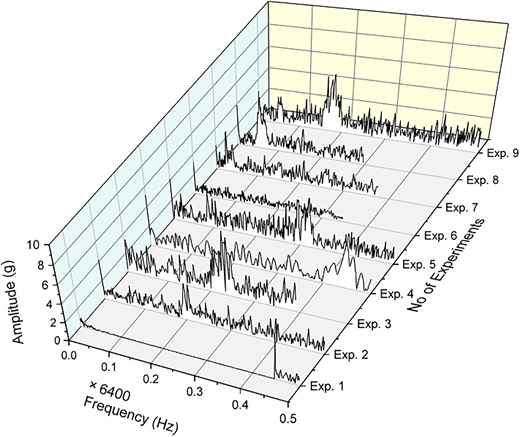
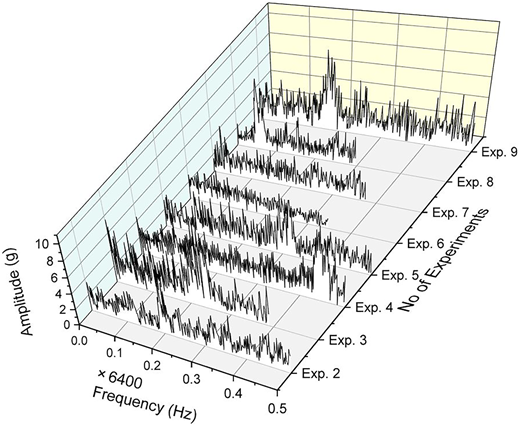
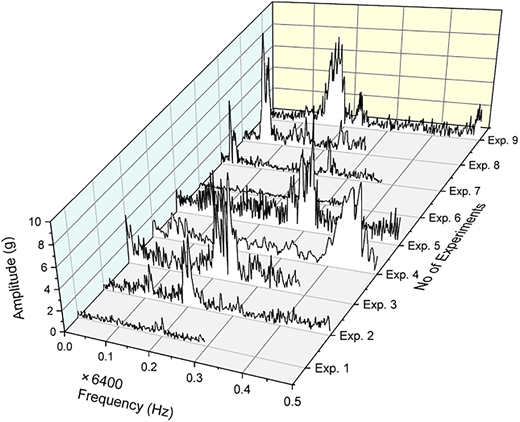
Since vibration has an impact on the premature failure of ceramic tools, the correlation between each of the axis peak amplitude of the vibration data for the nine experimental runs has been investigated using the Spearman correlation coefficient (Aslantas et al., 2012). For data that are not normally distributed, the Spearman correlation coefficient is more useful than the Pearson correlation coefficient (Abidi et al., 2018). Figure 8 presents the correlation between each axis's peak frequency and corresponding average flank wear. In Figure 8 the terms r value and CI stand for “correlation coefficient” and “confidence interval” of the population data correlation, respectively. Table 9 represents the X, Y and Z-direction peak amplitude for the significant frequency components.
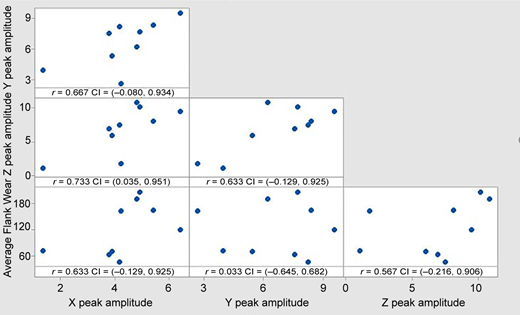
Matrix plot of X peak amplitude, Y peak amplitude, Z peak amplitude, and average flank wear for 95% confidence interval of the Spearman correlation
Matrix plot of X peak amplitude, Y peak amplitude, Z peak amplitude, and average flank wear for 95% confidence interval of the Spearman correlation
X, Y and Z-direction vibration peak amplitude and average flank wear
| Alternatives | X-direction vibration peak amplitude (g) | Y-direction vibration peak amplitude (g) | Z-direction vibration peak amplitude (g) | Average flank wear (μm) |
|---|---|---|---|---|
| 1 | 4.2368 | 2.67510 | 1.7755 | 164.06 |
| 2 | 3.7866 | 7.59000 | 6.9818 | 62.50 |
| 3 | 6.4280 | 9.58326 | 9.5393 | 120.00 |
| 4 | 4.1818 | 8.25814 | 7.5566 | 45.00 |
| 5 | 4.8149 | 6.23864 | 10.8770 | 192.00 |
| 6 | 3.9001 | 5.41569 | 6.0561 | 68.75 |
| 7 | 1.3595 | 3.97671 | 1.0538 | 70.31 |
| 8 | 4.9223 | 7.71516 | 10.1900 | 207.81 |
| 9 | 5.4304 | 8.41000 | 8.1473 | 165.63 |
4.5 Tool wear analysis
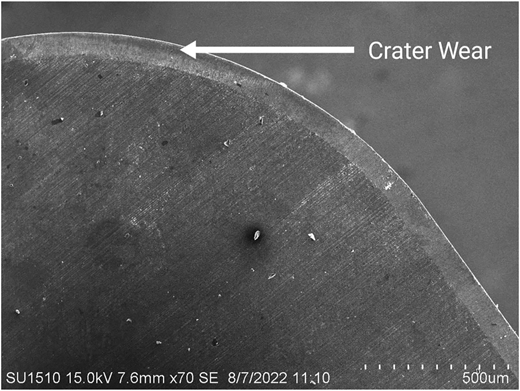
Figures 9 and 10 represents the wear condition of the ceramic tool after the completion of experiment No. 1 (Vc: 98 m/min, f: 0.10 mm/rev, ap: 0.20 mm). The tool wear condition appeared to be chipping at the principal cutting edge and crater wear was found at the rake surface based on the SEM image of the worn ceramic insert. The presence of crater wear on the tool rake surface, shown in Figure 9 was primarily caused by higher temperature generation at the chip-tool interaction and chemical affinity between the chip and tool materials (Kumar et al., 2006). Table 9 presents the average flank wear value for the nine experiments.
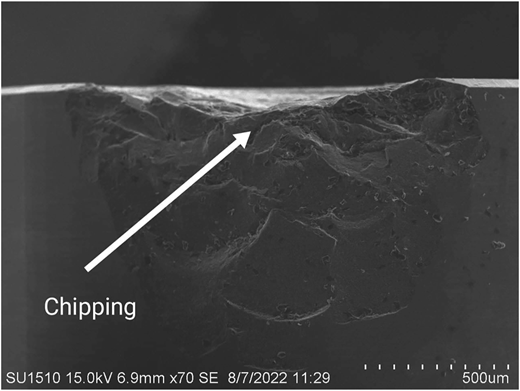
The correlation between average flank wear and X, Y and Z-direction vibration peak amplitude shown in Table 10 indicates that the average flank wear in the three-direction vibrations peak amplitude has a positive correlation coefficient indicating tool wear increases along with the increase of vibration where X direction has a correlation coefficient value of 0.633 which is greater than the two other axes 0.033 for Y, and 0.567 for the Z direction, X direction vibration becomes significant in terms of contributing to ceramic tool wear. From Figure 10, it is observed that the chipping was the leading reason to cause wear on the flank surface of the cutting tool. According to the positive correlation coefficient values, vibration is one of the factors that contributed to chipping on the flank surface. The frictional force between the cutting tool and the workpiece that develops due to increasing tool wear is what causes the excessive vibration (Prasad and Babu, 2017). Additionally, the correlation coefficient between cutting force and average flank wear is positive, with a value of 0.617, showing that as tool wear increases, more cutting force is required. This is due to the fact that worn tool increases the magnitude of friction in machining (Mamalis et al., 2008). As the average flank wear increases, the friction between the cutting tool and the workpiece comes into action, thus requiring more cutting force. This additional cutting force created the resonant frequency and caused an increase in the magnitude of the vibration. Hence this phenomenon causes resonant vibration, which makes the tool more susceptible to exposure to vibration in all directions and leads to premature tool failure (Dureja et al., 2009; Prasad and Babu, 2017). Owing to the fact that the X-direction vibration has become significant causing tool wear to the ceramic tools, the effects of cutting parameters on the X-direction vibration need to be studied to have better control over the hard-turning process. The ANOVA analysis for the S/N ratios of the X-direction peak amplitude shown in Table 11 reveals the contribution of individual cutting parameters, the feed rate (f) has the highest contribution of 34.74% followed by cutting speed (Vc) of 12.44% and depth of cut (ap) of 6.72%.
ANOVA table for S/N ratios of X-direction peak amplitude
| Source | Degree of freedom | Sum of squares | Adjusted sum of squares | Contribution (%) | F ratio |
|---|---|---|---|---|---|
| Cutting speed, Vc | 2 | 14.720 | 7.360 | 12.44 | 0.27 |
| Feed rate, f | 2 | 41.105 | 20.552 | 34.74 | 0.75 |
| Depth of cut, ap | 2 | 7.949 | 3.975 | 6.72 | 0.15 |
| Residual error | 2 | 54.522 | 27.261 | ||
| Total | 8 | 118.296 |
Therefore, f has a significant impact on causing the X-direction vibration (Lim, 1995). Furthermore, the main effect plot for S/N ratios of X direction peak amplitude as shown in Figure 11 describes the effect of change in cutting parameter values with respect to S/N ratios for peak amplitude of X direction. Additionally, Figure 11 shows the drastic increase of S/N ratios for X-direction peak amplitude with the change of feed rate (f), which eventually represents that feed rate is the significant contributor to X-direction vibration. Taguchi's the smaller the better quality characteristic has been utilized to optimize the X-direction peak vibration amplitude in terms of cutting parameters because a lower vibration amplitude value is desired for longer tool life (Ghorbani et al., 2018).
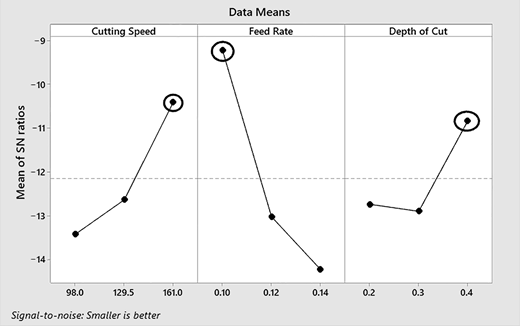
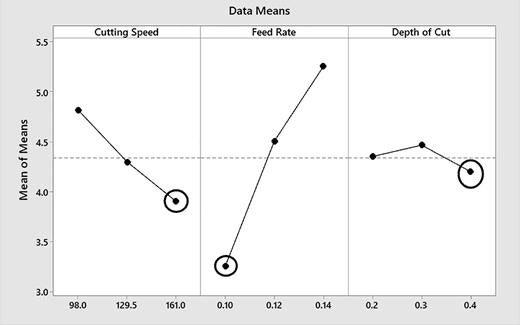
Based on the smaller the better quality characteristic for minimum vibration amplitude, the optimized cutting condition is determined from the S/N ratios of X direction peak; 161 m/min for Vc, 0.1 mm/rev for f and 0.4 mm for ap, shown in Figure 11. Additionally, the optimal cutting condition, which is obtained from the mean response of X-direction peak amplitude as a Vc of 161 m/min, f of 0.10 mm/rev and ap of 0.4 mm, is analogous to the desired condition observed from S/N ratios analysis, shown in Figure 12.
5. Discussions
In this study, a fuzzy TOPSIS-based Taguchi method was utilized to determine the optimum cutting parameters level for machining hardened steel at dry conditions using the ceramic tool. The productivity of the machining process solely depends on controlling the response parameters, and it is quite challenging due to the interaction between the responses (Abbas et al., 2022). Since this study seeks to optimize the responses simultaneously, the optimal conditions obtained will facilitate the dry hard-turning of steels by minimizing Ra, cutting force and cutting power consumption while maximizing the material removal rate.
In the hard-turning of steel, the generation of excessive cutting forces leads to an increase in tool wear and cutting power consumption which eventually results in the poor surface finish of the machined workpiece. In such cases, additional processing like gridding might be required. This will require additional setup, which will incorporate additional cost and downtime to the process. This study's findings indicate that the optimum cutting parameter settings in the dry hard-turning operation are 98 m/min cutting speed, 0.10 mm/rev feed rate and 0.2 mm depth of cut, which keeps the responses at optimum level simultaneously (Priyadarshini et al., 2020). The predicted optimum cutting parameters settings have been validated with the confirmation test and the error margin for this setting is within the confidence interval. Therefore, the obtained optimum parameter setting from the fuzzy TOPSIS-based Taguchi method can optimize the responses of the dry hard-turning of steels. From Table 8, it has been revealed that feed rate is the most significant cutting parameter in the MOO of hardened steels, especially given that controlling the feed rate is crucial for manufacturing industries to achieve high product quality in dry hard-turning operations (Mia and Dhar, 2017).
To reduce the effect of vibration on the tool wear in the MOO of hardened steels, vibration signal analysis was initially carried out with FFT, and the correlation between the peak of the three directions and the input parameters was established using the spearman correlation coefficient. Table 10 shows that in the X direction, vibration has the most significant influence on the tool wear in the MOO of the hardened steel parameters and feed rate is the most influential input cutting parameter that is responsible for this phenomenon since it has the highest contribution in the generation of the peak vibration amplitudes (From Table 11). Therefore, manufacturing industries should place a greater emphasis on determining the feed rate for effective hard-turning in order to reduce the impact of vibration on tool wear in the dry hard-turning of steels (Ghorbani et al., 2018).
The findings of this research contrast significantly from those of other relevant studies that have investigated the optimization of cutting parameters in hardened steel machining. For instance, Nas and Altan Özbek (2020) evaluated the machining parameters in turning hardened hot work tool steel using cryogenically treated tools and found the optimum cutting parameters level using a deep cryogenically treated tool at a cutting speed of 250 m/min, feed rate of 0.09 mm/rev. Labidi et al. (2018) used RSM, ANN and DF for cutting conditions modeling and optimization in the MOO of hard-turning and found the optimum cutting speed of 80 m/min, and feed rate of 0.08 mm/rev. Kursuncu and Biyik (2021) evaluated the optimization of the cutting parameters of hardened AISI O2 steel under the MQL with Taguchi and GRA method and found optimum cutting parameters to be 100 m/min cutting speed, 100 mL/h MQL flow rate and 0.1 mm/tooth feed rate. In contrast to the aforementioned research, this study evaluated the optimum cutting parameters during the hard-turning of steels in a CNC machine under dry cutting conditions using the fuzzy TOPSIS-based Taguchi method and identified the optimum cutting parameters to be 98 m/min cutting speed, 0.10 mm/rev feed rate and 0.2 mm depth of cut. Additionally, the study found feed rate to be the most significant factor in the MOO considering the effect of vibration on tool wear. This study is unique in the sense that no previous research has focused on the simultaneous optimization of the responses in the machining of hardened steel using a ceramic tool in a CNC machine under dry cutting conditions implementing fuzzy TOPSIS-based Taguchi method, especially focusing on the tool wear mechanism under the effect of vibration.
6. Conclusions
In the current study, the simultaneous optimization of the responses – Ra, cutting force (F) and material removal rate (MRR) – has been performed with the fuzzy TOPSIS-based Taguchi method, along with reducing the vibration effect on ceramic tool wear. Statistical analysis was also carried out, where the significance of each cutting parameter was evaluated. The following key insights were derived from the proposed research.
According to the confirmation test (predicted S/N ratio −4.193, experimental S/N ratio −4.973), the proposed integrated fuzzy TOPSIS-based Taguchi MOO model for hard-turning is valid.
The optimum level of parameters for minimizing Ra, F and P along with the maximization of MRR is 98 m/min cutting speed (Vc), 0.10 mm/rev feed rate (f) and 0.2 mm depth of cut (ap).
Based on the results of the ANOVA analysis, the contribution of each cutting parameter to the MOO of Ra, F, P and MRR is as follows: f contributes the most (53.79%), followed by Vc (21.15%) and ap has the least significant effect (5.49%).
Based on the results of the Spearman correlation study, the average flank wear of the ceramic tool is positively correlated with the peak vibration amplitudes in the X, Y and Z directions. Amidst the three directions (X, Y and Z), the X-direction vibration peak amplitude was strongly correlated with the average flank wear with a maximum correlation coefficient of 0.633.
From the ANOVA analysis, the effects of cutting parameters on vibration peak amplitudes have been found. The significant vibration for causing average flank wear is strongly influenced by f (34.74%) and slightly influenced by Vc and ap, with a contribution of 12.44 and 6.72%, respectively.
With Taguchi S/N ratio analysis, minimum vibration peak amplitude was observed at a higher Vc of 161 m/min and ap of 0.4 mm, but at a lower f of 0.1 mm/rev. The main effect plot of S/N ratios for the vibration peak amplitude can be used by the manufacturing industries in selecting cutting parameter settings to reduce vibration, which eventually decreases tool wear.
6.1 Theoretical implications
This study has a variety of implications from a theoretical perspective. The study focuses on the simultaneous optimization of hardened steels along with monitoring the vibration on tool wear, which had not been previously investigated. The study combines fuzzy TOPSIS and Taguchi method to determine the optimum cutting conditions, which appear to be quite robust and consistent from the confirmation test. The subsequent vibration analysis reveals the effect of vibration on ceramic tool wear along with the wear mechanism of the ceramic tool in dry hard-turning, considering the effect of vibration and the optimum settings for the input parameters to reduce the impact of vibration. These insights can work as a guideline for future researchers who are performing studies to optimize machining parameters for various hard materials in the manufacturing sector.
6.2 Practical implications
The findings of this research offer several practical applications to the manufacturing industry. The optimum process parameters obtained from this study will help the manufacturing industry to improve productivity by minimizing Ra, cutting force and cutting power consumption while maximizing the material removal rate. The ANOVA results of this study will help the machine operators to identify the significant input parameters in the dry hard-turning of steel. The confirmation test of this study indicates the justification of the application of the proposed fuzzy TOPSIS-based Taguchi method in the implementation of the simultaneous optimization of the responses for machining operations. Hence, managers from manufacturing industries can also use the proposed model to predict the optimum cutting conditions for other difficult-to-cut materials. The study also indicates that feed rate is the most significant input parameter to reduce the effect of vibration in the machining of hardened steel, followed by cutting speed and depth of cut. Hence, to minimize the effect of vibration in dry hard-turning of steels, keeping the value of feed rate at a minimum level would be an optimum choice.
6.3 Limitations and future research directions
Like all studies, this study also has some limitations that future researchers can try to overcome. For example, since optimizing the machining parameters in response to a higher number of output performance criteria will provide better control over the machining process, several output variables, such as the cutting temperature and cutting tool nose radius, can be incorporated into future studies. To improve the modern tool condition monitoring system, additional sensors like acoustic emission with vibration sensors can be incorporated into future research. Moreover, to evaluate the performance of the fuzzy TOPSIS-based Taguchi method in determining optimum cutting parameters, a comparative study can be performed in the future with other MOO tools such as grey relational Taguchi analysis, DF and RSM.

