


Although 76% of the population of the United Arab Emirates (UAE) is Muslim, takāful (Islamic insurance) has a much smaller share of business in the UAE than conventional insurance does. The purpose of this study is to highlight the importance of brand equity (BE), which is known as the incremental value that provides reason to buy a brand. This study provides useful insights that can help the health takāful industry to gain a feasible market share in the UAE.
This is a quantitative study in which stratified random sampling was adopted for data collection from 300 respondents through a self-administered questionnaire from August to November 2018. Underpinning the study is the theory of planned behavior (TPB) and the structural equation modeling (SEM) technique has been used to examine the impact of BE on purchase intentions (PI) through the moderating role of demographic factors such as age, income, education and religion. Three dimensions of BE, i.e. brand awareness (BAW), brand association (BAS) and perceived quality (PQ), are evaluated in terms of their significance as dimensions of BE.
The major findings of this study confirm that BE has a strong positive influence on the PIs of health takāful customers in the UAE and that all three dimensions of BE make significant contributions to the overall BE. The results show that education does moderate the relationship between BE and PI while age, income and religion do not. A new finding of this study is the nonsignificant moderating role of religion, whereby it was found that takāful products in the UAE are not limited to Muslim customers but can include potential customers who are followers of other religions.
To the best of our knowledge, the present study is the first of its kind to examine the impact of BE on the PI of health takāful customers in the UAE. The findings of the study give academia, researchers and marketers a better understanding of the importance of BE and of its vital role in promoting takāful products in the Gulf Cooperation Council (GCC) countries such as the UAE.
Introduction
Takāful (Islamic insurance) is the Islamic alternative to conventional insurance, being in line with the principles of Sharīʾah (Islamic law). Takāful is based on the principles of solidarity, brotherhood and mutual assistance (Billah, 1998). Takāful contract means that the rules of interest and uncertainty that apply to exchange contracts do not apply to it Ayub (2007).
Between 2011 and 2018, the global takāful industry witnessed compound average growth of 8.5%, having reached US$27.07bn in 2018 (IFSB, 2020). This growth was mainly contributed by the Gulf Cooperation Council (GCC) region, with an average contribution of 43.2% in the global takāful industry. Among GCC nations, Bahrain and Oman demonstrated double-digit year-on-year business growth of 22% and 13%, respectively, while the UAE could not manage to achieve the threshold of 10% in 2018 (IFSB, 2020).
It is important to note that the UAE is among the pioneers of the global takāful industry as the second takāful company in the world, Islamic Arab Insurance Company (SALAMA), was established in Dubai in 1979 (Mughal, 2007). However, even 40 years after its inception, the takāful industry has not managed to achieve a feasible market share in the UAE. This is despite the unveiling by His Highness Sheikh Mohammad Bin Rashid Al Maktoum − Vice-President and Prime Minister of the UAE and Ruler of Dubai − in 2013 of his vision of making Dubai the hub of the Islamic economy (GIFR, 2016).
As of July 2020, the UAE had 62 insurance companies, of which 50 were conventional health insurance companies, while 12 were takāful companies (EIA, 2019). According to Law No. 23 of 2005, health insurance is mandatory in Abu Dhabi for all residents (HAAD, 2010), and similarly, Law No. 11 of 2013 enforces compulsory health insurance for all residents of Dubai (DHA, 2014). Based on current market share of the takāful industry, it is estimated that 90% of the total population of Abu Dhabi and Dubai have insurance coverage through conventional health insurance plans, while the remaining 10% are covered by health takāful plans (IFSB, 2020).
In view of the low market share of the takāful business in the UAE, this study ensures its contribution by emphasizing the importance of BE and how it can help the takāful industry to gain a substantial market size in the UAE. According to Kotler and Armstrong (2004), BE is the distinctive impact of a brand that comes to a customer’s mind while interacting with the product or service of a brand. Past studies have shown that BE and its dimensions have a significant influence on the growth of the insurance industry and that they have been identified as being among the most important factors to be considered by insurance firms (Gunawardane et al., 2016; Eslami, 2020). According to Mahmood (2019), BE is one of the most significant assets of insurance firms and has fostered the growth of many insurance companies across the world.
A review of the relevant literature has revealed that previous studies have discussed the individual dimension of BE and suggested further research on other dimensions to know their significance (Tariq et al., 2017). Similarly, prior work on the insurance industry has recommended further research on the role of demographic factors on the PI of customers (Rizwan et al., 2016; Fatoki, 2020).
To bridge the gap in previous studies, this study contributes in the following ways. First, it has combined BE and its three dimensions (BAW, BAS and PQ) in a single study. Second, four important elements of demography (age, income, education and religion) are tested in terms of their moderating role between BE and PI. The element of religion is particularly included in this study, since studies on consumer behavior have stressed the importance of religious beliefs in the purchase of Sharīʿah-compliant financial products (Laraib, 2017). Third, this study has included the literature on BE’s application to the service industry since most of the prior studies have only applied BE concepts to the goods industry (Tariq et al., 2017).
This study adopts a systematic approach to address the issue of low market share of health takāful in the UAE. The potential factors are identified through an extensive literature review of relevant studies and then the structural equation modeling (SEM) approach of smart partial least squares (PLS) is used to test those factors. This study contributes to the literature by highlighting the importance of BE and its three dimensions.
Theoretical background and literature review
Underpinning theory
This study adopts the theory of planned behavior (TPB) as the underpinning theory due to its relevance to the topic. Past studies have concluded that the TPB is a comprehensive framework to conceptualize, test and empirically identify those factors that influence PI of customers (Ashraf et al., 2017; Lama, 2017). The TPB was developed by Icek Ajzen in 1985 and is an extension of the theory of reasoned action (TRA), which was jointly developed by Martin Fishbein and Icek Ajzen in 1967 (and further amended until 1975) (Ozer and Yilmaz, 2011; Fatoki, 2020).
The primary objective of the TPB is to provide a comprehensive framework for understanding the various factors that influence the intentions of individuals (Ajzen, 1991). Since the past three decades, the TPB has been successfully applied across many industries such as retail, health care, sports, finance and online shopping to predict consumer behavior (Arif, 2016; Ruangkanjanases et al., 2020). Past studies have found a significant impact of the TPB variables on the PI of customers (Tuan and Vinh, 2016; Lama, 2017; Fatoki, 2020).
According to Ajzen (1985), the TPB encapsulates that human intentions are primarily influenced by three factors: attitude, subjective norms and perceived behavioral control. Details of each factor are presented in the following sections.
Attitude
According to Ajzen (1985), attitude toward a behavior is seen as “the degree to which a person has favorable or unfavorable evaluation of the behavior in question” (p. 12). Attitude is a behavioral belief of an individual, which includes a perceived positive or negative consequence of performing a certain behavior. For example, an individual might think what the outcome of his decision will be and, based on his behavioral belief, he will decide whether to involve himself in a behavior or not (Ajzen, 1991). Attitude is an aspect of human beings that is linked to their minds and it provides them with a reason to form an intention or behavior (Arif, 2016; Nomi and Sabbir, 2020).
Subjective norms
According to the TPB, subjective norm is defined as “the perceived social pressure to perform or not to perform the behavior” by the individual (Ajzen, 1985, p. 12), and this pressure is primarily from the people who are important to the individuals and are considered by them in the decision-making process (Wang, 2014; Fatoki, 2020). For example, an individual might think of what others might expect from him or what others will think about him if he makes a certain decision. Subjective norm can also be defined as social pressure that an individual has from the people around him and this pressure guides him to perform or avoid a certain type of behavior (Tuan and Vinh, 2016; Nomi and Sabbir, 2020).
Perceived behavioral control
The TPB defines perceived behavioral control as “the perceived ease or difficulty of performing the behavior” (Ajzen, 1985, p. 34). For example, an individual might think of all possible sources (such as ability and affordability, etc.) which are required in a certain behavior. Perceived behavioral control is also known as the potential and the ability of an individual to perform a behavior independently (Ashraf et al., 2017). According to Ajzen (1991), perceived behavioral controls comprise two core elements, which are controllability and self-efficacy. Controllability refers to the availability of resources to perform a behavior while self-efficacy refers to the confidence of an individual to perform a behavior (Tuan and Vinh, 2016; Ruangkanjanases et al., 2020).
Through a review of literature, certain links are established between the TPB and this study. First, past studies have identified BE as having a significant influence on customer attitude (Lama, 2017) and according to the TPB, customers’ attitudes have a direct influence on their intentions (Arif, 2016; Fatoki, 2020). Second, this study includes age, income, education and religion as moderating variables, and according to the TPB, demographic factors are considered background factors that influence human intention. Considering the above evidence, this study has chosen the TPB as the underpinning theory to know the impact of BE on the PI of customers through the moderating role of demographic factors.
Brand equity
According to Aaker (1991, p. 15), “brand equity is a set of assets and liabilities linked to a brand” and BE can be analyzed through its dimensions, which include BAW, BAS, PQ, brand loyalty and other proprietary assets. Farquhar (1989, p. 27) defines BE as “an accumulative value or asset of a product or brand which combines customer’s positive emotions, opinion and intention to purchase a product” while Kotler and Pfoertsch (2007, p. 358) believe that “brand equity is the distinctive impact of a brand which comes to a customer’s mind while interacting with the product or service of a brand.”
Previous studies by Perera et al. (2019) and Dissabandara (2020) found that BE has a significant influence on the PI of customers. Similarly, Adam and Akber (2016) concluded that during the brand selection process, when a customer selects one brand over another, despite more features of alternate brands, then it is simply the result of BE. Therefore, BE should primarily be the focus of business firms and marketers to gain enhanced market share and profit.
According to Aaker (1991), BAW, BAS, PQ, brand loyalty and other proprietary assets are the five dimensions of BE. As a dimension, other propriety assets do not have a significant contribution to measure BE, therefore, this dimension has not been applied in various studies (Buil et al., 2013; Schmitz and Roman, 2018). Moreover, in this study, the dimension of brand loyalty is also not included because brand loyalty is often studied in the context of repetitive purchases only. Since, this study focuses on those dimensions that influence PI of customers, three dimensions of BE are included in this study, notably BAW, BAS and PQ. These dimensions are discussed later.
Brand awareness
BAW is an imagination of a brand in the mind of a customer and the ability of the customer to recognize and recall a brand in various situations (Keller, 1993; Aaker, 1994). BAW is the ability of a brand to get recognized by customers before they make PI (Civelek and Ertemelb, 2019).
Tariq et al. (2017) concluded that BAW is highly significant for BE since it has strong relationship with PI. Similarly, Akhtar et al. (2016) and Noorlitaria et al. (2020) found that BAW is closely linked with PI since it portrays important information related to a brand in a customer’s mind. Customers buy only those brands that they know, and they know only brands that they consider good.
Brand association
BAS is a combination of brand-related opinions, perceptions, ideas, past experiences, knowledge, concepts and approaches (Keller, 2009). It includes those experiences, beliefs, attitudes, perceptions, feelings, colors, images and thoughts that a customer affiliates with a brand (Kotler and Gertner, 2002). Dissabandara (2020) conducted a study on the impact of BAS on PI and found that BAS is closely related to the PI of customers because it provides them with favorable information, a positive attitude and reason to buy a product or service.
Studies have shown that BAS is a core constituent that has a strong impact on BE (Gordon et al., 2016; Ahsan et al., 2020). BAS is the most essential element of BE since it is something that resides in the minds of customers (Keller, 1993).
Perceived quality
According to Aaker (1994), PQ is the overall recognition in a customer’s mind about the features and benefits of a brand compared to its competitors. PQ is also defined as an intangible overall opinion about a brand and it shows the extent to which a brand can meet the needs, wants and expectations of the customers (Padhy and Sawlikar, 2018; Ahsan et al., 2020).
Earlier studies by Perera et al. (2019) and Dissabandara (2020) concluded that PQ is directly linked with PI and it influences PI in many ways. Therefore, PQ is an essential constituent of BE.
Demographic factors
Demographic factors are characteristics of the population, including age, gender, education, income, religion, ethnicity, social status, nationality, etc. These are very basic and are the easiest source to differentiate the various groups of a population (customers) with the aim of exploring their needs, wants and preferences (Kotler and Gertner, 2002). Demographic factors are simple indicators that are used in marketing and marketing-mix elements (product, price, place and promotion) because of their significant influence on marketing-related concepts (Keller, 2009).
Several studies have shown that demographic factors make core contributions to shaping customer PI. For example, Shrivastava and Singh (2017) conducted a study on the effect of demographic factors on the PI of life insurance. They concluded through their studies that demographic factors such as age, income and education play a critical role in the purchase of life insurance. Considering the findings of previous studies, four core elements of demographics are included, namely, age, income, education and religion. Details of each element are as follows.
Age
Age is a single-dimensional factor, measured from the time of birth and is often used by many researchers of contemporary social sciences to categorize people into different age groups (Rai, 2019). Being the primary factor of demographics, age has been commonly used in business research since it is a highly effective variable to divide the population into various groups. Age has also been identified as the best variable due to its primary contribution to dividing the market into different segments (Saad et al., 2013).
Income
Income is a monetary reward that can be in the form of profit, rent or earnings and provides the capacity to purchase a product or service (Saad et al., 2013). Income is an important variable of demographics that is closely associated with buying power and buying decisions of customers since buying power is derived from income and people buy what their income level allows them (Pratap, 2017). Shrivastava and Singh (2017) conducted a detailed study in India for life insurance products and found that PI of customers are positively related to income. In other words, people with high income are more likely to buy insurance products as opposed to customers with low income.
Education
Education is the process of acquiring knowledge, skills and attitudes, and the preferences of customers are linked with their level of education (Kumar and Kumar, 2019). Since education changes the way people perceive things, it influences customer intentions (Pratap, 2017).
Studies have shown that both general and religious education have influence on PI of customers. For example, Kumar (2014) and Shrivastava and Singh (2017) found in their studies that education has a highly positive influence on the PI of life insurance customers. The reason behind this is the priority that well-educated people give to their families; they want to protect them from unforeseen circumstances that are part and parcel of routine life. Similarly, Laraib (2017) concluded that religious education is linked with the likes and dislikes of customers, which are ultimately reflected in their PI. In this way, people having better knowledge of Islam can demonstrate stronger PI toward takāful products.
Religion
To some researchers, religion is a set of beliefs shared by groups of people, which are applied in routine life; however, this set of beliefs is linked to a reality that cannot be empirically tested. Other scholars take religion as a belief-based system that is created by God for His believers, its aim being to show people the way of life that they should adopt (Clarke and Byrne, 1993).
Being a global phenomenon, religion is a primary concern for many businesses. Therefore, religion-related information about a population is essential for effective market segmentation. Religiosity affects personality characteristics of people, which ultimately influence their PI (Laraib, 2017). Besides this, it is also observed that higher levels of religiosity will have a strong influence on PI, while lower levels of religiosity will have a comparatively weaker influence on the purchase intention of customers. Past studies have concluded that Muslim customers prefer Sharīʿah-compliant insurance products as they agree with the teachings of Islam and this is a source of spiritual satisfaction for them (Rehman and Shabbir, 2010; Nomi and Sabbir, 2020).
Purchase intentions
Plan and desire to purchase a product or service by the customer are known as purchase intention (Padhy and Sawlikar, 2018; Noorlitaria et al., 2020). PI also refers to the prediction of current and successive purchases by the customer. Based on this prediction, business firms forecast the buying behavior of their customers (Saad et al., 2013; Civelek and Ertemelb, 2019).
There are two main perspectives on PI, namely, from existing customers and from new customers. The PI of new customers reveal interest, choice and overall behavior of customers while the PI of existing customers anticipate customer trust, satisfaction and assurance of repetitive purchase in the future (Santoso and Cahyadi, 2014; Ruangkanjanases et al., 2020). Marketers are always eager to know factors that influence the PI of customers. By knowing these factors, they can direct their customers to a specific brand, which is the goal of all marketers (Tariq et al., 2017).
Conceptual framework and research hypotheses
Based on previous literature discussed above and consistent with the TPB, the conceptual framework of this study is depicted in Figure 1, followed by the research hypotheses.
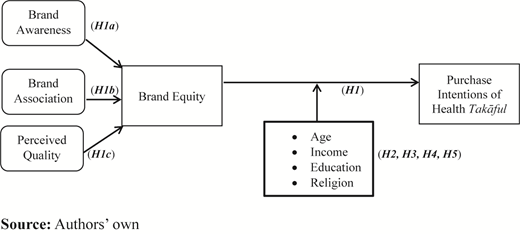
H1: BE of takāful has a significant relationship with the PI of health takāful customers in the UAE.
H1a: BAW is a significant dimension of BE in terms of health takāful buying in the UAE.
H1b: BAS is a significant dimension of BE in terms of health takāful buying in the UAE.
H1c: PQ is a significant dimension of BE in terms of health takāful buying in the UAE.
H2: age moderates the relation of BE with the PI of health takāful customers in the UAE.
H3: income moderates the relation of BE with the PI of health takāful customers in the UAE.
H4: education moderates the relation of BE with the PI of health takāful customers in the UAE.
H5: religion moderates the relation of BE with the PI of health takāful customers in the UAE.
Research methodology
Data analyses of this study are done through PLS using the SEM technique.
Population, sample and data collection
The target population of this study comprises the customers of health insurance in Abu Dhabi and Dubai who have sponsored their dependents through different health insurance plans. Based on geographical location, a stratified random sampling technique was adopted for data collection through self-administered questionnaires distributed by the researcher. Considering the average daily customer flow of health insurance companies, the respondents of the study were selected. There are two reasons for selecting the respondents of this study from Abu Dhabi and Dubai. First, Abu Dhabi and Dubai are the pioneer states of the UAE, where the law of mandatory health insurance was implemented in 2005 and 2014, respectively (Alpen Capital, 2016). Second, among the seven states of the UAE, these two states are the largest states, having almost 60% of the total population. Based on mid-year estimates of 2019, Abu Dhabi has an estimated total population of 3.2 million (GMI, 2019) while year-end estimates of 2018 show that Dubai has a total population of more than 3.2 million (DSC, 2019). It is important to note that the total population of both the states includes UAE citizens (commonly known as Emiratis) and the noncitizen residents (expatriates).
For the study, 435 questionnaires were distributed, of which 220 questionnaires were in Abu Dhabi and 215 questionnaires in Dubai between August and November 2018. Out of 435, 308 questionnaires were returned, yielding a response rate of 71%. All questionnaires were screened for validity, and final 300 questionnaires were used for data analysis, of which 156 (52%) questionnaires were from Abu Dhabi and 144 (48%) questionnaires were from Dubai.
Measurement of scales
To test the measurement scales of the study, a pilot test of the questionnaire was conducted. According to Saunders et al. (2009) a sample size of ten units is quite reasonable to assess a research instrument; therefore, ten respondents were selected for the pilot test of the questionnaire. The primary purpose of the pilot test was to ensure clarity of each item. After getting an initial feedback, minor changes were made to the questionnaire and the modified questionnaire was used for the main survey. The questionnaire consists of 25 questions (items) and is divided into two sections. Section one contains five questions on the demographic profile of the respondents, while section two contains 20 questions, in which each measurement scale has five questions. A total of four measurement scales were included in the study, namely, BAW, BAS, PQ and PI. All four scales are measured through five questions each on a five-point Likert scale, in which 1 = “strongly disagree,” 2 = “disagree,” 3 = “undecided,” 4 = “agree” and 5 = “strongly agree.”
Data analysis
For this study, data analysis was done in two stages. The first stage pertained to evaluate the measurement (outer) model, while the second stage pertained to evaluate the structural (inner) model of the study.
Second-order confirmatory factor analysis
In Smart PLS, dimensions of a construct are measured through second-order confirmatory factor analysis (CFA). Therefore, second-order CFA was run to evaluate the influence of BAW, BAS and PQ. Figure 2 shows the results of second-order CFA for the three dimensions of BE.
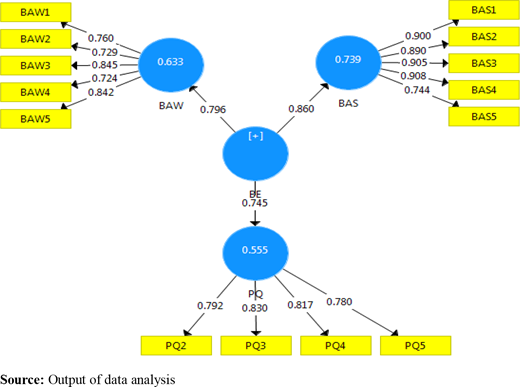
To measure the influence of each dimension on BE, four assessments were primarily made, which included an assessment of path coefficient (β), t-statistics value, p-value and R-square (R2). Cohen (1992) suggested a criterion for the significance of path coefficient; and mentioned that path coefficient values of 0.02, 0.15 and 0.35 are considered small, medium and large, respectively, while the acceptable values for t-statistics and p-test are greater than 1.96 and less than 0.05, respectively (Rifai and Hasan, 2016). According to Hair et al. (2014), in studies of consumer behavior, R2 value of 0.20 is considered high. Details of results derived through the second-order CFA are shown in Table 1.
Consolidated results of second-order CFA
| Relationship | (β) | t-statistics | p-value | R² |
|---|---|---|---|---|
| BAW to BE | 0.796 | 17.979 | 0.000 | 0.633 |
| BAS to BE | 0.860 | 23.267 | 0.000 | 0.739 |
| PQ to BE | 0.745 | 12.003 | 0.000 | 0.555 |
Notes:
BAW = brand awareness, BAS = brand association, BE = brand equity, PQ = perceived quality
The overall results of second-order CFA confirmed that all three dimensions of BE have important contributions to BE. Among the three dimensions of BE, BAS has the highest impact on BE followed by PQ and BAW.
Evaluation of the measurement model
Hair et al. (2012) proposed four basic assessments to evaluate the measurement model, including composite reliability, indicator reliability, convergent validity (average variance extracted) and discernment validity.
According to Urbah and Ahleman (2010), the value of composite reliability should be greater than 0.70 while the acceptable value of indicator reliability is 0.70 and above (Hair et al., 2014). In this study, one item (PQ1) of “perceived quality scale” showed a value of 0.481 and was removed since scholars have suggested the removal of items with factor loading of less than 0.50 (Ghozali and Latan, 2015). The commonly used method to measure convergent validity is the average variance extracted (AVE) with an AVE value greater than 0.50 (Hair et al., 2014) while the rule of thumb for discriminant validity is that the items of a scale should load strongly on the intended construct and weakly on unintended constructs (Gefen and Straub, 2005). Tables 2 and 3 show the results of all tests conducted to evaluate the measurement model of this study.
Combined results for validity and reliability of measurement model
| Latent variable | Indicator | Outer loading | Composite reliability | AVE |
|---|---|---|---|---|
| BAS | BAS1 | 0.900 | 0.940 | 0.760 |
| BAS2 | 0.890 | |||
| BAS3 | 0.905 | |||
| BAS4 | 0.909 | |||
| BAS5 | 0.745 | |||
| BAW | BAW1 | 0.760 | 0.886 | 0.610 |
| BAW2 | 0.728 | |||
| BAW3 | 0.845 | |||
| BAW4 | 0.725 | |||
| BAW5 | 0.842 | |||
| PI | PI1 | 0.881 | 0.951 | 0.797 |
| PI2 | 0.940 | |||
| PI3 | 0.922 | |||
| PQ | PI4 | 0.924 | 0.880 | 0.648 |
| PI5 | 0.788 | |||
| PQ2 | 0.792 | |||
| PQ3 | 0.830 | |||
| PQ4 | 0.817 | |||
| PQ5 | 0.780 |
Notes:
BAW = brand awareness, BAS = brand association, PI = purchase intentions, PQ = perceived quality
According to the evaluation criteria of Hair et al. (2012), the composite reliability, indicator reliability, convergent validity (AVE) and discriminant validity for the outer model have been tested. Results of tests show that all constructs of the measurement model were valid and reliable.
Evaluation of the structural model
After evaluating the measurement model, the next step is to evaluate the structural model, which is also known as the inner model. The main purpose for evaluating the inner model is to examine the relationship among latent variables of the structural model (Rifai and Hasan, 2016). The evaluation of the structural model includes three steps, which are collinearity assessment through VIF (variance inflation factor), R2 (coefficient of determination) and significance of path coefficient. According to the standard evaluation criteria, the value of VIF should be less than 5 (Hair et al., 2014) while path coefficient values of 0.02, 0.15 and 0.35 are considered small, medium and large (Cohen, 1992). Similarly, Urbah and Ahleman (2010) suggested that the R2 value below 0.25 is considered weak, above 0.25 is moderate and more than 0.50 is high.
The structural model of this study comprises one independent variable (BE) and one dependent variable (PI). According to the standard evaluation criteria, the value of VIF should be less than 5 (Hair et al., 2014). Analysis of Smart PLS shows that the value of VIF for the predictor construct (BE) was less than 5, which met the standard evaluation criteria for VIF value.
The second step for assessment of the structural model is the coefficient of determination (R2), which is commonly used to evaluate the structural model. R-square is calculated as the squared correlation between actual and predicted values of the endogenous variable, and it represents the combined effect of exogenous variables on the endogenous variable. According to Hair et al. (2014), in studies of consumer behavior, R2 value of 0.20 is considered high. The results show that the value of R2 for the endogenous variable (PI) was 0.370, which is significant according to standard evaluation criteria of Hair et al. (2014).
The next step is the assessment of relationships of the structural model, which is done through the bootstrapping method of the Smart PLS by examining the value of path coefficient, t-statistics and p-values (Hair et al., 2014). For this study, a total of eight relationships were tested: four direct relationships and four indirect relationships. Details of the evaluation of the path coefficient significance are shown in Table 4. All four direct relationships were significant while only one of the four indirect relationships was significant.
Path coefficient values of the structural model
| Path | Type | (β) | t-statistic | p-value | Remarks |
|---|---|---|---|---|---|
| BE → PI | Direct | 0.608 | 7.853 | 0.000 | Significant |
| BAW → BE | Direct | 0.796 | 17.979 | 0.000 | Significant |
| BAS → BE | Direct | 0.860 | 23.267 | 0.000 | Significant |
| PQ → BE | Direct | 0.745 | 12.003 | 0.000 | Significant |
| Age → BE | Moderating | 0.516 | 1.173 | 0.237 | Nonsignificant |
| Income → BE | Moderating | 0.523 | 0.812 | 0.412 | Nonsignificant |
| Education → BE | Moderating | 0.534 | 1.979 | 0.049 | Significant |
| Religion → BE | Moderating | 0.512 | 0.487 | 0.617 | Nonsignificant |
Notes:
BAW = brand awareness, BAS = brand association, BE = brand equity, PI = purchase intentions, PQ = perceived quality
Results and discussion
As shown in Table 5, most of the respondents of this study were male, since most of the dependents in the UAE were sponsored by males. Most were aged between 35 and 44 years and possessed degree qualifications. A total of 69% were Muslims, while most had monthly incomes between US$1,100 to US$3,000.
Demographic profile of respondents
| Variable | Description | Frequency | (%) |
|---|---|---|---|
| Gender | Male | 246 | 82 |
| Female | 54 | 18 | |
| Age | Between 25 and 34 years | 57 | 19 |
| Between 35 and 44 years | 147 | 49 | |
| Between 45 and 54 years | 96 | 32 | |
| Nationality | UAE nationals (citizens) | 69 | 23 |
| Expatriates (noncitizen residents) | 231 | 77 | |
| Education | College graduate | 63 | 21 |
| University graduate | 153 | 51 | |
| Postgraduate or equivalence | 84 | 28 | |
| Religion | Islam | 207 | 69 |
| Christianity | 54 | 18 | |
| Hinduism | 39 | 13 | |
| Income (monthly) | Between US$1,100 and US$3,000 | 129 | 43 |
| Between US$3,100 and US$5,000 | 111 | 37 | |
| More than US$5,000 | 60 | 20 |
This section of the study discusses the results of hypothesis testing, including four hypotheses of the direct relationship and four hypotheses of the indirect (moderating) relationship.
Results of analyses show that H1 is supported, which means that BE has a strong positive influence on PI of health takāful customers in the UAE. This finding is consistent with those of Samadi et al. (2017) and Dissabandara (2020). Similarly, H1a is also supported, which confirmed that BAW is a significant dimension of BE in terms of health takāful buying in the UAE. This result is supported by the findings of previous studies including Ekhveh and Darvishi (2015) and Noorlitaria et al. (2020). Next, the hypothesis (H1b) of this study is used to measure the significance of BAS as a dimension of BE. Through results of the second-order CFA, it is confirmed that H1b is accepted, and this result is supported by the earlier work of Santoso and Cahyadi (2014) and Ahsan et al. (2020). The fourth hypothesis (H1c) is that “perceived quality is a significant dimension of BE in terms of health takāful buying in the UAE.” Results of Smart PLS analysis confirmed that the fourth hypothesis is accepted and is consistent with the work of Severi and Ling (2013) and Dissabandara (2020).
Fifth is the hypothesis of the moderating role of age on BE and PI. Results of the analysis show that age is not a significant moderator for the above relationship, and this finding is consistent with those of previous studies by Saad et al. (2013) and Maina (2016). Next is the hypothesis of the moderating role of income in BE and PI. The analytical evidence reveals that income does not moderate the relation of BE with PI. This result is supported by findings of earlier studies including those of Oladele et al. (2016) and Maina (2016). For the seventh hypothesis, the moderating role of education is evaluated between BE and PI. The results show that education significantly moderates the relation of BE with PI, and this is consistent with the findings of previous studies such as that of Kumar (2014). The last hypothesis is the moderating role of religion in BE and PI. Through analysis, religion was found as a nonsignificant moderator of the above relationship, and this outcome is similar to the findings of past studies by Kusumawardhini et al. (2016) and Ashraf et al. (2017).
Conclusion
This study aims to highlight the significance of BE and how it can contribute toward the growth and expansion of the takāful industry in the UAE. For this purpose, a conceptual model was developed comprising potential variables identified through an extensive review of the literature related to this topic. Results of the analysis show that BE has a significant positive impact on PI of health takāful customers in the UAE. Similarly, BAW, BAS and PQ are found to be significant dimensions of BE in terms of health takāful buying in the UAE.
An analysis of the moderating variables revealed that education is a significant moderator while age, income and religion are nonsignificant moderators for the relationship of BE with the PI of health takāful customers in the UAE.
An interesting finding of this study is the nonsignificant moderating role of religion in the PI of health takāful customers in the UAE, despite the 69% Muslim samples. This shows that the scope of Sharīʿah-compliant insurance products is not limited to a certain community in the UAE and that potential customers can include followers of many religions.
Policy implications
This study contributes to the existing body of knowledge on the relationship between BE and PI of health takāful. The findings provide several important policy implications in different ways and which can be summarized as follows:
First, the results of the analysis confirmed that creating strong BE of takāful products and services can positively influence the PI of customers. Therefore, much focus is required by the marketers of takāful companies to build takāful as a brand. This finding stresses that the UAE takāful operators should suggest well-developed and competitive marketing strategies that can create awareness and promote takāful simultaneously among UAE residents.
Second, the analysis shows that religion is a nonsignificant moderator between BE and PI. This finding has paved the way for marketers to design and adopt standardized marketing strategies that can equally target customers of different religious backgrounds. In this way, the findings of this study have expanded the target market of takāful in the UAE.
Finally, this study has identified that education positively moderates the relation of BE and PI. Therefore, government bodies such as the Dubai Islamic Economy Development Centre (DIEDC) should focus on educational institutes across the UAE to create awareness about takāful since the DIEDC aims to make the UAE the hub of Islamic finance.
Recommendations for further research
This study recommends further research on the PI of corporate customers. The aim is to investigate factors that are primarily considered by corporate clients in their selection of products and services of insurance companies. With the information on potential factors influencing PI, takāful operators could expand their business to include corporate clients as they can generate substantial business volumes. Second, future research is recommended on the influence of marketing-mix elements (price, place, promotion and product) and service quality on the PI of takāful customers. This will identify other potential factors that can help takāful businesses to have a competitive advantage over conventional insurance operators.

