1-20 of 2355
Keywords: ORC turbine
Close
Follow your search
Access your saved searches in your account
Would you like to receive an alert when new items match your search?
Journal

Publishes fundamental and applied research in innovation practices as the official journal of the International Association of Innovation Professionals.
Journal Articles
Perceived overqualification and innovative work behavior among Vietnamese employees: the serial effects of perceived employment confidence and task crafting
Available to Purchase
International Journal of Innovation Science 1–27.
Published: 17 June 2026
Conceptual research framework Source(s): Author’s own work A conceptu...
Available to Purchase
in Perceived overqualification and innovative work behavior among Vietnamese employees: the serial effects of perceived employment confidence and task crafting
> International Journal of Innovation Science
Published: 17 June 2026
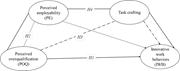
Figure 1. Conceptual research framework Source(s): Author’s own work A conceptual model links perceived overqualification to innovative work behaviours through perceived employability and task crafting. The conceptual model presents four factors, Perceived overqualification, Perceived emplo... More about this image found in Conceptual research framework Source(s): Author’s own work A conceptu...
Result of structural model testings Note: ***p < 0.0...
Available to Purchase
in Perceived overqualification and innovative work behavior among Vietnamese employees: the serial effects of perceived employment confidence and task crafting
> International Journal of Innovation Science
Published: 17 June 2026
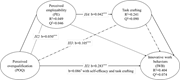
Figure 2. Result of structural model testings Note: ***p < 0.001, **p < 0.01, *p < 0 0.05 Source(s): Author’s own work A structural model presents relationships among perceived overqualification, perceived employability, task crafting, and innovative work behaviours with coefficients and model statistics. The structural model presents Perceived overqualification, Perceived employability, Task crafting, and Innovative work behaviours. Perceived overqualification points to Innovative work behaviours through H 1 with b equal to 0.283. Perceived overqualification points to Perceived employability through H 2 with b equal to 0.050. Perceived overqualification points to Task crafting through H 3 with b equal to 0.105. Perceived employability points to Task crafting through H 4 with b equal to 0.042. Perceived employability and Task crafting each point to Innovative work behaviours. Perceived employability has an R-squared equal to 0.049 and a Q-squared equal to 0.046. Task crafting has an R-squared equal to 0.241 and a Q-squared equal to 0.090. Innovative work behaviours has an R-squared equal to 0.404 and a Q-squared equal to 0.074. A note below H 1 states b equal to 0.086 with self-efficacy and task crafting. Asterisks appear beside coefficient values. More about this image found in Result of structural model testings Note: ***p < 0.0...
Journal Articles
Can ESG performance promote corporate green innovation in China? Micro evidence from innovation element-driven perspective
Available to Purchase
International Journal of Innovation Science 1–22.
Published: 16 June 2026
The theoretical framework of this article Source: Authors’ own work A...
Available to Purchase
in Can ESG performance promote corporate green innovation in China? Micro evidence from innovation element-driven perspective
> International Journal of Innovation Science
Published: 16 June 2026
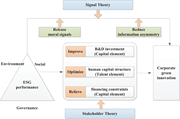
Figure 1. The theoretical framework of this article Source: Authors’ own work A conceptual framework presents E S G performance, signal theory, and stakeholder theory as links to corporate green innovation. The conceptual framework presents a flow diagram linking E S G performance to corpor... More about this image found in The theoretical framework of this article Source: Authors’ own work A...
Journal Articles
Employee empowerment as a follower-driven antecedent of transformational leadership: a conservation of resources perspective on innovative work behaviour
Available to Purchase
International Journal of Innovation Science 1–23.
Published: 15 June 2026
Conceptual framework of the study Source: Authors’ own work A flowcha...
Available to Purchase
in Employee empowerment as a follower-driven antecedent of transformational leadership: a conservation of resources perspective on innovative work behaviour
> International Journal of Innovation Science
Published: 15 June 2026
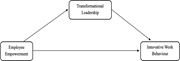
Figure 1. Conceptual framework of the study Source: Authors’ own work A flowchart shows employee empowerment influencing innovative work behaviour directly and through transformational leadership. More about this image found in Conceptual framework of the study Source: Authors’ own work A flowcha...
Standardised path diagram Source: Authors’ own work using SmartPLS 4.1 ...
Available to Purchase
in Employee empowerment as a follower-driven antecedent of transformational leadership: a conservation of resources perspective on innovative work behaviour
> International Journal of Innovation Science
Published: 15 June 2026
Figure 2. Standardised path diagram Source: Authors’ own work using SmartPLS 4.1 A structural model links E I and T L to I W B with construct loadings and path values. The central constructs are E I, T L, and I W B, with values 0.349 for I W B and 0.280 for T L. E I points to T L with 0.529... More about this image found in Standardised path diagram Source: Authors’ own work using SmartPLS 4.1 ...
Journal Articles
Antecedents and outcomes of industrial Internet of Things adoption for supply chain innovation
Available to Purchase
International Journal of Innovation Science 1–29.
Published: 11 June 2026
Research model Source: Authors’ own work A flowchart shows institutio...
Available to Purchase
in Antecedents and outcomes of industrial Internet of Things adoption for supply chain innovation
> International Journal of Innovation Science
Published: 11 June 2026
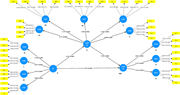
Figure 1. Research model Source: Authors’ own work A flowchart shows institutional pressures influencing industrial IoT and, in turn, industrial IoT influencing supply chain innovation. The coercive pressures, normative pressures, and mimetic pressures boxes connect to industrial I o T thro... More about this image found in Research model Source: Authors’ own work A flowchart shows institutio...
Research methodology adopted in this study Source: Authors’ own work ...
Available to Purchase
in Antecedents and outcomes of industrial Internet of Things adoption for supply chain innovation
> International Journal of Innovation Science
Published: 11 June 2026
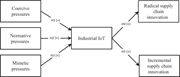
Figure 2. Research methodology adopted in this study Source: Authors’ own work A flowchart shows the three main stages of the methodology, including survey method development, data collection and data analysis. The process begins with data collection method development, where survey items a... More about this image found in Research methodology adopted in this study Source: Authors’ own work ...
Covariance-based structural equation modelling results Source: Authors’ ...
Available to Purchase
in Antecedents and outcomes of industrial Internet of Things adoption for supply chain innovation
> International Journal of Innovation Science
Published: 11 June 2026
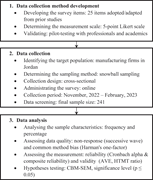
Figure 3. Covariance-based structural equation modelling results Source: Authors’ won work A path model shows the effects of institutional pressures on industrial IoT and the effect of industrial IoT on supply chain innovation. The model shows coercive pressures connecting to industrial I o... More about this image found in Covariance-based structural equation modelling results Source: Authors’ ...
Journal Articles
Beyond technology: how organizational competence shapes the durability of innovation in the digitalization of microfinance institutions
Available to Purchase
International Journal of Innovation Science 1–21.
Published: 28 May 2026
Screening process Source: Created by the authors The four-stage artic...
Available to Purchase
in Beyond technology: how organizational competence shapes the durability of innovation in the digitalization of microfinance institutions
> International Journal of Innovation Science
Published: 28 May 2026
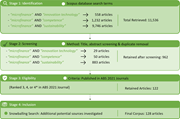
Figure 1. Screening process Source: Created by the authors The four-stage article selection process shows identification, screening, eligibility, and inclusion steps, reducing 11,536 articles to 128 articles. The flowchart presents a four-stage article selection process for a literature rev... More about this image found in Screening process Source: Created by the authors The four-stage artic...
Integrative framework Note(s): Governance capacity functions as the cond...
Available to Purchase
in Beyond technology: how organizational competence shapes the durability of innovation in the digitalization of microfinance institutions
> International Journal of Innovation Science
Published: 28 May 2026
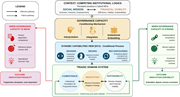
Figure 2. Integrative framework Note(s): Governance capacity functions as the conditioning mechanism that determines whether adaptive processes operate coherently; dynamic capabilities constitute the conditioned processes through which adaptation unfolds; and the triadic system of competence, i... More about this image found in Integrative framework Note(s): Governance capacity functions as the cond...
Practice and policy Source: Created by the authors Strategic phases f...
Available to Purchase
in Beyond technology: how organizational competence shapes the durability of innovation in the digitalization of microfinance institutions
> International Journal of Innovation Science
Published: 28 May 2026
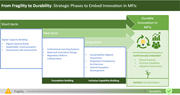
Figure 3. Practice and policy Source: Created by the authors Strategic phases framework shows short-term, mid-term, and long-term actions supporting durable innovation in M F Is. The framework titled From Fragility to Durability: Strategic Phases to Embed Innovation in M F Is presents a pro... More about this image found in Practice and policy Source: Created by the authors Strategic phases f...
Proposed conceptual framework Source: Authors’ own work An organisati...
Available to Purchase
in Green transformational leadership and employee green creativity: mediating and moderating mechanisms to support innovation
> International Journal of Innovation Science
Published: 22 May 2026
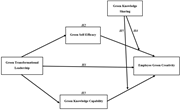
Figure 1. Proposed conceptual framework Source: Authors’ own work An organisational framework links Green Transformational Leadership with Employee Green Creativity through mediating and moderating variables. The conceptual framework illustrates relationships among Green Transformational Le... More about this image found in Proposed conceptual framework Source: Authors’ own work An organisati...
Interactive role of GSE and green knowledge sharing on employee green cre...
Available to Purchase
in Green transformational leadership and employee green creativity: mediating and moderating mechanisms to support innovation
> International Journal of Innovation Science
Published: 22 May 2026
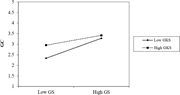
Figure 2. Interactive role of GSE and green knowledge sharing on employee green creativity Source: Authors’ own work A moderation interaction plot compares Green Creativity across low and high Green Sharing levels under different Green Knowledge Sharing conditions. The interaction plot di... More about this image found in Interactive role of GSE and green knowledge sharing on employee green cre...
Interactive role of GKC and green knowledge sharing on employee green cre...
Available to Purchase
in Green transformational leadership and employee green creativity: mediating and moderating mechanisms to support innovation
> International Journal of Innovation Science
Published: 22 May 2026
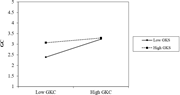
Figure 3. Interactive role of GKC and green knowledge sharing on employee green creativity Source: Authors’ own work An interaction plot compares Green Creativity across Green Knowledge Capability levels under low and high Green Knowledge Sharing conditions. The interaction plot presents ... More about this image found in Interactive role of GKC and green knowledge sharing on employee green cre...
