This article examines the relationship between the efficiency of National Innovation Systems (NIS) and occupational safety using a holistic approach. In this context, innovation extends beyond the simple introduction of advanced technologies to include their integration and institutionalisation within established social frameworks, thereby maximising their societal benefits.
Using a panel dataset of 25 European countries over the period 2010–2019, we employ a two-step methodology. First, we estimate NIS efficiency scores through parametric Stochastic Frontier Analysis (SFA). In the second step, we apply alternative panel empirical models for investigating the effect of NIS efficiency on fatal workplace accident rates, controlling for a range of socio-economic, production system and institutional factors.
Our findings indicate that more efficient National Innovation Systems (NIS) are correlated with lower fatal accident rates, thereby supporting the hypothesis that countries with more effective innovation systems are better suited to adopt and implement technologies and practices that enhance workplace safety.
The novelty of this analysis lies in the integration of empirical methods by which we incorporate the technological environment into the investigation of workplace accidents.
1. Introduction
In today’s rapidly evolving global landscape, the “grand challenges” of the 21st century – ranging from environmental and demographic pressures to health and well-being concerns – complicate the pursuit of sustainable and inclusive growth. Central to navigating these challenges is the role of innovation, particularly as economies undergo the profound transformations associated with the Fourth Industrial Revolution. Characterized by the convergence of digital, physical and biological systems, Industry 4.0 is reshaping production, organizational dynamics and labour processes (Hermann et al., 2016).
Within this context, National Innovation Systems (NIS) – networks of institutions that generate, diffuse and apply new technologies – have emerged as strategic instruments for fostering inclusive development (Edquist, 2010). Their effectiveness hinges on interactive learning among firms, universities and public institutions, enabling not only technological advancement but also improvements in public service provision and living standards (Lundvall, 1992).
Recent innovations in digital technologies, artificial intelligence, and smart systems have extended into the domain of Occupational Safety and Health (OSH), particularly in high-risk sectors such as manufacturing and healthcare (Carayon et al., 2015). These tools enhance monitoring, prevention, and risk mitigation, embedding OSH within broader innovation strategies (Reason, 1998). However, the organization of work is also changing, raising new safety challenges that go beyond technological deployment (Cockburn, 2021).
Ergonomics provides a useful lens for understanding these shifts, highlighting how suboptimal human–machine interfaces and workplace design can undermine both performance and safety (Velasco et al., 2022). Conversely, human-centred innovations have demonstrated potential in reducing injury risks, particularly musculoskeletal disorders (Robertson et al., 2013). Yet, workplace safety outcomes are not solely determined by technology. Cultural and institutional dimensions – such as safety leadership, participative decision-making and systems thinking – play a critical role (Martinidis et al., 2022). Moreover, Choudhry et al. (2007) point out that a strong safety culture, bolstered by supportive regulatory environments, motivates organizations to invest in state-of-the-art safety management systems. Thus, safety culture – shared values, beliefs and practices regarding safety – is widely recognized as a critical determinant of workplace safety (Zohar, 2002), further emphasizing that cultural innovations, such as enhanced employee involvement in safety decision-making, effective safety leadership and continuous learning, contribute significantly to the creation of safer work environments.
The integration of innovation into the broader welfare agenda has attracted considerable scholarly attention, as such systems play a crucial role in advancing technological progress that enhances public services, healthcare, education and overall quality of life (Edquist, 2010).
Despite growing interest in the intersection of technology and safety, the systemic relationship between NIS efficiency and OSH outcomes remains underexplored. Most studies emphasize discrete technologies or sectoral case studies, overlooking how national innovation capacity shapes broader safety dynamics (Lingard and Rowlinson, 2004). However, the intersection of national innovation systems and workplace safety – especially regarding national policies, the dissemination of safety-related technologies and collaborative efforts among the different stakeholders – constitutes a crucial yet underdeveloped area of research (Etzkowitz and Leydesdorff, 2000; Chaminade and Vang, 2008) This article addresses this gap by exploring the association between national-level NIS efficiency and the incidence of fatal workplace accidents.
Adopting a systemic perspective, we consider not only innovation outputs but also the socio-economic and institutional contexts that mediate their effects on workplace safety.
To ensure data reliability and cross-country comparability, we focus on fatal injuries, which – unlike non-fatal injuries – are considerably less susceptible to underreporting, particularly in environments with weaker regulatory enforcement (Boone and van Ours, 2006, Boone et al., 2011). While fatal accidents are typically well-documented, thereby minimizing the risk of measurement error, non-fatal accidents are not only more prone to underreporting but also amplify concerns related to data accuracy and cross-national consistency. Our analysis draws on a panel of 25 European countries over the period 2010 to 2019.
The empirical strategy unfolds in two steps. First, we estimate national innovation efficiency using Stochastic Frontier Analysis (SFA). Second, we assess its impact on standardized fatal accident rates through pooled OLS and random-effects panel regressions, controlling for key structural variables including GDP per capita, unemployment, education, sectoral composition, contract type and institutional quality.
Our findings reveal a robust, negative relationship between NIS efficiency and fatal accident rates, underscoring the broader societal value of systemic innovation capacity – not only in driving economic performance but also in fostering safer, more resilient labour environments (Chaminade and Vang, 2008).
2. Identification strategy and data
2.1 Conceptual framework
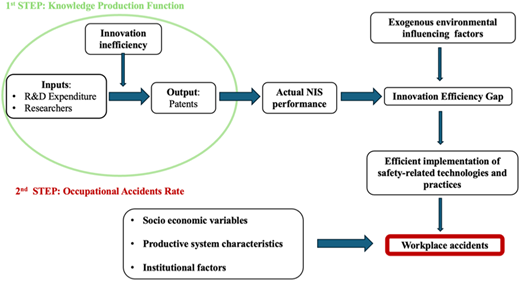
Our identification strategy relies on a two-step process. First, we estimate the efficiency scores of national innovation systems using a parametric SFA. In the second step, we utilize OLS and panel random-effects models, incorporating the estimated NIS efficiency scores as a key covariate to explain the fatal workplace accident rates in our panel while controlling for socio-economic productive system, and institutional characteristics.
The conceptual workflow of our approach is shown in Figure 1.
2.2 1st step: knowledge production function
To enhance innovation outcomes and generate economic and social benefits, it is crucial for countries to evaluate their national innovation systems (NIS) and identify key indicators that reflect the efficiency and effectiveness of innovation policies. However, assessing the performance of an NIS is inherently complex, as it depends not only on innovation inputs but also on institutional and environmental variables that act as both drivers and frictions in the innovation process (Furman et al., 2002), as well as on the overall efficiency of the system (Fu and Yang, 2009; Jankowska et al., 2017).
In this study, we adopt a SFA approach (Aigner et al., 1977; Meeusen and Van den Broeck, 1977; Kumbhakar and Lovell, 2000) to estimate the efficiency of national innovation systems by calculating their distance from a benchmark innovation frontier, summarized by an efficiency score. SFA is particularly suitable for evaluating production efficiency, as it enables statistical inference and allows the identification of exogenous variables that affect inefficiency.
Our analysis begins by specifying a deterministic production function:
where is the observed output for unit i at the time t, is a vector of inputs and is the vector of coefficient representing the strength and direction of the relationship between inputs and outputs.
The SFA framework assumes that units may not operate on the frontier due to inefficiency. This implies that the observed output is less than its potential:
where represents the level of efficiency for the productive unit i at time t. The optimal output achievable with the technology embodied in the production function (1) realizes when Conversely, when , the level of output is suboptimal, and the production process is characterized by a certain degree of inefficiency. Taking the natural log of both sides of Equation (2):
Posing , Equation (3) can be written as follows:
where represents a one-sided error term measuring the inefficiency of the unit i at time t and following exponential ∼Exp(λ) or half normal ∼+ distribution.
However, the production process can also be subject to random shocks, not correlated to the inefficiency of the productive unit. To account for this additional error term, Equation (3’) is reformulated as follows:
From Equation (4), when the actual level of output is below the potential level (. In this analytical backdrop, the measure of the degree of efficiency (efficiency score) is formalized by the ratio of the actual level of output (4) to optimal output (Y*) as follows:
Following the SFA, our first step of the empirical investigation aims to calculate the efficiency scores for NIS, and to explore the role of exogenous variables, interpreted as “environmental characteristics” potentially affecting innovation inefficiency [1]. Our dataset relies on World Bank and OECD data, spanning over a 10-year period (2010–2019).
On the inputs side, two alternative input configurations are considered: one employing a single input and the other grounding on three inputs, the overall aggregate of R&D expenditures or its decomposition considering three different sectors (business, high education, public).
In the first efficiency estimate, we use total R&D expenditures for the overall economy (GERD total) as the sole input. As Sharma et al. (2022) highlight, R&D constitutes a key investment in innovation by enhancing absorptive capacity and leveraging external knowledge and spillovers. However, Tavassoli and Carbonara (2014) contend that innovation depends on both the “intensity” and “variety” of processed knowledge. In line with this view, the second efficiency estimate incorporates three inputs: private sector R&D expenditures (GERD business), higher education institutions’ R&D expenditures (GERD high education) and public sector R&D expenditures (GERD public). To account for the important role of human capital for the production of knowledge (Buesa et al., 2010), we use the R&D personnel as an alternative input [2], expressed as full-time equivalent (FTE), where a person working half-time on R&D is counted as 0.5 person-years. As for R&D expenditure, firstly, we use total R&D personnel on national territory (Researchers total) as the sole input, and, secondly, we disentangle the role of the number of researchers to the NIS efficiency, considering separately private sector R&D personnel (Researchers business), higher education institutions' R&D personnel (Researchers high education) and public sector R&D personnel (Researchers public) [3].
On the output side, we employ a single measure for both estimates – the number of patents registered with the European Patent Office (Patents). A substantial body of literature considers patent counts a reliable proxy for innovative ideas (Buesa et al., 2010; Subramanian et al., 2016; D'Ambrosio et al., 2017; Li et al., 2021; Zhang et al., 2022), despite inherent limitations. First, patents are granted for inventions that are not necessarily transformed into market innovations (i.e. new products or production technologies). Second, because firms can appropriate the returns of successful R&D through alternative mechanisms – such as secrecy, first-mover advantages and complementary sales, services, manufacturing capabilities and know-how (Cohen et al., 2000; Buesa et al., 2010) – relying solely on patent counts might underestimate actual innovative output (Fritsch and Slavtchev, 2011). Nonetheless, patents remain an objective indicator, as their approval is determined by independent examiners, thereby validating their use as a measure of innovation (Mairesse and Mohnen, 2004; Buesa et al., 2010; Barra and Zotti, 2018). Moreover, despite these methodological considerations, patent counts continue to be the most comprehensive and reliable measure of technological output, with few viable alternatives available (Buesa et al., 2010).
As suggested by Fritsch and Slavtchev (2011), a time lag is required for R&D activities to culminate in patenting. Accordingly with Fischer and Varga (2003), we rely on a two-year time lag between innovation inputs and outputs to account for the time necessary to convert competencies into tangible innovations and, ultimately, patents.
Furthermore, we allow exogenous [4] control variables to influence the technical inefficiency term, under the assumption that variations in the economic environment may affect NIS inefficiency (Battese and Coelli, 1995). In particular, following Barra and Zotti (2018), to capture labour market effects, we include the unemployment rate (Unemployment), defined by the World Bank as « individuals without work, seeking work in a recent period and currently available for work, including those who have lost their jobs or voluntarily left work» [5]. Additionally, given that the propensity to patent varies across industries (OECD, 2015), we include employment in both the services (Employment services) and industrial sectors (Employment industry). Finally, we incorporate population density – defined as « midyear population divided by land area in square kilometres»[6] – since it influences the intensity of interactions and cooperation (Barra and Zotti, 2018), which are crucial for innovation activities (Feldman, 2000). Table 1 provides a complete description of the variables used in the model specification.
2.3 2nd step: occupational accident rate
The second step of our analysis investigates the role of NIS efficiency on workplace accidents. To this purpose, we use the efficiency scores, obtained in the first step, as a key covariate to explain variations in fatal workplace incident rates, while controlling for socio-economic, productive system characteristics and institutional features.
The empirical model is grounded on the following specification:
where the subscripts i and t represent, as before, the countries and the time, respectively. We first estimate an OLS pooled model with robust standard errors. Next, we conduct the Breusch-Pagan Lagrange Multiplier Test (1980), which suggests that the random effects estimation model is the most appropriate. Furthermore, the Hausman's test (1978) corroborates this result when considering the alternative fixed effects estimation model.
In Eq. (4), SFARit is the fatal accident rate, is the efficiency score, Xse is a vector of socio-economic variables, Zps is a vector of productive system characteristics and Vinst a vector of institutional variables. Finally, T represents years fixed effects and is a well-behaved error term distributed IID (0, σ2).
Occupational incidence rates differ across economic sectors because certain types of work expose employees to greater risks. Sectors such as agriculture, construction and transport are typically classified as high-risk. As a result, countries with a larger proportion of their workforce employed in these riskier sectors tend to report higher overall incidence rates, even when accident prevention efforts are comparable. To allow for meaningful cross-country comparisons, Eurostat accounts for national differences in industrial composition – particularly the prevalence of high-risk sectors [7] – by using a direct standardization method, applying sector-specific weights from the NACE classification to generate comparable rates across countries [8]. This approach yields what are known as “standardised incidence rates”. In this vein, our dependent variable, SFAR, measures the standardized rate of fatal accidents [9], based on Eurostat data. We focus on fatal accidents, which are less prone to underreporting than non-fatal injuries. Literature confirms that minor incidents are systematically underreported due to reputational risks or fear of dismissal (Boone and van Ours, 2006; Boone et al., 2011; Leombruni et al., 2019).
As our key independent variable, we use the efficiency score derived from the first-stage estimation. In line with prior literature (see Section 2), we assume that higher innovation system efficiency correlates with lower occupational accident rates. However, to mitigate potential issues of reverse causality and to account for the gradual evolution of innovation efficiency, we employ lagged efficiency scores. This approach aims to better isolate the structural relationship between innovation efficiency and fatal occupational accident rates, while minimizing simultaneity bias [10].
We further include control variables reflecting socio-economic, productive and institutional factors. Among the socio-economic covariates, we include GDP per capita [11], capturing national economic performance. Reflecting prior findings of a non-linear relationship with accident rates (Castaldo et al., 2024), GDP is entered in quadratic form. We also control for the unemployment rate (individuals aged 15–74) and Investments, measured as the change in gross fixed capital formation as a share of GDP. Economic downturns often reduce investment in occupational safety (Antonelli et al., 2024), despite its crucial role in reducing accident rates (Micheli et al., 2018). The Teredu variable reflects the share of workers with tertiary education (ISCED 5–8), in line with the skill-effect hypothesis (Parent-Thirion et al., 2012).
As for productive system characteristics, we consider SME (small and medium enterprises employing up to 250 persons), given their elevated accident risks (Micheli et al., 2018). We also include Temporary Employment (workers aged 15–64 with temporary contracts). While some evidence links temporary employment to higher injury rates – often attributed to insufficient training and experience (Benavides et al., 2006) – other studies point to underreporting of non-fatal accidents (Picchio and Van Ours, 2017) or suggest that injuries among temporary workers may be less severe (García-Serrano et al., 2010). While some evidence links temporary employment to higher injury rates – often attributed to insufficient training and experience (Benavides et al., 2006) – other studies point to underreporting of non-fatal accidents (Picchio and Van Ours, 2017) or suggest that injuries among temporary workers may be less severe (García-Serrano et al., 2010). The Part-time variable, capturing part-time workers as a share of total employment, reflects concerns that precarious work correlates with higher accident risk (Anyfantis and Boustras, 2020).
Finally, acknowledging the broader influence of institutions on various outcomes (Chowdhury et al., 2019), we hypothesize that it may also affect OSH levels. Accordingly, we incorporate institutional variables. Tax Evasion serves as a proxy for the effectiveness of government enforcement, including OSH regulations, consistent with evidence on the role of managerial and regulatory quality in enhancing workplace safety (Mohammadfam et al., 2017). To reflect the role of trade policy institutions, Protectionism is added, as trade barriers may indirectly shape OSH performance (Corden, 1997).
We also include Union Density, drawn from ILO data, measuring the trade union membership rate, and OSH-Culture, based on the OHS Barometer by EU-OSHA, which represents the share of respondents answering “Regularly” to the question: “How often is health and safety discussed between employee representatives and the management?” when the alternative answer was “Only when particular issues arise” and “Not at all”.
Table 2 provides a full list of variables, sources and units of measurement.
3. Descriptive statistics
This study is grounded on a panel composed by 25 European countries (Austria, Belgium, Bulgaria, Croatia, Czechia, Denmark, Estonia, Finland, France, Germany, Hungary, Ireland, Italy, Latvia, Lithuania, Luxembourg, Netherlands, Norway, Poland, Portugal, Romania, Slovakia, Slovenia, Spain, Sweden) over the 2010–2019 timespan.
The European Union is making substantial investments in research, development, and innovation (R&D&I), with a total expenditure of approximately 330 billion US dollars in 2023, placing it just behind the United States (around 650 billion) and China (around 550 billion).
This section presents the descriptive statistics of the variables used in both the first and second steps of our identification strategy.
3.1 Knowledge production function
Table 3 below provides the descriptive statistics (number of observations, mean, standard deviation, minimum and maximum values) for the input variables, the output variable and the efficiency score, calculated under the baseline assumption that the one-sided error term follows an exponential distribution. The average of GERD total expenditure of our sample over the period amounts to approximately 13 billion US dollars with a very high standard deviation of about 23 billion US dollars [12]. The standard deviation values indicate a significant level of heterogeneity across all inputs in our panel. This variability reflects the differing national economic structures and the varying degrees of public sector effort and financial support in the fields of education and research.
Table 4 e 5 provides a detailed analysis of the efficiency scores estimated using either a single input (GERD total or Researchers total) or three inputs (GERD business, GERD high education and GERD public or their corresponding R&D personnel counts). In Table 4 the overall period average values of the sample are provided. Table 5 shows the mean over the analysis period (2010–2019) and the countries' ranking with the rank indicating each country's position within the overall sample.
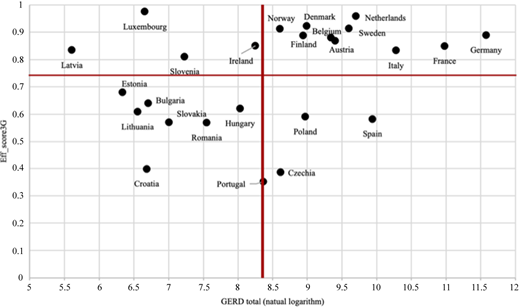
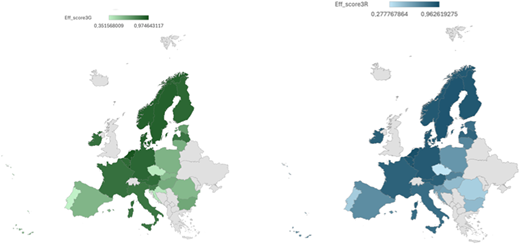
Table 5 categorizes countries based on efficiency scores from two input configurations: GERD expenditures (Eff_score1G&Eff_score3G) and R&D personnel (Eff_score1R&Eff_score3R). For Eff_score3G, countries are grouped into four performance tiers. Top performers (above the 75th percentile, 0.887) include Luxembourg, the Netherlands, Denmark, Sweden, Norway, Germany and Finland. Good performers (75th–50th percentile, 0.833) comprise Belgium, Austria, Ireland, France, Latvia and Italy. Poor performers (50th–25th percentile, 0.591) are Slovenia, Estonia, Bulgaria, Hungary, Lithuania and Poland, while the worst performers (below the 25th percentile) include Spain, Slovakia, Romania, Croatia, Czechia and Portugal. A similar pattern appears in Eff_score3R: Luxembourg, the Netherlands, Sweden, Belgium, Finland, Denmark and Norway lead; followed by Germany, Ireland, Austria, France, Latvia and Italy; with Estonia, Slovakia, Lithuania, Spain, Poland and Slovenia in the lower tier; and Croatia, Bulgaria, Hungary, Portugal, Romania and Czechia ranking lowest. Rankings remain broadly consistent when using single-input models (Eff_score1G and Eff_score1R). These stable classifications highlight persistent cross-country differences in innovation system efficiency, supporting further exploration of its impact on workplace accident rates. Figure 2 illustrates the positive relationship between total GERD and mean efficiency (Eff_score3G).
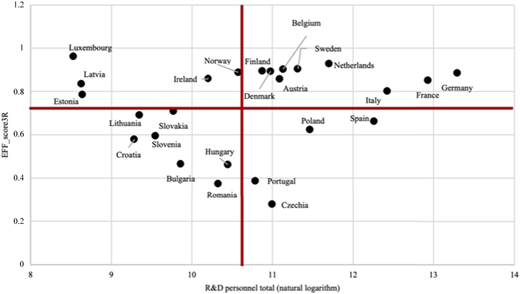
The relationship between R&D expenditure and NIS efficiency (Figure 2) shows that most countries with above-average R&D expenditure levels present higher-than-average efficiency in their innovation activities. However, for low R&D expenditure, the depiction is inverted. Moreover, when turning to R&D personnel (Figure 3), the overall overview in the relationship between efficiency scores and the input exhibits a similar scenario.
3.2 Occupational accident rate
Table 6 below shows the descriptive statistics (number of observations, mean, standard deviation, minimum and maximum values) for the dependent and independent variables (see section 2.3, Table 2). The dependent variable, SFAR, exhibits an average value (in the sample) over the period of 3.1 fatal accidents per 100,000 persons in employment. The standard deviation is around 1.6. In 2019, on the one hand, the following countries are listed among the first three for the highest fatal accident rates: France (4.39), Romania (3.91) and Bulgaria (3.64). On the other hand, listed as the first three countries with the best performance, we find: the Netherlands (0.65), Germany (0.83) and Sweden (0.89).
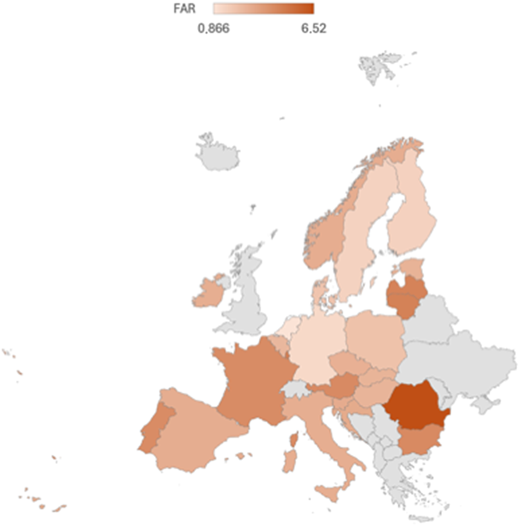
Figure 4 shows the spatial distribution of the dependent variable included in the analysis, considering the countries' average values over the period. In particular, higher values (>4.5) of the SFAR are observed in some eastern countries (Romania, Lithuania, and Latvia) and in Luxembourg. Differently, lower values (<1.6) are observed in northern Europe (the Netherlands, Sweden and Finland) and in Germany.
Figure 5 shows the geographical depict of the efficiency scores, computed with 3 inputs alternatively considering the expenditure or the researchers, with the scope of highlighting the possible visual correlations between our dependent variable and the key covariates.
4. Estimation results: baseline
This section presents the empirical analysis examining the relationship between the SFAR and the key independent variable (Efficiency score) derived from the National Innovation System (NIS), alongside a set of control covariates. Table 7 reports the estimation outcomes using GERD expenditures as the input measure, evaluated through two distinct econometric approaches. The first approach employs a pooled OLS regression, which treats all observations as independent and ignores unobserved heterogeneity across countries, assuming exogeneity of the regressors. Within this framework, Model 1 uses the efficiency score estimated from a single input, while Model 2 incorporates the efficiency score derived from three inputs. The second approach adopts a random effects (RE) panel data estimator to account for unobserved country-specific effects that may influence the dependent variable. Models 3 and 4 mirror Models 1 and 2 in their use of single and three-input efficiency scores, respectively, but include random effects to capture time-invariant heterogeneity.
Across all specifications in Table 7, coefficient signs remain stable, with only minor variations in magnitude. The key explanatory variable – the Efficiency score – consistently displays a negative and statistically significant coefficient. This robust association indicates that higher efficiency within national innovation systems (NIS) is correlated with lower rates of fatal workplace accidents.
The results suggest a significant association between innovation efficiency and improved occupational safety, potentially reflecting the role of advanced technologies, improved work organizations and a stronger culture of prevention. This evidence is consistent with the view that innovation extends beyond technological progress to include broader systemic changes in organizational practices and safety norms (Martinidis et al., 2022).
Turning to control variables, GDP per capita exhibits the expected non-linear relationship with fatal accident rates, with both the linear and squared terms significant. This U-shaped pattern aligns with prior literature linking economic development to workplace safety. Tertiary education (Teredu) also shows a significant negative effect, consistent with the skill-effect hypothesis: better-educated workers tend to operate in safer roles and adhere more strictly to safety protocols.
Among labour market variables, temporary employment is negatively and significantly associated with fatal accident incidence. This does not necessarily reflect better safety conditions for precarious workers but may result from their exclusion from more hazardous tasks. Conversely, variables such as SME share, part-time employment, tax evasion and union density do not attain significance in any model.
The investment variable is significant in all Models, supporting the idea that capital accumulation improves safety infrastructure. The protectionism variable is consistently negative, suggesting that more insulated economies may experience lower fatality rates, possibly due to less competitive pressure on firms or more protective labour environments. Moreover, both the pooled OLS and the random effects models yield a negative coefficient for the OSH-Culture variable across all four specifications – i.e. for both the one-input and three-input models – suggesting that higher levels of OSH culture, as captured by our proxy, are consistently associated with lower rates of fatal occupational accidents.
Robustness checks using R&D personnel instead of GERD as input (Table 8) confirm the validity of our findings. The efficiency score remains negative and significant, with an even slightly larger effect size. The direction and significance of other covariates are also preserved, reinforcing the conclusion that innovation efficiency – regardless of whether measured via financial or human capital inputs – has a robust correlation with occupational safety outcomes.
In summary, the empirical evidence strongly supports the hypothesis that higher NIS efficiency – whether measured through financial inputs or human capital – is associated with lower occupational fatal accident rates. This underscores the potential relevance of innovation systems not only for economic performance but also in relation to workplace safety and health outcomes. The findings suggest that strategies aimed at reducing occupational injuries may benefit from aligning technological innovation with organizational and cultural factors to support sustained improvements in OSH and overall productivity.
5. Robustness checks
To assess the reliability of the analysis, this section provides three alternative robustness checks: an alternative estimation model, a different assumption in the distribution of the error term in the SFA analysis and an alternative measurement of the dependent variable.
Firstly, we implement a panel mixed-effects model (Searle et al., 2001) to account for both within- and between-country variations. Fixed effects capture the overall, systematic influence of variables on workplace accidents, while random effects account for country-specific deviations from this general trend. This approach allows us to exploit the advantages of panel random effects models while incorporating fixed effects to control for unobserved time-invariant heterogeneity across countries, thus providing a more accurate and comprehensive analysis of the factors influencing workplace accidents. Table 9 presents the estimation outcomes.
As shown in Table 9, even when implementing the panel mixed effects model, the results obtained in our baseline estimates hold, maintaining both statistical significance and the magnitude of the coefficients.
Moreover, it is methodologically consistent to check for the robustness of the results also by switching from the SFA exponential () to the SFA half-normal ( ∼+ specification to ensure that the findings are not sensitive to the choice of the error distribution and remain consistent across different model assumptions. The following Table 10 shows the new estimation results that confirm that our results are robust.
Finally, in the second stage of our analysis, we consider an alternative dependent variable – the non-standardized incidence rate. Table 11 presents a comparison between the two measures of occupational accidents.
Since the non-standardized accidents rate does not account for the distribution of the occupational risk across industrial sectors within the national economy, we mitigate the threat of incurring in a omitting variable bias by incorporating an additional explanatory variable, Employment Risk, defined as the ratio of employees working in high-accident-risk sectors (i.e. mining and quarrying, construction, and transport, manufacturing) to the total number of persons employed in the economy (which includes sectors such as computer repair, personal and household goods, excluding financial and insurance activities) [13]. In these last estimates, we implement the SFA under both error term distribution assumptions. In Table 12, the estimates presented show that the results are not affected by the alternative measurement of the workplace accidents phenomenon.
6. Concluding remarks
In the current context of technological advancement, the relationship between innovation and work environments is driving profound transformations in production and business processes, organizational models and occupational safety standards. Within this framework, efficient National Innovation Systems play a pivotal role in shaping occupational safety and health by fostering technological advancements, regulatory frameworks, and best practices associated with improved workplace safety.
This study provides an integrative framework to empirically investigate the relationship between the efficiency of National Innovation Systems (NIS) and workplace safety, specifically focusing on fatal occupational incidents across 25 European countries over the period 2010–2019. Using a two-step identification strategy, we first estimate NIS efficiency scores through parametric Stochastic Frontier Analysis (SFA) and we then investigate the relationship between fatal accidence rate (SFAR) and efficiency – summarized by the efficiency score – as well as other selected covariates related to socio-economic factors, productive system characteristics and institutional variables using alternative econometric models (pooled OSL and panel random effects). In general, our findings indicate that countries with more efficient innovation systems tend to exhibit lower rates of fatal workplace incidents, consistent with the hypothesis that innovation system efficiency is associated with more favourable occupational safety outcomes.
We first adopt the SFA approach that allows us to explore the relationship between inputs (R&D expenditure and R&D personnel, both in total and disaggregated by public, private and higher education sectors) and output (patents), while accounting for potential inefficiencies in the knowledge production function. Our findings highlight that northern countries exhibit higher efficiency in their innovation systems, whereas Eastern European NIS rank at the bottom.
The estimation of OLS pooled, and random-effects models reveals that SFAR is significantly and negatively correlated with NIS efficiency. The relationship between SFAR and the other control covariates is also significant and negative for GDP (with a non-linear trend), education, workers with temporary contracts, investments and protectionism, which is consistent with previous empirical studies (Castaldo et al., 2024). The cultural attitude towards safety is also significantly negatively correlated with workplace injuries. In contrast, the unemployment rate has a positive and significant effect on fatal accidents.
Although the complexity of the topic requires further exploration, some insights can be outlined. The efficiency of the knowledge production process is positively and significantly associated with lower fatal workplace accident. From a policy perspective, insufficient investment in R&D may raise social concerns not merely related to growth. In the international context of technological development, public investment in innovation – such as through R&D funding, tax incentives, and support for SMEs – as well as efforts to encourage collaboration between industry and regulatory bodies, remains a strategic policy focus. Nevertheless, our findings indicate that NIS efficiency is significantly linked to occupational safety and health outcomes.
From a systemic perspective, innovation extends beyond merely introducing advanced technologies; it also involves integrating and embedding these developments within established social frameworks to enhance their overall societal benefits.
In summary, the relationship between innovation systems and welfare provides a rationale for adopting a comprehensive approach that aligns technological progress with social goals, such as workplace safety and employee well-being.
Notes
The SFA approach, while sensitive to model specification and distributional assumptions, offers several advantages (e.g., the separation of inefficiency from random noise and the ability to quantify efficiency). To ensure the reliability and consistency of our results, we employed alternative model specifications, input configurations, and inefficiency distributions.
See Fritsch and Slavtchev (2011) and Barra and Zotti (2018) on the use of such input.
For a detailed explanation of OECD taxonomy of economic activities based on R& intensity see Frascati Manual 2015; OECD, 2015)
These variables are treated as exogenous, meaning that although they influence the production process, they are not themselves classified as inputs or outputs.
A fatal accident at work is defined as an accident that leads to the death of a worker within one year of the accident. In practice, the notification of an accident as fatal ranges from national registration procedures where the accident is registered as fatal (https://ec.europa.eu/eurostat/cache/metadata/en/hsw_acc_work_esms.htm).
Specifically, we introduce a two-year lag of the efficiency scores, selected based on model fit criteria (Akaike Information Criterion and Bayesian Information Criterion).
The variables GDP per capita, Unemployment, Investments, Teredu, SME, Temporary employment and Part-time are expressed in natural logarithm.
All input data in the empirical estimates are included with a natural logarithm transformation. For instance, with respect to total GERD, the average value is 8.40 with a standard deviation of 1.52.
Source: Eurostat.