


This study uses social capital theory to analyze how social capital and supplier development support achieving supplier satisfaction and preferred customer status. The resulting model is compared between manufacturing and service suppliers.
A survey receiving 482 supplier responses from manufacturing and service suppliers was utilized and analyzed using partial least squares (PLS) path modeling and multi-group comparison tests.
The paper adds new explanations for preferred customer status through empirical evidence of relationships between supplier development, social capital, supplier satisfaction, and preferred customer status. Cognitive and relational capital directly support achieving preferred customer status. The role of supplier satisfaction in achieving preferred customer status is lower for manufacturing suppliers.
Both service and manufacturing suppliers could also be studied in their specific industry settings. A more in-depth investigation of other business relationship dynamics, such as power, is needed in a future study.
Service and manufacturing suppliers need different strategies to obtain the benefits from supplier development and social capital building. For service suppliers, more intangible factors are relevant in comparison to manufacturing suppliers.
This study advances the literature in two main ways. First, it elaborates the role of supplier development and social capital in the path toward supplier satisfaction and preferred customer status as perceived by suppliers. Second, this study answers the calls for a better understanding of the contextual characteristics underlying potential differences in how preferred customer status is formed.
1. Introduction
The dynamics of buyer–supplier relationships are changing from suppliers competing for customers to buyers competing for capable suppliers. In several industries, there are no more than two or three leading suppliers in the market. This drives customers to compete for the best resources and offerings from the same suppliers (Dyer and Hatch, 2006; Pulles et al., 2014, 2022) and pursue “reverse marketing” efforts (Essig and Amann, 2009; Vos et al., 2016). Moreover, companies' tendency to reduce their supply base for efficiency reasons and outsourcing core activities has increased buyers' reliance on their suppliers. Recently, the risks related to resource acquisition and centralized global supply chains have materialized in an unprecedented way. The COVID-19 pandemic has revealed the vulnerability of critical supply chains, for example in businesses around the world dependent on semiconductors and chips from China. Moreover, the sanctions against Russia because of the Ukrainian war limit the availability of crucial raw materials and energy for several manufacturing industries in many countries, especially in Europe. To increase access to valuable resources, it is important for buyers to understand how to gain preferred customer status. However, the reasons why suppliers treat their customers differently require more clarification (Pulles et al., 2016), and understanding of the drivers of preferred customer status (i.e. customers' strategic prioritization by a supplier) still needs to be improved (Glavee-Geo, 2019; Hüttinger et al., 2014; Pulles et al., 2019; Vos et al., 2021). Hence, studies examining the determinants of preferred customer status are increasingly important (Vos et al., 2021).
Until now, most studies on supplier satisfaction and preferred customer status that take a theory-driven stance mainly focus on social exchange perspectives and the resulting notion of reciprocity in relationships (Schiele et al., 2012; Weller et al., 2021), but they neglect most other relevant theories that could increase explanatory power. Social capital theory, in particular, is suitable for studying this phenomenon, as was already noted by Schiele et al. (2015), who conceptually argued for incorporating social capital theory into supplier satisfaction and preferred customer research. In essence, social capital theory has been found to be a beneficial lens for analyzing the social structures and processes in supply chains and business-to-business relationships (Hartmann and Herb, 2014; Lawson et al., 2008; Preston et al., 2017) and more social capital research has been called for (Gelderman et al., 2016). Hence, this study assesses the relevance of key social capital dimensions (i.e. relational, structural, and cognitive capital) in achieving supplier satisfaction and preferred customer status.
At the same time, there have been recent calls for more research into supplier-oriented actions of buyers and their impact on preferred customer status dynamics (Glavee-Geo, 2019; Pulles et al., 2019). The most prominent supplier-oriented action, supplier development, is often seen as the most beneficial in improving the supplier's experience of the relationship (Ghijsen et al., 2010) and has already been found to influence supplier satisfaction and resource mobilization (Glavee-Geo, 2019; Pulles et al., 2022). As a result, we expect supplier development to be a potential activity for a buying firm aiming to improve social capital (Blonska, 2010; Krause et al., 2007). Hence, we aim to add new insights to the literature on the relevance and effectiveness of supplier development activities (Ghijsen et al., 2010; Glavee-Geo, 2019; Krause et al., 2007) by considering the dynamics between supplier development and social capital in influencing supplier satisfaction and preferred customer status.
Furthermore, several preferred customer status and supplier satisfaction studies have already noted the importance of distinguishing different purchasing situations or supplier segments (Pulles et al., 2016, 2019; Vos et al., 2016). In the literature, a major distinction is increasingly made between service and manufacturing operations. Over the last few decades, the service business has risen as an important new area of research in purchasing and supply management, which developed relatively separately from traditional manufacturing businesses (Giunipero et al., 2019). In particular, studies examining preferred customer status in service industries have been called for due to the potentially different characteristics of these suppliers, such as different types of interactions or dependencies with suppliers in the service sector (Pulles et al., 2016). Hence, it can be expected that potential differences between manufacturing and service suppliers might have an influence on the dynamics between supplier development efforts, social capital, supplier satisfaction, and preferred customer status. Hence, this study will investigate these potential differences in more detail.
In summary, this study will assess the impact of a buyer's supplier development efforts and social capital on supplier satisfaction and preferred customer status. In addition, it compares the research model between both service and manufacturing operations. This leads to the following research question (RQ):
How do social capital and a buyer's supplier development efforts facilitate supplier satisfaction and preferred customer status awarded by manufacturing and service suppliers?
This study used questionnaires and collected 482 supplier responses, which were analyzed using PLS-path modeling and multi-group comparison tests. It provides two major contributions. Firstly, the findings increase our understanding of the dynamics between the antecedents of supplier satisfaction and preferred customer status by paying attention to the role of supplier development and the different dimensions of social capital. The results support the previous findings of a positive impact of supplier development in buyer–supplier relationships (Glavee-Geo, 2019; Pulles et al., 2022), as it systematically increases social capital. Also, the findings support previously conceptual assumptions that social capital is indeed highly relevant for achieving supplier satisfaction and preferred customer status (Schiele et al., 2015). Secondly, this study answers the need for more differentiation between various suppliers (Pulles et al., 2016; Vos et al., 2016). The findings revealed differences between service and manufacturing suppliers in the path toward supplier satisfaction and awarding preferred status to customers. Especially with manufacturing suppliers, social capital appeared to be the major route for gaining preferred customer status, while with service suppliers, the path goes through supplier satisfaction. Hence, this study adds to the growing body of research that emphasizes attention in research toward including service operations (Giunipero et al., 2019; Pulles et al., 2016) and the possibility that supplier satisfaction might not always be a necessary condition to achieve preferred customer status (Piechota et al., 2021). The next section continues with a review of the relevant concepts and the research model.
2. Literature review and hypotheses
2.1 Supplier satisfaction as a key antecedent of preferred customer status
Preferred customer status (PRECS) is a strategic prioritization by a supplier (Hüttinger et al., 2012) and an allocation of rare privilege for buyers (Pulles et al., 2016). It is defined as “a relative status which is awarded by the supplying firm to its favorite customer(s). Relative to standard customers, preferred customers are offered preferential resource allocation” (Hüttinger et al., 2014, p. 703). Buying firms with PRECS can obtain preferential resource allocation from suppliers that also serve competitors, leading to competitive advantages in the marketplace (Pulles et al., 2016). Many benefits of PRECS have been identified in the literature, such as increased availability of scarce materials (Nollet et al., 2012), competitive prices (Patrucco et al., 2020; Schiele et al., 2011), and innovation promotion (Pulles et al., 2014).
To be awarded with PRECS, supplier satisfaction (SUPSAT) has been argued to be one of the key factors to be addressed (Vos et al., 2016). Meeting or exceeding the expectations of the supplier is referred to as achieving SUPSAT (Hüttinger et al., 2012; Pulles et al., 2016; Vos et al., 2016). As such, SUPSAT research focuses on ongoing relationships, and SUPSAT can be defined as “a positive affective state resulting from an overall positive evaluation of the aspects of a supplier's working relationship with the buying firm” (Hüttinger et al., 2014, p. 703). The positive influence of SUPSAT on PRECS has been shown in various studies (see, e.g. Bemelmans et al., 2015; Hüttinger et al., 2014; Pulles et al., 2016). This leads to the first hypothesis:
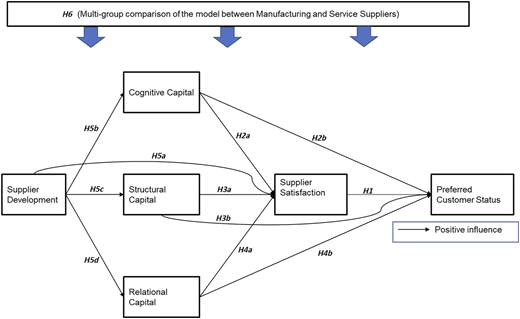
Supplier satisfaction is positively related to preferred customer status.
Earlier studies have already provided an understanding of the antecedents of SUPSAT (Essig and Amann, 2009; Ghijsen et al., 2010; Hüttinger et al., 2014; Vos et al., 2016, 2021) and PRECS (Hüttinger et al., 2014; Pulles et al., 2016). Whereas most studies have focused on practice-oriented antecedents, such as a differentiation between relational, economic, and operative factors in ongoing buyer–supplier relationships (Vos et al., 2016), more theory-driven assessments have been called for. The relevance of a more systematic theoretical basis of antecedents was already acknowledged by Schiele et al. (2015), who emphasized the potential value of social capital theory (SCT) as a lens in SUPSAT and PRECS research. Yet, apart from conceptual discussions, SCT has not been empirically applied to SUPSAT and PRECS research until now. Whereas the direct link of SUPSAT to PRECS is demonstrated, the possible indirect links regarding social capital on PRECS are under-researched (Whipple et al., 2015). Therefore, in the next section, the relevance of a social capital perspective on PRECS is discussed in detail.
2.2 Social capital in achieving supplier satisfaction and preferred customer status
Social capital in supply chains and business relationships has received increasing attention in the literature (Hartmann and Herb, 2014; Horn et al., 2014; Whipple et al., 2015). Research has shown that social capital can generate various performance benefits related to costs, delivery performance, and quality (Carey et al., 2011; Matthews and Marzce, 2012; Whipple et al., 2015). Nahapiet and Ghoshal (1998) define social capital as “the sum of the actual and potential resources embedded within, available through, and derived from the network of relationships possessed by an individual or social unit” (p. 243). According to them, social capital facilitates the creation of intellectual capital, and by developing and sharing social capital within the firm's business relationships, competitive advantages can be achieved. Social capital increases a firm's efficiency and cooperative behavior and reduces opportunism, and it facilitates relationship building in supply chains (Autry and Griffis, 2008).
The three most identified and researched dimensions of social capital are cognitive, structural, and relational capital (Nahapiet and Ghoshal, 1998). Cognitive capital is built on shared understanding and goals, structural capital is related to the configuration of interaction, and relational capital reflects the quality of the relationship between the actors. Many studies have examined the interlinks between the different dimensions of social capital (Carey et al., 2011; Horn et al., 2014; Roden and Lawson, 2014) and their relationships to operational performance (Lawson et al., 2008; Matthews and Marzec, 2012; Whipple et al., 2015) as well as the strategic performance of a business relationship (Gelderman et al., 2016; Villena et al., 2011). However, less research has concentrated on the benefits of social capital as perceived by suppliers (Horn et al., 2014; Krause et al., 2007; Roden and Lawson, 2014), its impact on SUPSAT and PRECS, and capturing the impact of all three perspectives of social capital (Matthews and Marzec, 2012). Hence, this study focuses on the divergent features of the social capital dimensions and how they are linked to SUPSAT and PRECS, as well as to what extent supplier development practices promote each social capital dimension.
Regarding the first dimension of social capital, the cognitive capital dimension refers to assets and systems, such as shared interpretations, language, codes, and goals that allow the development of intellectual capital within the organization and business network. This type of capital helps to avoid misinterpretations (Hartmann and Herb, 2014; Min et al., 2008) and is beneficial in goal alignment (Parra‐Requena et al., 2010). Successful business relationships require shared goals, aligned business strategies, and “win–win” situations between the business partners. Shared goals drive suppliers' interest in committing to business relationships with buyers (Patrucco et al., 2020). Aside from shared goals, cultural similarity is an essential element of cognitive capital (Inkpen and Tsang, 2005). Cultural differences may have an important effect on the outcomes of business negotiations. Cultural differences reduce joint profits and negatively moderate the influence of trust in business relationships (Ribbink and Grimm, 2014), whereas cultural similarity does the opposite. The characteristics and nature of the organizational culture influence buyer–supplier relationships and are intertwined with cognitive capital. Consequently, it can be expected that both goal alignment and cultural similarity, as represented by cognitive capital, increase the effectiveness of relationship interactions (Schiele et al., 2015) and, therefore, have a positive impact on SUPSAT. Moreover, factors close to cultural similarity, such as geographical proximity and cluster membership (Hüttinger et al., 2014; Steinle and Schiele, 2008), have been found to be relevant for influencing PRECS. At the same time, Hüttinger et al. (2014) argued that strategic compatibility, including strategic fit, is a relevant antecedent of PRECS, which resembles the notion of cognitive capital in the literature (Inkpen and Tsang, 2005). Therefore, it can be expected that both SUPSAT and PRECS are positively influenced by higher cognitive capital. This leads to the following hypotheses:
Cognitive capital in a buyer–supplier relationship has a positive impact on supplier satisfaction.
Cognitive capital in a buyer–supplier relationship has a positive impact on preferred customer status.
Second, the structural capital dimension is constituted of the configuration of linkages and patterns of connections between the people and organizational units. It consists of actual relationships and personal ties in a certain organizational or network context. It helps in exchanging information and communication in buyer–supplier relationships and creates opportunities to gain new knowledge and contacts with experts. Structural capital is conceptualized as a strength of the existing social interaction ties in buyer–supplier relationships (Carey et al., 2011; Tsai and Ghoshal, 1998). According to Krause et al. (2007), a buyer's investments in structural capital improve a buyer's performance. Moreover, it has been found that structural capital, as a social interaction connecting a supplier and a buyer, is related to the innovation performance of a buyer (Carey et al., 2011). In the context of this study, it can be expected that the characteristics of structural capital, such as frequent communication and meetings with the customer, ease of collaboration, and having a clear contact person, allow the supplier to have a better business relationship with the buying firm and, thus, increase SUPSAT (Schiele et al., 2015). Regarding PRECS, research has already noted that a buyer's well-coordinated business processes, mutual scheduling, and offerings for new business opportunities increase a supplier's willingness to award PRECS (Hüttinger et al., 2012, 2014). From the supplier side, the ability of a buyer to build up and develop relationships with effective communication and leadership reflect structural capital and facilitate the institutionalization of PRECS in buyer organizations (Tchokogué and Merminod, 2021). Hence, it is hypothesized that:
Structural capital in a buyer–supplier relationship has a positive impact on supplier satisfaction.
Structural capital in a buyer–supplier relationship has a positive impact on preferred customer status.
Finally, the relational capital dimension refers to personal relationships developed over time through interactions that influence people's behavior and can be characterized as “assets created and leveraged through relationships” (Nahapiet and Ghoshal, 1998, p. 244). Relational capital consists of trust, obligations, expectations, and shared norms (Nahapiet and Ghoshal, 1998). Whipple et al. (2015) have pointed out that an increase in trust can enhance relational capital, but the interdependence of both buyers and suppliers is required. According to Krause et al. (2007), relational capital as a form of dependency explains a buyer's cost performance in a supply chain. Several SUPSAT and PRECS researchers have already found that relational atmosphere, trust, and commitment have a positive influence on both SUPSAT and PRECS (Ghijsen et al., 2010; Paul et al., 2010). The underlying reasoning is that relational quality and behavior, which improves reciprocity and flexibility between suppliers and buyers, has a direct impact on the resulting buyer–supplier bonds and the perception of a shared future, which are relevant for both SUPSAT and PRECS (Hüttinger et al., 2012, 2014). Hence, it can be expected that a supplier that perceives higher relational capital will be more satisfied with the relationship and more inclined to give PRECS to a buyer. This leads to the following hypotheses:
Relational capital in a buyer–supplier relationship has a positive impact on supplier satisfaction.
Relational capital in a buyer–supplier relationship has a positive impact on preferred customer status.
2.3 Supplier development in social capital building and achieving supplier satisfaction
The growing understanding of the role of capable suppliers in value creation (Kähkönen and Lintukangas, 2018) has boosted firms to improve their supplier relationships. Hence, buyer firms may use relational means to increase their suppliers' satisfaction (Hüttinger et al., 2014). Supplier development is a concrete activity that aims to improve relational outcomes in buyer–supplier relationships (Ghijsen et al., 2010). It refers to the efforts “of a buying firm with its supplier to increase the performance and/or capabilities of the supplier and meet the buying firm's supply needs” (Krause and Ellram, 1997, p. 21). Depending on the level of the buying firm's commitment to supplier development, firms may have different practices such as training, certification, and technical assistance to improve the performance and capability of their supplier. The progress of this development process occurs due to the relational strength and knowledge transfer between a supplier and a buyer (Khan and Nicholson, 2014).
The efforts put into supplier development programs have increased over the years and have been shown to lead to improved trust and better supplier commitment (Dyer and Hatch, 2006; Nyaga et al., 2010; Patrucco et al., 2020). It has also been found that investments in supplier development inevitably improve social relations between buyers and suppliers and can lead to better satisfaction (Glavee-Geo, 2019). Consequently, the development practices together with improved social relations constitute the supplier development process, and this can be utilized as a mechanism to improve SUPSAT. This leads to the following hypothesis:
Supplier development has a positive impact on supplier satisfaction.
Next to its potential direct impact on SUPSAT, there is indication in the research that social capital might be a relevant step between supplier development efforts and relevant positive relationship outcomes (Blonska, 2010). In this context, supplier development actions can be expected to influence the different dimensions of social capital. Regarding cognitive capital, actions that develop intellectual capital within the organization and its business network, such as collaboration in R&D and supplier involvement in the buyer's new product design (Sánchez‐Rodríguez et al., 2005), training and educating suppliers (Krause et al., 2007), and knowledge transfer (Khan and Nicholson, 2014), have been shown to create shared goals and mutual learning between a supplier and a buyer and, thus, can increase cognitive capital within the relationship (Blonska, 2010). Therefore, it is argued that:
Supplier development has a positive impact on cognitive capital.
Regarding structural capital, supplier development actions usually establish linkages and patterns of connections between suppliers and buying firms. Examples of these are supplier certification; providing equipment, tools, and capital (Humphreys et al., 2004); and offering technical assistance (Forker and Hershauer, 2000) to suppliers. The purpose of actions is to improve interaction and create strong structural ties between supplier and buyer and, thus, enhance structural capital in a relationship (Tsai and Ghoshal, 1998). Consequently, it is suggested that:
Supplier development has a positive impact on structural capital.
Regarding relational capital, site visits to suppliers and inviting them to the buyer's site (Humphreys et al., 2004), supplier reward and recognition (Krause and Ellram, 1997), informal communication and socialization processes (Cousins et al., 2006), and trust (Paul et al., 2010) refer to personal relationships developed over time through interactions between people and are signs of relational capital in supplier development processes. Krause et al. (2007) have also linked supplier development more directly to relational capital, where the length of the relationship and dependency of both parties improved buyers' cost performance. Moreover, it was found that supplier development practices often increase trust and commitment to business relationships, which have a direct effect on relational capital (Blonska, 2010). Therefore, it is proposed that:
Supplier development has a positive impact on relational capital.
2.4 Differences in the relationships with service and manufacturing suppliers
The effects of supplier development and social capital on SUPSAT and PRECS may depend on the type of purchases being looked at (Hüttinger et al., 2014; Vos et al., 2016). For example, Vos et al. (2016) examined the distinction between direct procurement and indirect procurement in achieving PRECS and SUPSAT. Even though they did not find significant differences, they advised future research to analyze possible product-related contingency situations that go beyond the direct/indirect distinction. Moreover, if interdependencies between different contextual enablers (such as different supplier types) of PRECS and SUPSAT are not known, this might hamper the choice of the best strategy for a buying firm (Routroy, 2016). In this context, the purchasing of services is regularly distinguished from material procurement by many researchers. Services are special, as they are often challenging to determine before the actual purchasing decision (Van der Valk and Rozemeijer, 2009), and the presence of extensive customer inputs may be necessary for a successful service delivery process (Vargo and Lusch, 2008). Buying services requires continuous interaction because the service provider and the buyer are usually co-producing the service; thus, they are both value co-creators (Van der Valk et al., 2009). The challenge of service purchasing is the assessment of delivery quality and performance because the expected service quality and the experienced service may differ. Also, the number of affected employees at the buyer firm may be higher in the case of services compared to manufactured goods (Fitzsimmons et al., 1998). Despite these distinguishing characteristics compared to the purchase of products, research on SUPSAT and PRECS has not yet assessed what the exact impact of these different characteristics could be. Regarding potential effects, the more specific and professional services are exchanged, the more important the role of informal and behavioral control becomes, compared to buying mass services (Stouthuysen et al., 2012) or even finished products (Cao and Lumineau, 2015). Hence, especially social capital between buyer and supplier might be more relevant in the service purchasing process, as it usually requires more of an interactive process of value creation than (manufactured) product procurement. Also, the impact of supplier development and the overall need for SUPSAT to achieve PRECS might be different, due to the underlying differences between the two purchasing situations. Hence, this study compares service versus manufacturing suppliers with a multi-group comparison to assess possible differences. Based on the aforementioned reasoning, it can be expected that differences exist, as in particular social capital might be more supportive of the achievement of SUPSAT and PRECS when buying business services instead of manufactured products. This leads to the final hypothesis:
There is a difference between manufacturing and service suppliers regarding the impact of supplier development and social capital on supplier satisfaction and preferred customer status.
Figure 1 summarizes the research framework analyzed in this study. In addition to the variables in the figure, four control variables were used: company size, relationship length, key supplier status, and direct/indirect purchasing status. An explanation of these control variables and the methodology applied to test the model are explained in the next section.
3. Methodology
3.1 Empirical data
A survey was used to collect the data for this research from the suppliers of four buyer firms. A supplier was asked to evaluate its relationship to one of the four buyer firms with which it has an existing business relationship. The four buyer companies were selected based on their similar characteristics. They all are large firms, have their headquarters in Finland, and operate mainly in business-to-business markets (one company also operates in consumer markets). Their supplier base is international, but they all are characterized by a Nordic country business culture. Large size was expected to make buyer firms' supplier management and relationships more established, facilitating the study of supplier development and social capital. It also allowed the investigation of a large set of suppliers. The buyers were selected to include both service and manufacturing firms. Two companies (MANU1, 2) represent manufacturing (machinery industry and equipment), and the two others (ICT1, 2) represent service operations (information and communications technology, ICT). Both companies in ICT are providing solutions that integrate products and services. Selecting suppliers of these four companies gave this study the possibility to have relatively similar company contexts. It also allowed a distinction on relevant characteristics such as service versus manufacturing differentiation and the buyers' evaluation of suppliers' status.
The survey included 30 statements measured on a 7-point Likert scale, ranging from “strongly disagree” to “strongly agree.” The survey instrument was pre-tested with the target group and fellow researchers. The questionnaire was implemented as a web-based survey. The respondents could respond to the survey for three weeks, and two reminder messages were emailed to them. The test for non-response bias was conducted by comparing three groups: initial invitation, first reminder, and second reminder. Analysis of variance (ANOVA) was carried out on all the research constructs, and no significant differences were found, indicating that non-response bias is unlikely to be a problem in the study. Furthermore, ANOVA was used to investigate potential differences in the demographic variables (e.g. company size) between the three response groups. No significant differences were found, indicating coherence of groups and representation of the whole supplier population.
Buyer firms participated in selecting the respondent suppliers to represent those suppliers that comprise 80% of the purchasing spend in the buyer company. According to the buyer firm representatives, this selection included suppliers with more established relationship practices but left out more ad-hoc suppliers with limited business importance. A total of 1,840 suppliers received the survey administered by the independent researchers from which 482 useable responses were received, resulting in a response rate of 26.5%. Suppliers' key contact persons (CEOs, senior managers, key account managers) in their relationship with the specific customer received the survey. To avoid potential social desirability bias (e.g. giving too positive responses), the survey cover letter clearly indicated that the survey study and related analyses are implemented by independent researchers and the results of individual suppliers will not be disclosed to the buyer firms. Honest responses were also encouraged. Table 1 presents descriptive statistics of the respondents and their companies.
Demographic information on the respondents' companies (N = 482)
| Company turnover | |
| <€2 mil | 6.1% |
| >€2 mil – < €10 mil | 22.2% |
| >€10 mil – < €50 mil | 29.6% |
| >€50 mil – < €100 mil | 7.5% |
| >€100 mil – < €500 mil | 12.4% |
| > €500 mil | 22.2% |
| Key supplier status | |
| Key suppliers | 32.6% |
| Other suppliers | 67.4% |
| Industries | |
| ICT | 25% |
| Machine construction | 20% |
| Equipment and tools | 13% |
| Materials | 6% |
| Logistics | 6% |
| Support services | 5% |
| Others | 25% |
| Length of buyer–supplier relationship | |
| <1 year | 1.1% |
| >1 year– <3 years | 3.1% |
| >3 years– <5 years | 6.4% |
| >5 years– <10 years | 14.5% |
| >10 years– <20 years | 48.3% |
| >20 years | 26.6% |
| Direct/indirect suppliers | |
| Direct suppliers | 69.6% |
| indirect suppliers | 30.4% |
| Service vs manufacturing suppliers | |
| Service suppliers | 25% |
| Services and products | 13% |
| Manufacturing suppliers | 62% |
| Suppliers of different buyer firms | |
| ICT1 | 6.7% |
| ICT2 | 20.1% |
| MANU1 | 39.0% |
| MANU2 | 34.2% |
Regarding the respondents, supplier size was pretty evenly distributed, and the firms typically had long-term customer relationships. Around a third of the suppliers possessed key supplier status, as reported by their customers. Most of the suppliers were direct suppliers. Almost half of the suppliers operate in the ICT and machine construction industries. Around a third of suppliers have relationships with ICT customers, while two-thirds have their customer relationships with manufacturing firms.
3.2 Measurement of research variables
The survey instrument (see Appendix) was created based on a literature review in the fields of operations management, industrial marketing management, and purchasing and supply management. Existing survey scales were utilized when available in published studies. The content validity of the questionnaire was improved through (1) testing by two experienced survey scholars and (2) testing by four persons representing the intended population. The most common reasons for scale adaptations were the need to switch the perspective from customer viewpoint to supplier viewpoint, the need to make the survey understandable for the intended population, and, for social capital, the need to achieve better coverage of the different social capital dimensions. A few new items were designed, and some of the original items of the scales were left out since they were deemed as too complex by the persons representing the intended population. The order of questions in the survey structure was also slightly modified according to comments regarding the flow of responding, for example through putting “easier” questions earlier in survey sections. Some items of the original scales were dropped due to poor measurement statistics (e.g. loadings) in the data analysis. Appendix presents the scales used in this study. All the adaptations are explained in more detail below.
The measurement for supplier development was adapted from Anderson and Weitz's (1992) and Nyaga et al.’s (2010) studies dealing with dedicated idiosyncratic investments in a business relationship. As a response to testing feedback, provision of dedicated personnel was changed to general resource provision to the relationship (item SDEV2). In addition, based on a request for specifying the period of investments, the question was related to the last three years. Two items from the original scale regarding technology provision and equipment investments (Nyaga et al., 2010) were dropped due to insufficient measurement statistics.
Various scales have been used for measuring social capital dimensions in the literature, and existing scales have also been criticized (e.g. Bohnenkamp et al., 2020; Preston et al., 2017). As a response, we did measurement development for better coverage. Firstly, trust is a key element of relational capital (Carey et al., 2011; Horn et al., 2014), and we utilized relationship trust literature (Doney and Cannon, 1997) to capture the trust level directly (RCAP4, 5). Statements regarding perceived sincerity of a customer (Doney and Cannon, 1997) were part of the survey but dropped out in data analysis. Another essential aspect of relational capital is commitment (Bohnenkamp et al., 2020), which was measured (RCAP1, 3) similarly as Krause et al. (2007). A further commitment statement measuring the positive reasons for continuing the relationship was designed for the purposes of this study (RCAP2). Secondly, regarding structural capital, frequency of interactions (SCAP1, 2) was adapted from Li et al. (2014) to capture both general and social interactions in line with survey testing feedback from company participants. Social interactions were focused on meeting interaction. Knowledge of customer needs was also part of the original scale, but the item was dropped during survey testing. Additionally, statements reflecting the nature of communication (SCAP3, 4) (Bohnenkamp et al., 2020) were developed for the purposes of this study. Finally, cognitive capital was measured similarly to Villena et al. (2011) and Gelderman et al. (2016). Similarity of organizational culture and management style were split into two items (CCAP3, 4). Similarity of vision was modified into strategic goals in the relationship (CCAP1) as this made more sense to the practice participants.
Supplier satisfaction was measured with items measuring the overall satisfaction with the business relationship (SUPSAT1, 2), the lack of regret to do business (SUPSAT3), and a statement measuring the satisfaction with the overall value obtained from the customer relationship (SUPSAT4), as in the study by Hüttinger et al. (2014). The statements of PRECS (PRECS1–4) were derived from the studies by Hüttinger et al. (2014) and Schiele et al. (2011) and examined the status of the company in relation to the other customers in the firms' customer base.
Service orientation on the part of a supplier was measured with a seven-item classification responded by a supplier (1 = Only physical products; 2 = Mostly physical products, few services; 3 = Slightly more physical products, fewer services; 4 = Balance of products and services; 5 = Slightly more services, fewer physical products; 6 = Mostly services, few physical products; 7 = Only services) measuring the ratio of services and physical products in the supplier offerings to the particular customer. Service suppliers were defined as those who had mostly or only services in their offerings, while manufacturing suppliers were those who had mostly or only products in their offerings for the customer.
Control variables were measured with single-item variables. Firstly, indirect supplier status (1/0) was measured as defined in the buyer classification system and linked to supplier information. Earlier studies have suggested the potential effect of indirect supplier status on the path toward PRECS (Vos et al., 2016). Secondly, key supplier status was evaluated by the buyer firm and connected to supplier survey information. The buyer firm purchasing representatives were instructed to label their suppliers as key suppliers if they are crucial for their business in terms of monetary value or supply risks and thereby receive more attention than regular suppliers. Hence, the key supplier status approximates a supplier providing either strategic or bottleneck items (Kraljic, 1983), which may affect the path toward PRECS. The potential differences may also be interesting in light of the importance of PRECS from the buyer perspective (cf. Caniëls et al., 2018). Thirdly, relationship length in years and, fourthly, company size in turnover were elicited with open-ended survey questions without classification. Larger suppliers may have more established relationship practices with their customer, and long relationships may have resulted in stronger social capital in a business relationship. Finally, buyer firm industry was controlled by examining the potential difference in whole structural model results between suppliers providing offerings for service (ICT1, 2) and manufacturing customers (MANU1, 2). This is done since suppliers of identifiable customer firms are investigated.
3.3 Analysis methods
The statistical software IBM SPSS Statistics 24 and SmartPLS 3.2.8 were used to analyze the data. PLS-SEM analysis was used with bootstrapping of 5,000 rounds. PLS is an estimation technique that maximizes the variance explained. It was chosen for this study for the following reasons. First, PLS is often recommended when elaborating on theory with a model that is still under development. Little empirical evidence exists connecting the different dimensions of social capital with SUPSAT and PRECS. Hence, we tested all possible connections between these constructs. Furthermore, this study investigates the differences between service and manufacturing suppliers without a priori assumptions about the differences in specific parts of the model. PLS can successfully accommodate complex models, including complex interactions/multi-group analyses (Sumo et al., 2016), as in the case of our study. Second, PLS is suitable in situations where the number of observations is limited (Hair et al., 2017; Sarstedt et al., 2016). Our study includes an analysis with sub-groups of data with considerably small sample sizes. Finally, PLS can be used with single-item variables, such as our control variables, without identification problems (Hair et al., 2017).
The number of missing values in the responses ranged from 0 to 5%. Pairwise deletion of missing values was applied. Alongside with the main analysis, this study included permutation tests to investigate the potential differences in the main results between service and manufacturing suppliers (H6). Permutation is a non-parametric test that assesses the differences between data sub-group path coefficients. In addition to the reporting of significant differences between the path coefficients of two groups, the study also reports descriptively the results with the two supplier data-groups to further indicate potential differences. For a robustness check of the PLS analyses, we also performed covariance-based SEM for the model using Lavaan (version 0.6–10). The results for the whole dataset revealed that all significant paths hold true for the Lavaan analysis, even adding one new significant path between cognitive capital and SUPSAT. The reliability and validity statistics were also all satisfactory using Lavaan, indicating that the model remains highly robust among different analysis techniques. Below, further explanations are provided on the quality of the data.
Common method bias was tested with (1) a common method factor (Liang et al., 2007; Podsakoff et al., 2003) and (2) marker variable analysis (Rönkkö and Ylitalo, 2011). The unmeasured common method factor testing followed Liang et al.’s (2007) approach. A common method factor including the indicators for all the studied constructs was formed. The variance of each item (squared loadings) was analyzed in alignment with both its principal construct and the common method factor. On average, principal constructs had a substantive variance of 0.734, while the method factor had an average variance of 0.025. The ratio between substantive variance and common method variance was approximately 29. As suggested by Rönkkö and Ylitalo (2011), the first step in marker analysis was the examination of correlations between the variables of the survey. A marker variable measuring the respondent supplier's financial performance with a Likert scale was identified. This variable was part of the original survey but not included in the main research constructs. While the main research constructs examine business relationship level, the marker variable relates to internal aspects of a supplier, that is, it was expected not to have a direct relationship to the main research constructs. The marker variable had a constant, relatively low positive correlation with other variables of the survey. When including the marker variable as a predictor to endogenous variables in the model, no significant relationships including the marker variable were found. All the hypothesized relationships were effectively the same when the marker variable was included; only very small changes to the betas were found (the largest being at the level of 0.02). As a result of these tests, we conclude that a common method bias is unlikely in our study.
Two-stage least squares (2SLS) regression analysis with instrumental variables was used to assess the potential issues of endogeneity (e.g. Bellamy et al., 2014; Gligor, 2018). Four instrumental variables were identified to meet the following conditions: no significant relationship to endogenous variable PRECS but significant relationships to SDEV, CCAP, SCAP, RCAP. The chosen variables, measured with a Likert scale, relate to operative information sharing (e.g. delivery schedule and forecast information) in a business relationship that associate with social capital (Li et al., 2014) and supplier development (Krause and Ellram, 1997). However, operative information sharing reflects operative excellence, which has been found to have no direct influence on PRECS (Hüttinger et al., 2014). First, SUPSAT was regressed on all assumed instrumental variables and the control variables (Gligor, 2018). Then, SUPSAT was regressed on the control variables only. The difference in R2 was 0.235. The same was conducted for the constructs CCAP (R2 difference 0.360), SCAP (R2 difference 0.237), and RCAP (R2 difference 0.185). Due to the notable differences in the R2 values, instrumental variables can be regarded as satisfactory. Second, in alignment with Bellamy et al. (2014), the substituted values of CCAP, SCAP, RCAP, and SUPSAT, augmented by instrumental variables, were calculated, and the hypothesized relationships were investigated again in relation to SUPSAT and PRECS. The results reveal no major differences in the significances of the hypothesized path relationships. Also, the differences in the betas remain very small, the largest being −0.053. In line with the Durbin–Wu–Hausman test, the error term from the first phase regression was added to the second phase regression. The error term of SUPSAT was not related to PRECS in this test (β = 0.170; p-value = 0.460). As a conclusion, endogeneity is unlikely to cause challenges in our study. Table 2 summarizes the data descriptives of this study.
Correlations table, means, and standard deviations
| Construct correlations | 1 | 2 | 3 | 4 | 5 | 6 |
|---|---|---|---|---|---|---|
| 1. Supplier development | – | |||||
| 2. Cognitive capital | 0.56 | – | ||||
| 3. Structural capital | 0.61 | 0.46 | – | |||
| 4. Relational capital | 0.54 | 0.54 | 0.58 | – | ||
| 5. Supplier satisfaction | 0.54 | 0.44 | 0.64 | 0.71 | – | |
| 6. Preferred customer status | 0.47 | 0.48 | 0.48 | 0.57 | 0.57 | – |
| Means | 4.53 | 4.93 | 5.58 | 6.16 | 6.21 | 5.76 |
| Standard deviations | 1.33 | 1.13 | 1.05 | 0.70 | 0.79 | 1.07 |
Note(s): All Pearson correlations are significant at the 0.001 level
All the constructs are reflective. Their internal consistency and reliability were examined with composite reliability (CR) (Fornell and Larcker, 1981), average variance extracted (AVE), and factor loadings (Hair et al., 2014). The CR was between 0.86 and 0.94 and, hence, higher than the threshold of 0.7. AVE values varied between 0.61 and 0.81, exceeding the 0.50 threshold (Fornell and Larcker, 1981). Cronbach's alphas of all items were higher than 0.7, as suggested by Hair et al. (2014). All survey items had outer loadings higher than the 0.7 threshold. No cross-loadings between the items were found when using the threshold of 0.2. Appendix shows the loadings and quality criteria in more detail.
Testing for discriminant validity, the squared correlations between the pairs of constructs were found to be lower than the AVEs for each individual construct (Fornell and Larcker, 1981). Also, the Heterotrait-Monotrait (HTMT) ratio was used to test discriminant validity. All relationships between constructs have an HTMT value below 0.85, which can be considered an indicator of high discriminant validity (Hair et al., 2017). The variance inflation factor (VIF) was used to evaluate multicollinearity. The VIF values varied between 1.0 and 2.7, which is well below the cut-off level of 10.
The effect size of the relative impact of a specific exogenous latent variable on an endogenous latent variable was examined using Cohen's test. The test for the predictive relevance of the model was carried out by applying Q2 statistics using the cross-validated redundancy approach (Hair et al., 2014). These are included and explained in the results section.
4. Results
4.1 Results and observed relationships in the path model
Figure 2 presents an overview of the results of the research model.
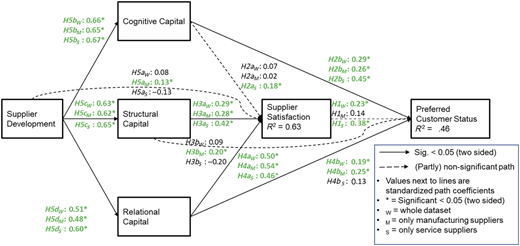
Regarding H1, SUPSAT has a positive link to PRECS (β = 0.230, p-value < 0.01) with the whole dataset, but surprisingly not in the case of manufacturing suppliers. H1 is only supported for service suppliers and suppliers providing both products and services. The level of cognitive capital did not explain SUPSAT with the whole dataset (H2a). However, there is support for H2a in the case of service suppliers (β = 0.179; p-value < 0.05). Furthermore, cognitive capital is positively related to PRECS (β = 0.291, p-value < 0.001), supporting H2b. The same observation can be found with both datasets, but with service suppliers the relationship β is stronger (0.447 vs 0.264). Hence, H2b is supported for the whole dataset, and H2a is only supported for service suppliers.
Regarding H3a and 3b, structural capital (β = 0.293; p-value < 0.001) is positively related to SUPSAT. The same finding can be found in the datasets of both service and manufacturing suppliers, with service suppliers having a stronger effect (0.418 vs 0.278). Also, no significant relationship between structural capital and PRECS was found (β = 0.088, p-value 0.153) with the whole dataset. However, in the case of manufacturing suppliers, this hypothesis is supported. Hence, H3a is fully supported, but H3b is only supported for manufacturing suppliers.
Regarding H4a and 4b, relational capital (β = 0.495; p-value < 0.001) is positively related to SUPSAT. The same finding can be found in the datasets of both service and manufacturing suppliers. There is a positive significant relationship between relational capital and PRECS (β = 0.194, p-value < 0.01) in the full dataset. However, there was only support for H4b in the case of manufacturing suppliers. Hence, H4a is fully supported, but H4b is only supported for manufacturing suppliers.
Supplier development does not directly relate to SUPSAT with the entire dataset (H5a). However, in the case of manufacturing suppliers, supplier development seems to directly relate to SUPSAT (β = 0.128; p-value < 0.05). In relation to H5b–5d, there is a positive and significant relationship between supplier development and cognitive capital (β = 0.656; p-value < 0.001), structural capital (β = 0.625; p-value < 0.001), and relational capital (β = 0.505; p-value < 0.001). These relationships are significant for both manufacturing and service supplier separately as well. Hence, H5b–5d are fully supported, but H5a is only supported in the context of manufacturing suppliers.
The permutation test reveals two significant differences in the structural model results between service and manufacturing supplier groups. First, there is a significant difference in the relationship between supplier development and SUPSAT (p-value = 0.016). Second, the difference in the relationship between structural capital and PRECS is also significant (p-value = 0.007). As a conclusion, we found support for H6 at least in these two structural paths. As shown in Figure 2, other differences in the sub-group structural model results can also be found, although the difference between groups is not significant.
Regarding the control variables, there were only a few significant relationships between the control variables and social capital. First, large suppliers perceive slightly more cognitive capital in the relationship (β = 0.054; p-value < 0.05), which may be explained by the similarly large size of the customer firms. Second, indirect suppliers seem to grant PRECS slightly more often (β = 0.074; p-value < 0.05), while key suppliers are slightly more demanding in giving a PRECS (β = −0.076; p-value < 0.05). A further group comparison between service and manufacturing customers was conducted to control the potential effect of customer firm industry on the results. While most of the comparisons remained insignificant, one notable difference occurred in the path between structural capital and PRECS (permutation p-value = 0.007). More specifically, with the suppliers for service companies (ICT1 and ICT2), the result regarding this path is practically unchanged (β = −0.202; p-value = 0.058). However, with the suppliers for manufacturing companies (MANU1 and MANU2) this path is significant (β = 0.179; p-value = 0.010). This observation aligns with the comparison results between service and manufacturing suppliers (H6), giving further support to this observation.
4.2 Effect sizes and implied mediation effects
In relation to PRECS, the model explains 45.5% of the variance in PRECS, and Q2 statistics show that the model has a large level (0.356) of predictive relevance for PRECS. The effect sizes for the significant paths on PRECS were small (F2s varied between 0.032 and 0.101).
Regarding the overall impact on SUPSAT, the model explains 62.6% of the variance in SUPSAT, and its predictive relevance (Q2) on SUPSAT is high (0.448). The effect sizes for the significant paths on SUPSAT are high in the case of relational capital (F2 = 0.428) and small with structural capital (F2 = 0.122).
Regarding the impact on social capital, the effect size of supplier development on each dimension of social capital is medium (F2 on structural capital = 0.624 and relational capital = 0.328) or large (F2 on cognitive capital = 0.733). The model explains 27–43% of the variation in the dimensions of social capital. In the case of cognitive capital, R2 is 0.43 (0.46 for service suppliers and 0.41 for manufacturing suppliers), for structural capital R2 is 0.40 (0.46 for service suppliers and 0.40 for manufacturing suppliers), and for relational capital R2 is 0.27 (0.40 for service suppliers and 0.25 for manufacturing suppliers). Q2 statistics through the cross-validate redundancy approach indicate a medium level of predictivity for the model relevance on cognitive (0.26), structural (0.28), and relational capital (0.25). The model fit index SRMR is 0.074, which is below the commonly used threshold of 0.08 (Hair et al., 2017).
We also tested for the implicit mediation effects of social capital and SUPSAT within the model. Three paths in the model have potentially significant (i.e. full) mediation when investigating the results of the full dataset. Mediation tests for these paths were conducted as suggested by Hair et al. (2017). Specific indirect effects in these paths were all significant as follows: supplier development – structural capital – SUPSAT (β = 0.205, p = 0.000); supplier development – relational capital – SUPSAT (β = 0.258, p = 0.000); structural capital – SUPSAT – PRECS (β = 0.079, p = 0.004). All these paths also include significant total indirect effect, which lead to a conclusion that the paths include a significant mediation.
5. Discussion
5.1 Literature implications
5.1.1 The role of social capital and supplier development in preferred customer status
This study answered the call for studies that pay attention to preferred customer antecedents other than SUPSAT (Piechota et al., 2021), including the potential benefits of supplier development efforts (Glavee-Geo, 2019) and an SCT perspective (Schiele et al., 2015). Indeed, it was found that these perspectives add new insights to our understanding of how buyers can achieve PRECS and challenges the emphasis of SUPSAT as the most important construct (Hüttinger et al., 2012; Vos et al., 2016). Our study contributes to the discussion of the role of social capital in buyer–supplier relationships by giving new evidence on the outcomes of social capital on SUPSAT and PRECS beyond the widely studied performance benefits (Gelderman et al., 2016; Lawson et al., 2008; Villena et al., 2011). In addition, this study advances the understanding of social capital as a facilitator of benefits of supplier development (Krause et al., 2007) by finding that actions increasing social capital not only lead to improved operational performance in buyer–supplier relationships (Whipple et al., 2015) but also contribute to making suppliers more satisfied.
Regarding the whole dataset, as a response to our first hypothesis (H1), we found support for several prior studies by showing that SUPSAT has a positive connection with PRECS (e.g. Bemelmans et al., 2015; Pulles et al., 2016). Furthermore, the examination of the importance of cognitive, structural, and relational capital provided several new insights. First, the findings showed that cognitive capital plays a crucial role in directly supporting PRECS granted by a supplier, as suggested in H2b. Cultural similarity, proximity, and knowledge dissemination increase cognitive capital in buyer–supplier relationships and, as demonstrated, also the likelihood of awarding PRECS. The result elaborates on the findings of Steinle and Schiele (2008) and Hüttinger et al. (2012, 2014) stating the importance of strategic fit as an antecedent of PRECS. Aligned goals, essential to cognitive capital, seem to also support the long-term commitment (Krause et al., 2007) needed to receive PRECS. Similar expectations and goals support mutual understanding, which leads to better interaction and communication between organizations (cf. Tsai and Ghoshal, 1998), demonstrably important in differentiating from other customers. Surprisingly, cognitive capital does not support SUPSAT (H2a), emphasizing its specific role in differentiating between SUPSAT and PRECS. Second, structural capital is clearly beneficial in making suppliers more satisfied, as hypothesized in H3a. However, for the full dataset, no direct relationship to PRECS (H3b) was found in this study. It was also demonstrated that SUPSAT fully mediated the link between structural capital and PRECS. Essentially, structural capital appears as something supportive of identifying and meeting supplier expectations but not directly beneficial in exceeding the expectations or building advantage compared to other customers (cf. Nollet et al., 2012). Structural capital primarily reflects the information flow and access to information (Krause et al., 2007; Villena et al., 2011), which are basic requirements in business relationships. Third, relational capital was found to be important both in improving SUPSAT (H4a) and in awarding a PRECS (H4b). This supports earlier studies highlighting the importance of relational capital in business relationships (Krause et al., 2007; Min et al., 2008). It is not surprising that relational capital benefits SUPSAT, since there are existing studies with similar observations. However, it is a new finding to see relational capital as also directly important for gaining PRECS. Relational capital has an almost equally strong direct impact on PRECS as SUPSAT. Relational quality, reciprocity, and flexibility drive PRECS (Hüttinger et al., 2012, 2014), showing trust and commitment and, thus, are tied to relational capital (Krause et al., 2007; Nahapiet and Ghoshal, 1998). Relational capital, in turn, has been found to provide benefits to both relationship parties (Hartmann and Herb, 2014), for example through reduced transaction costs (Dyer and Singh, 1998). Apparently, relational capital thereby indicates that suppliers see the relationship with a customer in a positive light and, hence, increase the possibility of giving dedicated efforts to that customer.
Aside from the inclusion of social capital, supplier development was shown to be an important factor. Supplier development may facilitate cooperative efforts (Humphreys et al., 2004) and improve supplier commitment, trust, and satisfaction toward the buyer (Dyer and Hatch, 2006; Glavee-Geo, 2019; Nyaga et al., 2010). Yet, relationship implications of supplier development have gained limited research attention with mixed results (Paul et al., 2010; Tran et al., 2021), and no clear evidence of supplier development's influence on the various dimensions of social capital exists. Furthermore, only a few studies have examined the benefits of supplier developments as perceived by suppliers (Glavee-Geo, 2019; Nagati and Rebolledo, 2013; Paul et al., 2010; Pulles et al., 2022). This study found that supplier development has a strong and uniform impact on building the three dimensions of social capital (H5b–d). Supplier development practices such as training and early involvement of suppliers and certification, and buyers rewarding them, increase social capital, as suggested by Krause et al. (2007). Earlier research has found that capital-specific supplier development efforts may improve SUPSAT (Ghijsen et al., 2010; Glavee-Geo, 2019). However, this relationship does not exist in the case of this study (H5a) and is mediated by the degree to which supplier development creates social capital. This finding supports the study of Paul et al. (2010), showing that human-centered development practices do not increase SUPSAT, and the study of Vos et al. (2016), who found only indirect effects. Specifically, this study adds to current understanding by finding that relational and structural capital are important mediators in developing suppliers to increase SUPSAT.
Two interesting observations regarding control variables were found: indirect suppliers grant PRECS more often and key suppliers less often. Indirect suppliers often provide non-standard products (Vos et al., 2016) requiring interaction with the customer, which may be one explanation for this observation. In the case of key suppliers, the observation may also be related to power balance of the relationship. Key suppliers potentially have more power in the relationship, and they can be more selective in granting PRECS in such relationships. Buyers should pay attention to this in making selections of which suppliers they invest in (cf. Vos et al., 2021). In the case of non-key suppliers, PRECS may be easier to achieve, but it is probably more crucial for competitiveness with key suppliers.
5.1.2 Differences between manufacturing and service suppliers
Earlier studies have already pointed to the importance of distinguishing contextual characteristics of purchases when assessing buyer–supplier relationships (Patrucco et al., 2020; Pulles et al., 2016; Vos et al., 2016), for example by focusing on public and private companies (Schiele, 2020) or direct and indirect suppliers (Vos et al., 2016). This study concentrated on the differences between service and manufacturing suppliers. The reason for differentiating these types of suppliers was that earlier research suggested that service purchasing requires closer interactions (Hallikas et al., 2014) due to solution customization requiring joint thinking and resource integration (Macdonald et al., 2016).
While many of the findings remained the same for the two datasets (manufacturing versus service suppliers), some interesting new observations were also found. SUPSAT was not found to drive PRECS in the case of manufacturing suppliers (H1). This is against the common understanding in the literature (cf. Hüttinger et al., 2012), but also in line with newer suggestions in the literature that SUPSAT might not always be a necessary condition to achieving PRECS (Piechota et al., 2021). Instead of SUPSAT, social capital was found to have a direct relationship with PRECS in the case of manufacturing suppliers. Furthermore, a direct impact of relational and structural capital on PRECS did not exist in the relationships with service suppliers. In the case of manufacturing suppliers, overall satisfaction does not reflect the relationship as well as for service suppliers, and the more specific types of social capital are relevant instead. Furthermore, the importance of cognitive capital was found to be even higher with service suppliers compared to manufacturing suppliers. This suggests that more “intangible” aspects of a relationship, such as similarity in firm objectives and cultures, are more essential for service business (cf. Van der Valk and Rozemeijer, 2009). The finding may reflect the less formal relationship governance with service suppliers (Cao and Lumineau, 2015) and the necessity of customer inputs in service provision (Jääskeläinen et al., 2020).
To get further insights into the findings above, service and manufacturing supplier groups were investigated in greater depth to identify their potential differences considering power balance in the relationship. Service suppliers studied were more often key suppliers (44.6 vs 34.9%) for their customers and thereby potentially grant PRECS slightly less often. This may partly explain why social capital is not so directly related to PRECS with service suppliers. In other words, efforts to satisfy suppliers are first needed, since the service suppliers studied also have somewhat more power in the relationship.
Earlier research has paid attention to the role of the buyer-firm industry in the effects of supplier development (Nagati and Rebolledo, 2013). This study extended the prevailing literature by identifying differences between suppliers with service and product offerings. Relationship building in service businesses is important due to the continuous interaction and co-creation of value between suppliers and buyers (Van der Valk et al., 2009; Vargo and Lusch, 2008). The findings of this study suggest that service supplier development results mainly in social capital building, which in turn influences satisfaction and resource allocation. Social capital is required in making a service supplier satisfied, for example through efforts aligning the expectations of a customer and the delivery and content of service provided. Yet, for manufacturing suppliers, the impact of supplier development was not so indirect and also directly influenced SUPSAT. This may be explained by the potentially more effective and established supplier development activities in the manufacturing industry (Glavee-Geo, 2019; Nagati and Rebolledo, 2013), which not only build social capital but also appear to directly influence SUPSAT.
5.2 Managerial implications
Our study provides an increased understanding for managers pondering the possible options for improving supplier relationships to make suppliers more satisfied and even grant a PRECS. Overall, the results show that it is generally beneficial to (a) engage in supplier development to increase social capital in the relationship and (b) work on individual social capital dimensions directly to achieve a PRECS. However, different approaches for services and manufacturing suppliers can also be recommended.
Practical Implication I: For service suppliers, supplier development efforts are less relevant, but more “intangible” shared values (cognitive capital) and overall satisfaction are more relevant in achieving a preferred status. Supplier development is a common practice to facilitate the performance of supplier relationships. However, it is not likely to create immediate benefits in the case of service suppliers, as it does not influence satisfaction directly and seems to only help indirectly in accumulating social capital in the relationship. Yet, at the same time, the cognitive social capital dimension and the overall satisfaction with the relationship are more relevant to achieving PRECS for service suppliers than for manufacturing suppliers. As services are usually co-created in interactions between buyer and supplier, a practical implication is that buyers should focus on their interactions with service suppliers, especially on shared interpretations and values, to create cognitive capital. This means that the buyer should actively discuss mutual goals with service suppliers and focus on a shared working culture, as this will make suppliers more satisfied and increase their willingness to grant PRECS.
Practical Implication II: For manufacturing suppliers, more “tangible” actions, such as frequent meetings (structural capital) as well as supplier development efforts are more relevant for eventually achieving a preferred status, whereas “intangibles” such as supplier satisfaction are less relevant. For manufacturing organizations, supplier development was relevant for both social capital creation as well as SUPSAT. At the same time, structural capital (i.e. the overall pattern of connections between buyer and supplier) is more relevant to achieving PRECS than for service suppliers. This includes the presence of well-established network ties between the buyer and supplier as well as access to contacts at the buying firm for the supplier. Manufacturing suppliers seem to be a bit less in a need of “intangibles,” as manufacturers do not necessarily need to be satisfied with the relationship with the buyer to award PRECS. In other words, an overemphasis on explicitly satisfying suppliers appears not to be necessary for manufacturers, as it does not lead to PRECS; rather, social capital paths toward PRECS should be taken for manufacturing suppliers.
In general, the above implications can be used to calibrate the relationships with service and manufacturing suppliers. As a final managerial note, in relation to handling the relationship with both service and manufacturing suppliers, it is important to realize that developing suppliers and building social capital in relationships requires resources from the buyer. This means that only a few selected suppliers can and should receive full attention/resources from the buyer (Pulles et al., 2016). Consequently, the effort toward the buyer–supplier relationship – and ultimately a PRECS – should be guided by the results of this research as well as the relative relevance of the supplier to the buyer.
5.3 Conclusion, limitations, and future research proposals
Overall, this study provides two main contributions. (1) It contributes to SUPSAT and PRECS research by answering the call for studies with a more theory-grounded approach to SUPSAT and PRECS, especially through the utilization of SCT (Schiele et al., 2015) and a supplier development focus (Glavee-Geo, 2019; Pulles et al., 2019). The findings show that social capital, especially cognitive capital, directly supports the achievement of PRECS. This further emphasizes the presented call for studies on cognitive capital (Gelderman et al., 2016). At the same time, the findings contradict the argument that SUPSAT is a necessary condition for obtaining PRECS (Vos et al., 2016) and supports the recent suggestion by Piechota et al. (2021) that SUPSAT might be only one of several antecedents to PRECS. At the same time, this study advances the understanding of the role of social capital as an important intermediator of the benefits of supplier development by explicating the route toward SUPSAT and PRECS. By this, we are answering the need to clarify the mixed results regarding the consequences of supplier development (Humphreys et al., 2004; Tran et al., 2021). (2) This study answers the call for more understanding on the contextual characteristics of the antecedents of PRECS (Hüttinger et al., 2014; Pulles et al., 2016; Vos et al., 2016). We provide evidence on differing results of the effects of antecedents based on different types of suppliers. With a large dataset in a cross-industrial setting, we can support the notion that service suppliers value the intangible elements in relationships more than manufacturing suppliers (Giunipero et al., 2019; Van der Valk et al., 2009).
This study is not without limitations. Different ways of measuring social capital have been applied in the literature. This study strived to cover the scope of the original definitions by Nahapiet and Ghoshal (1998) and engaged in the systematic pre-testing of scales. However, the structural capital measurement of this study covered the quantity and nature of interaction but not the infrastructure supporting the interaction, which is another possible focus to include (cf. Bohnenkamp et al., 2020). Even though the scales of this study appeared to have both a good face and statistical validity as well as reliability, we encourage future research to develop even more comprehensive scales of social capital and tackle the critique on existing scales even more extensively than we did in this study. Furthermore, this study concentrated on the responses by suppliers connected to specific buyers. This enabled the connection of buyer-related characteristics in the analysis and controlled for several influencing variables. However, the population is not purely random but affected by the selection of buyer firms. In addition, buyer firms participated in selecting the suppliers and provided the researchers with access to suppliers. While several means to reduce the risk of social desirability bias were implemented, the absence of such bias cannot be fully verified. The service supplier companies included in the sample in this study represent various industries. A further study could select a more specific service industry (e.g. only professional services) and possibly identify new observations. Additionally, indirect suppliers should receive more attention, to gain more understanding on the potential differences in the dynamics of granting PRECS. Furthermore, a future study could go deeper in investigating the potential interactive effects of dependency and power balance in the relationships in relation to the antecedents of PRECS found in this research. More specifically, past research has already showed that dependence, power, and conflict dynamics can have an influence on PRECS and SUPSAT (Caniëls et al., 2018; Vos et al., 2021). It would be very interesting to assess how these dynamics interact with social capital and in different industries regarding PRECS. Moreover, a further qualitative study could extend the explanation of the results between the different supplier groups. This study started with the assumption that social capital is more relevant in the service purchasing process (compared to manufacturing) due to the need for a more interactive process. According to the results, this assumption is too straightforward, as different dimensions of social capital can play varying roles in gaining PRECS. Specifically, further research could pay attention to the role of cognitive capital, which was found to be highly important in relationships with service suppliers. As another limitation, this study investigated direct supplier development efforts, while further study could elaborate on different types of supplier development and possibly compare their effects on social capital and SUPSAT. In particular, a longitudinal research approach would give a more accurate understanding on the temporal effects of supplier development and potential additional contextual contingencies influencing its impact. Finally, a dyadic or buyer perspective for evaluating the social capital and supplier development dynamics as well as their (combined) eventual consequences beyond PRECS might be interesting, as this might also depend on whether the suppliers are seen as a key partner by the buyer.
Funding: This study was supported by the Academy of Finland (332430, 332431).
References
Appendix
Research constructs and measures
| Construct | Code | Item | Loa-ding | CR | AVE | Cron-bach's alpha |
|---|---|---|---|---|---|---|
| Supplier development | During the last three years, <CUST> has … | 0.914 | 0.726 | 0.873 | ||
| SDEV1 | … provided high expertise to this relationship | 0.873 | ||||
| SDEV2 | … provided resources to this relationship | 0.891 | ||||
| SDEV3 | … has helped us a lot to become a better supplier, such as providing training or service | 0.829 | ||||
| SDEV4 | … has initiated programs that are desired to enhance our overall business | 0.815 | ||||
| Cognitive capital | CCAP1 | We set the strategic goals for the relationship together with <CUST> | 0.831 | 0.864 | 0.614 | 0.795 |
| CCAP2 | Our company's goals regarding the relationship are consistent with those of <CUST>’s | 0.837 | ||||
| CCAP3 | We share a similar organizational culture with <CUST> | 0.727 | ||||
| CCAP4 | Our company and <CUST> have similar management styles | 0.737 | ||||
| Structural capital | SCAP1 | We communicate frequently enough with <CUST>’s personnel | 0.877 | 0.894 | 0.678 | 0.841 |
| SCAP2 | We have meetings frequently enough with <CUST>’s personnel | 0.801 | ||||
| SCAP3 | It is easy to collaborate with <CUST>’s personnel | 0.819 | ||||
| SCAP4 | It is easy to identify the right contact persons at <CUST> | 0.796 | ||||
| Relational capital | RCAP1 | We expect our relationship with <CUST> to continue for a long time | 0.805 | 0.892 | 0.624 | 0.850 |
| RCAP2 | There are many positive reasons for maintaining this relationship | 0.784 | ||||
| RCAP3 | We see our relationship with <CUST> as a long-term partnership | 0.799 | ||||
| RCAP4 | <CUST> keeps its promises to our company | 0.746 | ||||
| RCAP5 | We consider <CUST> as trustworthy | 0.813 | ||||
| Supplier satisfaction | SUPSAT1 | Our firm is very satisfied with the overall relationship to <CUST> | 0.880 | 0.906 | 0.707 | 0.861 |
| SUPSAT2 | Generally, our firm is very pleased to have <CUST> as our business partner | 0.851 | ||||
| SUPSAT3 | Our firm does not regret the decision to do business with <CUST> | 0.780 | ||||
| SUPSAT4 | Our firm is satisfied with the value we obtain from the relationship with <CUST> | 0.852 | ||||
| Preferred customer status | Compared to other customers in our firm's customer base … | 0.943 | 0.805 | 0.919 | ||
| PRECS1 | … <CUST> is our preferred customer | 0.883 | ||||
| PRECS2 | … we care more for <CUST> | 0.911 | ||||
| PRECS3 | … <CUST> receives preferential treatment | 0.885 | ||||
| PRECS4 | … our firm's employees prefer collaborating with <CUST> | 0.913 |
Note(s): CR = composite reliability; AVE = average variance extracted

