


Artworks made of hygroscopic materials, like wooden panel paintings, are susceptible to environmental conditions. Traditional panel paintings typically consist of a wooden panel coated with layers of gesso, paint and varnish. Due to environmental fluctuations, the gesso layer and the wood panel may respond differently to moisture changes, triggering potential fractures. The investigation of such phenomena is of high interest, but it is still scarcely studied by engineers.
The proposed study aimed to create a simplified 3D finite element model for paintings to identify environmental conditions that could exceed critical strain levels. A penny-shaped crack within the gesso layer was modelled and, after applying a given deformation, the strain energy density failure criterion was used to assess if the crack was in a critical state.
Various combinations of geometric parameters of the model were explored, and to save computational time and cost, machine learning algorithms (namely extreme gradient boosting machines and Gaussian process regression algorithms) were introduced. The analyses were carried out on different panel paintings 3D models obtained by varying the wooden species and the boundary conditions, for exploring a wide number of combinations.
Moreover, the integration of machine learning can potentially reduce the reliance on numerical simulations and offer new insights into the conservation of artworks, a field in which such tools are still scarcely exploited.
1. Introduction
Wooden panels have been widely used as support for paintings for centuries, especially in Europe. For example, Poplar wood (Populus L.), Lime wood (Tilia L.) and Spruce wood (Picea abies L.) were commonly preferred and used in the XV and XVI centuries by Raphael, Leonardo da Vinci, Pinturicchio and many other famous painters and artists (Bruzzone and Galassi, 2011). The main issue with panel paintings is that they have heterogeneous and hygroscopic nature, due to the presence of layers of materials (i.e. the support layer in wood, the preparation layer in gesso and the paint layer) with different mechanical properties and susceptible to Temperature (T) and Relative Humidity (RH) variations (Jingran et al., 2014; Mecklenburg et al., 1998). As panel paintings are among the most prestigious and exhibited works of art, they are often subjected to microenvironmental variations when moved to one exhibition/museum to another, not to mention that they naturally age due to the materials decay. For this reason, heritage panel paintings are characterized by non-homogeneous craquelure patterns on the pictorial surface. The “craquelure patterns” refer to the network of cracks that develop on the surface of panel paintings over time and are identified by “breakage lines” and “islands”. The breakage lines correspond to the cuts that are formed through the pictorial layers, due to environmental agents or to the intrinsic instability of the material system. The intersections between different breakage lines create islands of different sizes and forms. Because of this configuration, the microclimatic variations may have a detrimental effect on these artworks’ mechanical strength and features (Łukomski, 2012), possibly leading to the risk of crack formation or of evolution of existing cracks in the pictorial layer. In this framework, a deep knowledge of the mechanical behavior of the wood and gesso layers are needed (Krzemień et al., 2016). To this aim, Finite Element Method (FEM) can help investigating the effects of environmental variation on the possibility of crack initiation and propagation in paintings. Bratasz and Vaziri Sereshk (2018) in 2018 used the FEM to analyze the process of crack saturation (i.e. the ratio of spacing between cracks and the gesso layer thickness) in panel paintings and determined the critical separation between cracks (i.e. craquelure island). Studies from the same authors found that the shearing fracture mode dominates the process of delamination, and that the crack saturation significantly changes the vulnerability of paintings to climate variations (Bratasz et al., 2020). Zhang et al. (2021, 2023) used FEM to study delamination and channeling cracks in paintings caused by environment-induced low-cycle fatigue, identifying the time for each type of crack to initiate and the corresponding crack growth rates. Then, Abdollahzadeh Jamalabadi et al. (2021), in 2021, used a three-dimensional model of a panel painting with a virtual network of rectangular cracks, to analyze the structural response of a paint layer by showing as the minimum distances between cracks under different loading conditions. Their findings showed that minimum distances between cracks parallel to the wood grain depended on the gesso stiffness, while isotropic drying shrinkage of gesso produced evenly spaced cracks in longitudinal and radial directions. Based on these outcomes, several studies have been focused on developing ways and approaches for minimizing the environment-induced risk of cracks and craquelures. Beside the numerical approach, most of them were mainly focused on carrying out monitoring and experimental campaigns, established for characterizing the mechanical and hygrothermal behavior of panel paintings’ constituent materials. As a matter of fact, it still exists a lack of understanding about the degradation mechanisms of such materials, thus limiting the development of reliable quantitative approaches for damage prediction. As an example, novel damage prediction functions were developed for wooden supports (Aste et al., 2019; De Backer et al., 2018; Califano et al., 2022a, 2023). In addition, it is only recently that Machine Learning (ML) algorithms started to be used for optimal prediction of damage evolution in paintings. Usually, these algorithms are trained on image data sets and can accurately detect and classify different types of damage such as cracks, blisters, detachments and mold growth (Angheluţă and Chiroşca, 2020; Kavkler et al., 2022). Algorithms can also be trained to assess the current condition of paintings, to predict future deterioration and to plan preservation strategies (Konsa et al., 2023). As an example, Random Forest, and K-nearest neighbors have been used to predict crack propagation in various materials (Omar et al., 2023). Notwithstanding, challenges still exist as: (1) the complexity and heterogeneity of composite historic materials (Ribeiro Junior and Gomes, 2024; Shamsirband and Mehri Khansari, 2021), (2) the difficulties in calibrating the model parameters (Li et al., 2019), (3) the difficulties in selecting appropriate features and variables for input in the ML algorithms (Hijazi et al., 2020). In fact, several key features might have an impact on the reliability of the ML outcomes. In a case like the present one, the most challenging feature is the identification of a fracture criterion which may work in interaction with the object’s material, geometry, mechanical properties and moisture response as the fracture toughness the J-integral (Abdollahzadeh Jamalabadi et al., 2021; Bratasz et al., 2020; Rachwał et al., 2012). Among these fracture criteria, the Strain Energy Density (SED) might assess the possibility of crack extension when its value reaches a critical threshold. This criterion has been applied to various materials in literature including brittle and quasi-brittle materials (Lazzarin et al., 2003; Lazzarin and Zambardi, 2001) and represents a well-established approach, hugely validated to investigate fracture both in static and dynamic conditions (Berto and Lazzarin, 2014). In its original conceptualization, the method was devoted to the fracture assessment of brittle materials, going from rocks (Berto et al., 2016; Justo and Castro, 2021; Razavi et al., 2018; Sangsefidi et al., 2020), to ceramics (Gómez and Elices, 2006), graphite (Ayatollahi and Torabi, 2010), etc. The SED approach has also been applied to particular components (occlusal loaded ceramic tooth crowns (Pegorin et al., 2012), adhesively bonded joint (Ferro and Berto, 2020), rubber (Heydari-Meybodi et al., 2018a, b), notched short glass fiber reinforced composites (Ibáñez-Gutiérrez et al., 2018), functionally graded aluminum-silicon carbide composite with U-notches (Barati et al., 2010)), thus proving the high versatility of the method. According to it, the brittle fracture occurs when the local SED W, evaluated in a given control volume, reaches a critical value, independent from the notch opening angle and of the loading conditions (Lazzarin and Zambardi, 2001). In case of wood, it has been demonstrated that wood species have a significant effect on fracture characteristic values, such as critical Stress Intensity Factor (SIF) and SED, because of the different modulus of elasticity (Brunetti et al., 2023), compressive strength and dimensional stability (Hu et al., 2021). Once the effective fracture criteria are identified and the mechanical properties of the wood, gesso and paint layer are characterized through a limited number of experiments, usually 2D and 3D Finite Element (FE) simulations are carried out to identify the time for crack initiation and growth under realistic cycles of RH (Bratasz et al., 2020; Bratasz and Vaziri Sereshk, 2018; Hutchinson and Suo, 1991; Zhang et al., 2021, 2023). Notwithstanding, in literature still very few parametric studies with FEM exist to train machine learning algorithms. Recent examples (Giannella et al., 2023; Jiang et al., 2024) showed how deep learning, coupled with FEM, was used for predicting the crack propagation and fatigue life and for identifying cracks and defects in different structures, respectively. Concerning historic structures, instead, computational methods coupled with FEM were proposed for describing the responses of historic masonry railroad arch bridges under typical loading conditions (Sobczyk et al., 2024). In general, adopting this dual methodological approach (FEM and ML algorithms) can contribute to enlarging the amount of training data for ML application, while ML can contribute to calibrating deterioration prediction models limiting the computational and experimental time significantly. Based on preliminary results (Califano et al., 2022b), the current work proposes the integration of FEM and a data-driven methodology for reducing the computational time when approaching the issue of climate-induced risk of craquelure occurrence on panel paintings. The crack island and panel painting layer geometries have been used to create a wide range of configurations (27 in total), that have been modeled considering the most influencing parameters, namely wooden species and the gesso recipe (Section 2), and later simulated via FEM taking advantage of symmetrical planes of the components to calculate the SED. The use of parametric finite element modeling has allowed the modification of the mechanical properties of the support and preparatory layers in the panel painting, as well as the variation of the wooden species typologies. Due to the many parameters that influence the craquelure formation and development which, combined with FEM parameters, are computationally expensive, a ML regression problem was integrated to save computational time. In particular, the regression problem was based on predicting the values of SED in given geometrical configurations; then, the predicted values were compared to the critical SED in order to classify between safe (no further climate-induced damage “0”) and unsafe (further climate-induced damage “1”). To further reduce the dimensionality of the damage assessment problem and the computation time the comparison of FE simulations and ML outcomes was carried out on a restricted 3D volume and 2D surface. The implementation of the above methods has led to promising outcomes in terms of capability of detecting the risk of craquelure and of computational time saving using the eXtreme Gradient Boosting (XGBoost) (Chen and Guestrin, 2016) machines and the Gaussian Process Regression (GPR) (Bousquet et al., 2004) algorithms (Section 3). Finally, some general considerations about the above approach applied to parametric studies in the field of conservation are provided (Section 4), together with concluding remarks and future perspectives (Section 5), thus stressing the novelty of the present study. It stands in illustrating how machine learning algorithms, coupled with numerical simulations, could provide information about the structural integrity of complex case studies such wooden panel paintings while reducing computational time. Therefore, the investigations herein described help bridge the gap between the fields of mechanical engineering and conservation, which have been considered separate and independent for long.
2. Numerical model and simulations
Panel paintings constitute a complex component in which different layers are involved: a wood support supplies for the needed structural strength while a gesso layer constitutes the proper base for the application of paints and varnishes constituting the painting (Abdollahzadeh Jamalabadi et al., 2021). However, this kind of multi-layer component results to be particularly sensitive to the environmental conditions and specifically to the RH fluctuations. Such variations in the relative humidity induce deformations in the component that, due to the different moisture related expansion coefficients, produce an induced stress field inside both layers with detrimental effects particularly on the gesso one, that is the formation of craquelure patterns and its development, due to its brittle behavior but also due to a lower thickness with respect to the wood one. During its history, a panel painting can experience two different kinds of moisture-induced deformations. The first type is related to the drying shrinkage of the gesso that induces strain in both x and z directions (Figure 1) y direction is not considered due to the limited extent of the thickness layer with respect to the other dimensions. While the second one is related to the moisture response of wood that is highly dependent on the moisture related expansion. Being wood an orthotropic material, the expansion coefficient is different for each direction; usually the highest expansion coefficients due to the moisture are along the radial (y-direction) and tangential (x-direction) directions while the longitudinal direction (z-direction) is considered to be dimensionally stable (Bratasz et al., 2020). Considering that the main aim of this work is to assess the effect of environmental changes on the structural integrity of panel paintings, related to the deformations induced by changes of relative humidity and temperature, during the development of the global topological model, to recreate the moisture response of wood, a 1% strain along the x dimension (Figure 1) was applied to the wood layer of the component; it is important to highlight that the application of the strain along only the x-direction comply with the real expansion coefficients of wood (being negligible along the longitudinal, z, direction and irrelevant along the tangential, y, direction for the problem studied in the present work) and gesso (being orders of magnitude lower with respect to wood ones). In particular, the 1% displacement load was imposed following the recommendations in Bratasz et al. (2020), where it is reported that, for newly prepared gesso specimens, failure happens at approximate 0.002 strain. As a matter of fact, the complexity of the analyzed case studies makes the mechanical characterization quite challenging. Ideally, the mechanical properties should be evaluated on the panel painting for which the safe conditions need to be established. This, of course, is not possible, and it could also be argued that it would not be useful to consider that such components – that are inherently different from each other – are usually stored together and, therefore, are subjected to the same indoor climate conditions. Considering the challenges in their mechanical characterization, it was mandatory to refer to other works in literature (Bratasz et al., 2020), dealing with the same problem, and to derive the worst-case scenario. In this way, safety is granted regardless of the considered panel painting. In addition, as reported in the literature (Antropov and Bratasz, 2024), the craquelure pattern of rectangular islands in layers of gesso have cracks which are parallel to the tangential and the longitudinal directions in wood. Therefore, while the panel may expand more readily in the y direction due to its shorter length, the overall deformation must be analyzed considering what is occurring in the tangential-longitudinal plane. This multidimensional analysis ensures accurate predictions of the panel’s response to various environmental factors stresses. As said above, the panel painting is a multi-layer structure composed by the wood support, a layer of gesso, paints and varnishes. The last two components of the layered structure have been neglected due to their significantly lower thickness with respect to the gesso and the wood layer and to an assumed low effect in determining the induced stress field in the component. Dealing with the craquelure, the gesso layer has been considered the weakest one even if the craquelure involves both gesso, paints and varnishes; this hypothesis results in a simplification for the modelling by neglecting paints and varnishes. It is also worth highlighting that a perfect bounding has been assumed between the different layers neglecting possible phenomena, such as delamination between the different layers. However, besides the useful simplification for modelling purposes, this approximation leads to more general conclusions applicable to a wider range of panel paintings; indeed, due to the several parameters involved, the focus must be kept on the most influencing parameters such as the geometrical one and the different types of woods and gesso recipes available. The possible combinations between the two different layers may result in different behaviors. A parametric FE model, in which not only the geometrical dimensions but also the mechanical properties of the two layers can be changed, has been developed for a deeper understanding of these components. However, the assessment of all the possible parameters that may influence the gesso behavior through fracture mechanics methods results computationally expensive and in order to decrease the computational time as much as possible, as aforementioned, a feasible solution has been found in the use of the SED method. However, an important advantage, especially for the purposes of this work, is the SED low sensitivity to the mesh refinement, being the SED a function of the stiffness matrix and of the nodal displacement (Lazzarin et al., 2010), which allows using a coarse discretization (other methods exploit the stress field) shortening the computational times.
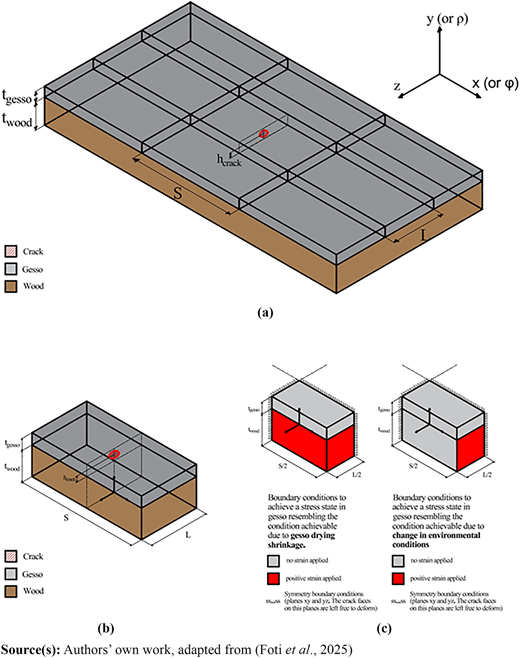
(a) Schematic representation of a penny-shaped crack (red circle) inside a damaged gesso layer of a panel painting; (b) enlargement of a single gesso island with the penny-shaped crack; (c) boundary conditions considered to resemble, in a simplified manner, the gesso drying-shrinkage and the change environmental conditions
(a) Schematic representation of a penny-shaped crack (red circle) inside a damaged gesso layer of a panel painting; (b) enlargement of a single gesso island with the penny-shaped crack; (c) boundary conditions considered to resemble, in a simplified manner, the gesso drying-shrinkage and the change environmental conditions
A parametric 3D FE model has been developed through the code Ansys® APDL that, in combination with the software MatLab®, allows for the definition of a highly automated procedure for the investigation of the several parameters involved in the damaging process of a panel painting. Generally, Non-Destructive Testing (NDT) by x-ray tomography (XR) scan show the presence of several defects inside the gesso layer. Therefore, a crack was modelled in the gesso layer having a crack length mm; such value represent the maximum experimentally measured crack in an actual gesso layer belonging to a panel painting (Abdollahzadeh Jamalabadi et al., 2021; Bratasz et al., 2020). The position along the x and z direction − the center of the gesso island − and the orientation of the crack inside the gesso layer − perpendicular to the x direction − have been chosen in order to consider the most critical conditions possible. On the other hand, the position of the crack along the y direction is changed in order to assess its effect on the structural integrity of the painting. It must be pointed out, however, that extreme positions that would result in the crack tip on the wood-gesso interface or on free surface of gesso were not considered. Only one of the gesso islands was considered in the model and to further reduce the computational time, only a quarter of it has been modelled exploiting the symmetry planes of the component. In order to keep the simulation time as low as possible while changing the geometrical parameters describing the component in the chosen range, the divisions and spacing on the lines have been determined starting from the finest element size on the model, that is the element size along the crack edge; knowing the dimensions of the component simulated and imposing the ratio between the element size along the lines, it was possible to determine the number of divisions for each line; this results in an optimal mesh for the component regardless of the combination of the geometrical parameters chosen, as it can be seen from Figure 2. The 20-nodes hexahedral element SOLID186 with three degrees of freedom per node: translations in the nodal x, y and z directions were used. Symmetric boundaries conditions along the mid-planes xy and yz have been applied considering the chosen simplified geometry for the gesso island.
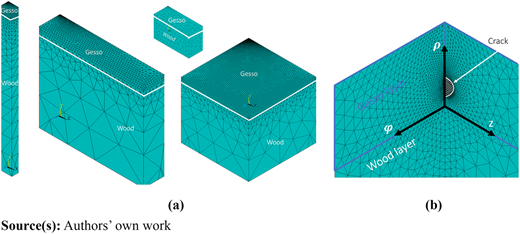
(a) Examples of the meshed component with changing the different geometrical parameters describing the schematized panel painting obtained through an automated procedure to establish the divisions and spacing along the different lines defining the geometry of the model. Notice that the mesh is created to be finer near the point of interest, that is the penny shaped crack, located entirely on the gesso layer. A detail of the mesh in the surrounding of the crack can be observed in image (b)
(a) Examples of the meshed component with changing the different geometrical parameters describing the schematized panel painting obtained through an automated procedure to establish the divisions and spacing along the different lines defining the geometry of the model. Notice that the mesh is created to be finer near the point of interest, that is the penny shaped crack, located entirely on the gesso layer. A detail of the mesh in the surrounding of the crack can be observed in image (b)
Regardless of the SED low sensitivity to the mesh refinement, a sensitivity analysis was required to consider as few as possible FEs in the model, while obtaining still accurate results. Besides, from the sensitivity analysis, it has been noted a tendency to overestimate the SED value that leads to the conclusion that even if small errors −related to the FE simulations themselves and not completely avoidable no matter of the method used −may be present, they are in favor of a preventive conservation perspective that is safety for the component studied. In agreement with the recommendations in Foti and Berto (2022), a mesh size of has been chosen along the crack edge and for the control volume. The SED value has been averaged on a toroidal control volume along the crack edges having a fictitious control volume characteristic length mm that, considering the experimental value of the fracture toughness obtained by Bratasz et al. (2020), results in a critical SED value equal to , with being a safety factor (Foti et al., 2025), that has been used to assess the safety of the component in two different cases, representative of a moisture response of the panel painting according to the methodology used by Abdollahzadeh Jamalabadi et al. (2021):
after the application of a 1% strain along the x direction;
after the application of a 1% strain along both the x and z directions.
Further details about the applied boundary conditions are provided in Figure 1 (c). Regarding the wood layer, three different wood species have been considered whose mechanical properties were recovered from literature (Bartolucci et al., 2020; Green et al., 1999) and reported in the Supplementary Table S1, together with the gesso mechanical properties.
In all the numerical simulations, the SED failure criterion has been adopted. This means that the SED value obtained for each simulation has been evaluated and compared to its critical value to assess whether the considered configuration is in safe condition (no further climate-induced damage) or not (further climate-induced damage). Twenty-seven different geometrical configurations of the model were obtained, for each wood type, by varying the two geometrical parameters of interest: the thickness of gesso () and the ratio between the thickness of wood panel over the gesso layer (). In particular had three values: 1.0 mm, 1.5 mm and 2.0 mm; , instead, had nine values: 2, 3, 4, 6, 8, 10, 12, 16 and 20. Configurations from 1 to 9 were characterized by fixed = 1.0 mm and by all the values of the thickness ratio, , respectively. Similarly, configurations 10 to 18 were obtained by fixing = 1.5 mm, and, finally, configurations 19 to 27 were obtained by fixing = 2.0 mm. Figure 3 schematizes the configurations, taking as example the lime wood. The choice of the geometrical parameters’ values was based on typical ones which are generally encountered in panel paintings (Foti et al., 2025; Riparbelli et al., 2023).
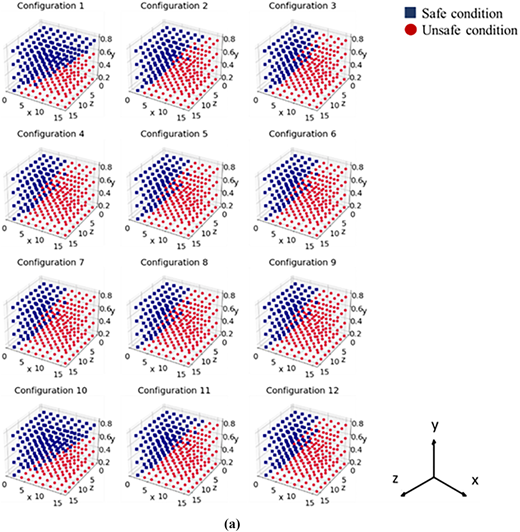
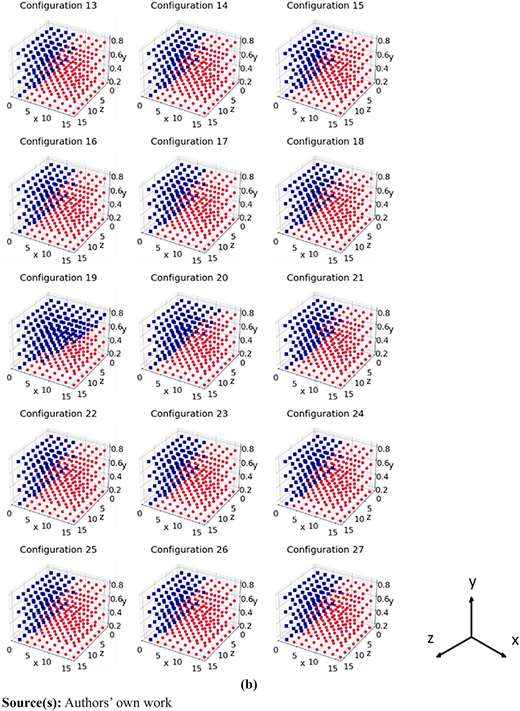
Crack configurations (colored scatters) for the twenty-seven geometrical configurations (the first twelve in (a) and the remaining in (b)) of the Lime wood panel model, taken as example. Red dots represent unsafe conditions, while blue squares represent safe conditions
Crack configurations (colored scatters) for the twenty-seven geometrical configurations (the first twelve in (a) and the remaining in (b)) of the Lime wood panel model, taken as example. Red dots represent unsafe conditions, while blue squares represent safe conditions
Each geometrical configuration is identified by a configuration number and all of them are characterized by a given number of points, reported in Figure 3 and representing all the analyzed crack configurations; in few words: each point stands for one FE simulation. In Figure 3, the coordinates (x, y, z) of each point parametrically vary within the 3D model and are rationalized as follows: where s, L and height crack (hc) are represented in Figure 1. In particular, Figure 3 (a-b) is representative of all the different crack configurations (colored points) considered within the selected geometrical configurations. In detail, the blue dots represent the safe conditions, while the red squared represent the unsafe conditions, as previously explained. It has to be noted that the case in Figure 3 is related to the FE model made in Lime wood and subjected to 1% strain only in the x direction, which has been taken here as an example. Although at a first glance the configurations may look alike, they differ from each other in terms of number of red/blue scatters and were reported herein to show the entire dataset used for the successive evaluations.
From Figure 3, it can be easily appreciated that the safe and unsafe conditions are clearly separated within the 3D volume, and that the separation behavior is barely dependent from the z-dimension , namely the width of the panel along the z-direction normalized respect to the thickness of the gesso layer. For this reason, in order to further reduce the computational time, as done in a previous work (Califano et al., 2022b), it could be interesting to: (1) focus on the volume comprising the interface between the safe and unsafe zones; (2) reduce the dimensionality of the problem and consider just fixed z planes within the 3D volume. According to these considerations, Figure 4 shows the plane z = 8 selected in the considered 3D volume: the colors have the same meaning as explained for Figure 3, while the empty scatters are those that have been unselected as they do not belong to the safe/unsafe interface zone. The black lines are the Separation Lines (SLs, thick black line in Figure 4) drawn as threshold between the two zones. The SLs are useful as, at a single glance, they allow to identify whether the considered damage configuration, under given boundary conditions and according to the SED criterion, may further progress. Therefore, if only a few geometrical configurations and crack conditions are known, in order to avoid time-consuming numerical simulations, being able to predict SLs for unknown geometrical and crack scenarios could be of extreme utility. To this end, in the following Section, machine learning approaches used for accomplishing the intended task are explained.
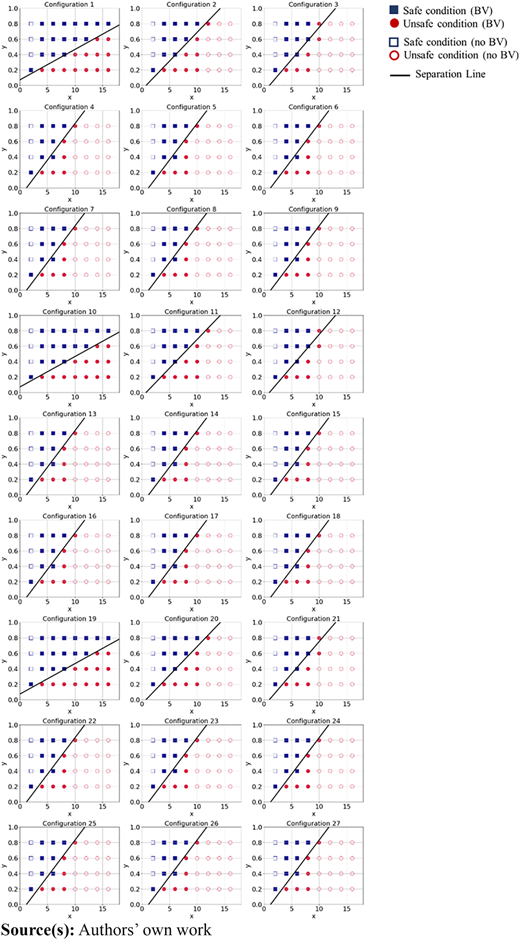
Plane z = 8 selected in the considered 3D volume shown in Figure 3. The red scatters represent the unsafe conditions, while the blue scatters the safe ones. The empty scatters are those that do not belong to the safe/unsafe interface zone. The black lines are the Separation Lines
Plane z = 8 selected in the considered 3D volume shown in Figure 3. The red scatters represent the unsafe conditions, while the blue scatters the safe ones. The empty scatters are those that do not belong to the safe/unsafe interface zone. The black lines are the Separation Lines
3. Machine learning models and implementation
According to the aim of the work, the problem under concern is a regression problem. As a matter of fact, the final goal is to predict the SED value for unknown configurations, in order to get to the prediction of SLs. Among the dozens of machine learning algorithms, two of them have been selected and tested for the intended task: XGBoost machines (Chen and Guestrin, 2016) and the GPR algorithm (Bousquet et al., 2004). The reason behind the choice of the algorithms mainly stands in the reduced dimensionality of the available data and, moreover, on previous studies published in Califano et al. (2022b), where XGBoost was implemented for similar case studies but with different aims. XGBoost has proven to be highly reliable, scalable and adaptable; it is based on enhanced gradient boosted trees and, due to its scalability, it generally shows excellent results on low-dimensional datasets as well. XGBoost algorithm builds ensemble models by sequentially adding decision trees, where each new tree corrects the errors of the previous ones. The algorithm is based on a gradient descent optimization approach to minimize a loss function, making it highly effective for both classification and regression tasks. Then, a stochastic approach was selected to be implemented, as well. And, due to the enormous potential of GPR machines and their proven robust behaviour, the choice fell on those algorithms. GPR is a nonparametric Bayesian approach which models the relationship between inputs and outputs using a Gaussian process, defining a distribution over functions. It is particularly used for regression tasks and has several benefits, working well on small to medium-sized datasets and having the ability to provide uncertainty measurements on the predictions. The choice fell on these two different approaches as, on one hand, XGBoost machines provide a deterministic solution, that is they provide the predicted values for the output variable. On the other hand, GPR algorithms provide a stochastic solution, namely the mean value and the standard deviation of all the possible values predicting the output ones. This way, two different-nature approaches were implemented. Both models have been implemented through Jupyter® notebooks in Python® language by means of the sklearn packages, and the following steps have been followed for the two approaches and the three types of wood:
Training of the algorithm.
The training phase has been carried out by considering the set comprising configurations n. 1, 3, 5, 7, 9, 10 and 19. The training set was determined based on previous preliminary analyses which have not been reported herein for the sake of conciseness. Several attempts were carried out selecting different training sets, in order to explore the entire set of available configurations and evaluate the sensitivity of the training phase. Before defining the final training and test sets, multiple preliminary attempts were conducted to identify an optimal dataset division. These attempts are not included herein, for the sake of conciseness and readability. Several rounds of dataset selection were performed by randomly sampling different training sets from the available data. The primary aim was to explore the full range of available configurations, ensuring that diverse scenarios were represented, and to assess the sensitivity of the models’ training phase to these variations. During this exploratory process, the models’ performance metrics were evaluated across various training and test splits, and it was observed that the training phase exhibited consistent behavior, regardless of the specific choice of training configurations. This indicated that the model was not significantly sensitive to the specific choice of the training set. As a result, the final training set was selected to cover the widest possible range of geometrical configurations within the dataset, without affecting the computational cost. This approach ensured that the training phase would comprehend representative scenarios, hopefully maximizing the model’s generalization capability and robustness. The input data are the (x, y, z) coordinates of the points (filled scatters in Figure 4) and the two geometrical parameters identifying the configurations ( and ), while the target data are the SED value for each of the considered points. The choice of the input features was based on the fact that the simultaneous variability of the geometrical parameters and of the simulated crack position (identified by its relative coordinates) could influence the local strain field and, therefore, the numerical simulations outcomes (e.g. the SED value). The training set spans in some cases with fixed tg and others with fixed tw, at the boundaries of the table of configurations. The aim is checking if the machine learning can, then, predict the safe or unsafe outcome for the remaining configurations in the bulk of the table. For XGBoost, the objective function of the regression model has been set to the squared error. The training phase has, then, been carried out by implementing the root mean squared error as evaluation metric for the training performances. The hyperparameters chosen for XGBoost were: (1) the number of estimators, (2) the learning rate and (3) the maximum tree depth. Concerning the learning rate, a value of 0.3 was chosen (it is commonly encountered in many XGBoost applications), while for the maximum tree depth and the number of estimators, a grid search approach was implemented and the Root Mean Squared Error (RMSE) was chosen as score. The maximum tree depth varied in the range [1, 10], while the number of estimators varied in the range [10, 200]. The best values for the hyperparameters were found to be max_depth = 3 and n_estimators = 30, although there was not a significant variation of the RMSE through the simulations. Once the optimal hyperparameters had been found, the goodness of the prediction capability of the model was evaluated through the coefficient of determination, R2, and the Mean Absolute Error, MAE. The best possible R2 score is 1.0, while MAE depends on the context of the problem and on the scale of the target variable. In the present case, the XGBoost model provided R2 = 0.999 and MAE = 0.006, which can be considered as good performance indicators.
For GPR, the chosen kernel function was a radial basis function (RBF), as it is the most widely used kernel due to its similarity to the Gaussian distribution. Due to the simplicity of the task, the only optimized hyperparameter was the number of restarts of the optimizer for finding the kernel’s parameters which maximize the log-marginal likelihood. The best value for the parameter was found to be n_restarts_optimizers = 9. The regressor machine has been asked to provide as output the mean predicted values and their standard deviation, in order to assess the variability and reliability of the predictions themselves. For this algorithm the model provided R2 = 0.996 and MAE = 0.002. It could be stated that XGBoost and GPR mainly showed overlapping performance after proper training.
Test of the algorithm.
The test phase has been carried out using all the other configurations that had not been used for the training phase, namely configurations n. 2, 4, 6, 8, from 11 to 18 and from 20 to 27. According to the training data, the test output data are the predictions of the SED values for the test configurations.
Implementation of SED criterion and evaluation of Separation Lines.
The SED values predicted for the test configurations were compared to the critical SED value in order to assess whether there is damage evolution or not, as explained in the previous Sections. At this point, it has been possible to draw the SLs between the predicted safe/unsafe areas and to compare them to the actual ones.
Plane-based sensitivity analysis.
All the previous steps have been carried out for one fixed z-plane within the 3D model (z = 8). In order to investigate if there is a particular behavior along the z direction, steps (1) to (3) have been repeated for another fixed z-plane (z = 2).
The main results are shown and discussed in the following Section.
4. Results and discussion
In this Section the main results obtained for the case study configurations and for the two different sets of boundary conditions and three different types of wood are presented and discussed. The attention is mainly focused on the results obtained for the Lime wood (indicated as W1) for the first set of boundary conditions (namely the strain along one direction, indicated as BC1) with the two chosen algorithms (XGBoost, indicated as A1, and GPR, indicated as A2); then, similar results obtained for the second set of boundary condition (namely, the strain along two different directions indicated as BC11) the other two types of wood (Spruce, indicated as W2, and Poplar, indicated as W3) will be shown for comparison. However, for the sake of conciseness, the results for W1 are reported in the main text while the results for W2 and W3 are reported in the Supplementary Information. All the different analyzed combinations are listed as follows and will be identified throughout the manuscript using the letters of the following list:
A1, BC1, z = 8;
A1, BC1, z = 2;
A1, BC11, z = 8;
A1, BC11, z = 2;
A2, BC1, z = 8;
A2, BC1, z = 2;
A2, BC11, z = 8;
A2, BC11, z = 2.
4.1 Results for lime wood
4.1.1 Results for A1, all BCs, planes z = 8 and z = 2
The XGBoost machine has been trained and tested according to steps (1) and (2) described in Section 3.2. The features used as the input data for training the XGBoost regression model have been evaluated in terms of their importance. In detail, the feature importance is computed through the F-score that is defined as the number of times a feature appears in a decision tree during the training phase: the higher the F-score, the higher the weight of the feature in the decision process.
Figure 5 shows the feature importance for A1 and the four considered combinations of boundary conditions and selected planes, namely cases (a) to (d) in the list defined before. It can be seen that, in all cases, the two most relevant features for the decision process of the implemented XGBoost model are and . This result is physically plausible as the crack position, regardless of the considered geometrical configuration, is the main driver of its possible evolution. As a matter of fact, the vicinity of the crack to the surface of the pictorial layer, rather than to the wooden support, may trigger different types of damage and crack evolution configurations (Bosco et al., 2021).
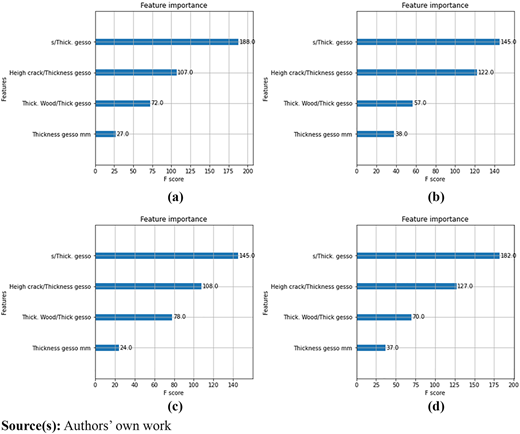
F-score for the four features used to train A1 in the four considered combinations of boundary conditions and selected planes, namely cases (a) to (d) defined in the list at the beginning of Section 4
F-score for the four features used to train A1 in the four considered combinations of boundary conditions and selected planes, namely cases (a) to (d) defined in the list at the beginning of Section 4
Analyzing Figure 5, it can be noticed that there is a slight variation in the F-score when varying both the selected plane and the set of boundary conditions but, still, the crack position is the most influencing feature. On the other hand, it can be highlighted that the gesso layer’s thickness was the least influencing feature but, being the input features already in a limited number, it was concluded to keep it anyway in the study. After the training phase, the A1 has been tested according to step (2). This means that the SED values for the test configurations have been predicted by the A1 and, then, they have been compared to the critical SED in order to apply the SED failure criterion described in Section 2, according to step (3). At this point, the new safe and unsafe areas (obtained based on the predicted SED values) can be depicted together with the new, predicted, Separation Lines.
However, for the sake of brevity and clarity, herein only the results for Configuration 11 are reported, while additional results are shown, for comparison and completeness, in Section S3 of the Supplementary Information. The choice is based on previous analyses, according to which Conf. 11 is one of those that better shows the effect that the choice of different BCs and planes have on the algorithms’ sensitivity. Results are shown in Figure 6 for the cases (a), (b), (c) and (d), respectively, as described in the list at the beginning of Section 4.
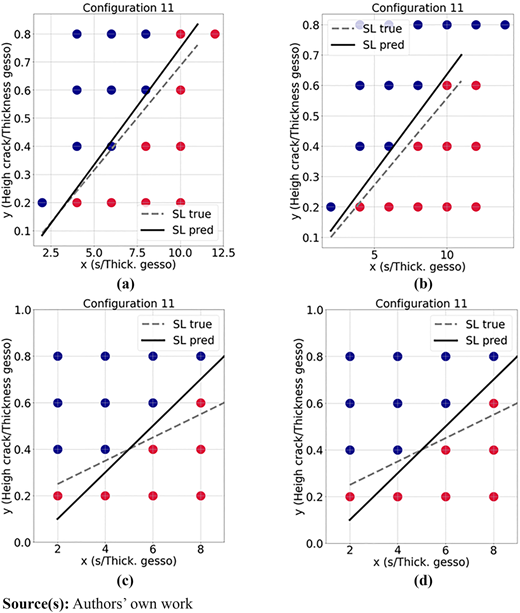
True (grey dashed) and predicted (black continuous) Separation Lines for Configuration 11 of the Lime wood model subjected to cases (a) to (d) (defined in the list at the beginning of Section 4) and corresponding to subplots (a) to (d), respectively
True (grey dashed) and predicted (black continuous) Separation Lines for Configuration 11 of the Lime wood model subjected to cases (a) to (d) (defined in the list at the beginning of Section 4) and corresponding to subplots (a) to (d), respectively
In Figure 6, the predicted SLs are represented through black solid lines, while the true SLs (the ones obtained by FEM showed in Figure 4, as example) are shown with grey dashed lines. Analyzing the Figure, it can be noticed that, varying both the boundary conditions and the selected plane in the 3D model, the predicted SLs differ from the true ones only slightly, thus highlighting that the algorithm’s prediction sensitivity is barely affected by the different conditions’ variability.
4.1.2 Results for A2, all BCs and planes z = 8 and z = 2
The GPR machine has been trained and tested according to steps (1) and (2) described in Section 3.2.
As said, GPR algorithms provide a stochastic solution; in particular, once trained, the GPR algorithm provides the mean value and the standard deviation of all the possible predicted values. The results of the training and test phases are reported in the following for the points considered within each test configuration. Such points are the same showed previously (Figure 6) but, in these cases, for the sake of graphical clarity, they have been identified with unique increasing integers, as schematized in Figure 7, by way of example. If a given plane is constituted by m points (black dots), the point that is in the lower left corner is the point 1. Going rightward, and then upward (as indicated by the blue arrows), the numbering increases, as represented by red numbers and letters in Figure 7.
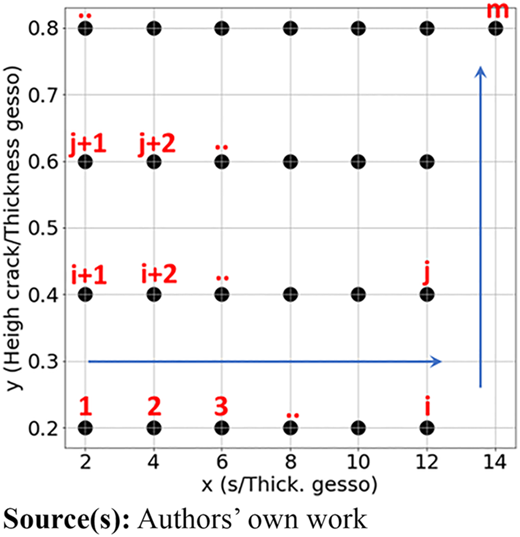
Schematization of the numbering (red) given to the points representing the different crack configurations
Schematization of the numbering (red) given to the points representing the different crack configurations
The red numbers in Figure 7 are, then, reported on the x-axis of Figure 8, which depicts cases (e), (f), (g) and (h) (list at the beginning of Section 4) within the subplots (a), (b), (c) and (d), respectively. Each of the figures shows the actual value of the Averaged SED (ASED), namely the one to be predicted − blue dots, together with the mean (green empty dots) and the standard deviation (green error bars) of the Gaussian distribution of the ASED predictions provided by the GPR machine. It can be highlighted that the mean of the ASED predicted values distribution well-follows the actual ones while some considerations should be done on the standard deviations. First, Figure 8c generally showed higher standard deviations, if compared to Figure 8a. Those two subplots (Figure 8c) are related to the cases (g) and (h) listed at the beginning of Section 4, which refer to the evaluations carried out on data coming from the FEM simulations characterized by the BC11 (namely, boundary condition of 1% strain along x and y applied at the same time). The less accurate performance of GPR, namely the higher standard deviations, could be due to the slightly more complex relationship between input and target data, being the original boundary conditions more complicated. In addition, Figure 8d refers to results for a different plane, thus underlining, for that particular case, a dependency on that aspect as well. Comparing Figure 8 with its analogous, Figure 6, it can be noticed that both the used algorithms provided similar results, namely good predictions of the ASED, which brought, on one hand, to a limited standard deviation and, on the other hand, to overlapping true and predicted SLs. It is worth noting that the variation of both the considered z-plane and boundary conditions barely affected the algorithms prediction sensitivity. However, case (h) (Figure 8d) and its analogous, case (d) (Figure 6d), seemed the ones in which the two algorithms were slightly less performing. As a matter of fact, on one hand, the SLs in Figure 6d were not perfectly overlapping and, on the other hand, in Figure 8d, the standard deviations are sensibly higher than the other cases.
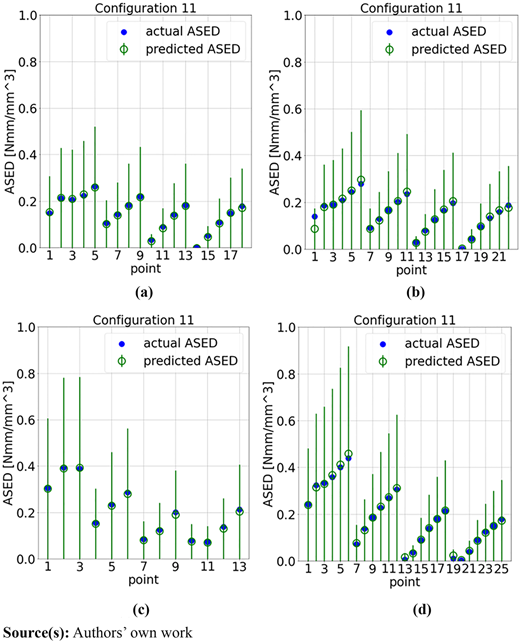
Mean value (green empty dot) and standard deviation (green vertical line) for the ASED predicted by the A2, and actual value of the ASED (blue filled dots) for Configuration 11 of the Lime wood model subjected to the cases (e) to (h) as indicated in the list at the beginning of Section 4 and corresponding to subplots (a) to (d), respectively
Mean value (green empty dot) and standard deviation (green vertical line) for the ASED predicted by the A2, and actual value of the ASED (blue filled dots) for Configuration 11 of the Lime wood model subjected to the cases (e) to (h) as indicated in the list at the beginning of Section 4 and corresponding to subplots (a) to (d), respectively
Finally, the maximum and minimum percentages of “unsafe” conditions for every wood type and boundary conditions’ set. It has revealed that both poplar and spruce wood panel paintings are less sensitive to the geometrical parameters and to the boundary conditions, while lime wood panel paintings are quite affected by them. As a matter of fact, the percentage of “unsafe” points for poplar is confined between 48% and 54%, while for spruce wood it is confined between 41% and 50%. Concerning lime wood, instead, such percentage is confined between 40% and 84%. From such evaluations it can be highlighted that panel paintings made of lime wood need more care and attention for a proper and durable conservation. This means that, for example, boundary conditions (e.g. microclimatic conditions, in this case), need to be carefully controlled for avoiding, or at least limiting, the occurrence of cracks.
5. Conclusions
This study proposed a strain-energy-based machine learning approach for predicting the evolution of cracks induced in wooden panel paintings by variable environmental conditions. After having created an elementary simplified 3D finite element model for a wooden panel painting, a penny-shaped crack within the gesso layer was modelled and the SED failure criterion was used to assess if the crack was in a critical state, after applying given boundary conditions. This was carried out by modelling three different kinds of wood − lime, spruce and poplar (the last two shown in the Supplementary Information) − and two different sets of boundary conditions. In addition, the geometrical model was parameterized and, therefore, several combinations of the geometric parameters were simulated. However, to limit the FE analyses computational cost, two machine learning approaches were used: XGBoost and GPR. The results coming from some of the geometrical configurations were used to train the algorithms, while the remaining ones were used to test the prediction capabilities of the algorithms themselves. The obtained outcomes showed that both algorithms were capable of predicting the values of SED for the different configurations, highlighting slight differences among the combination of boundary conditions and wood types. In particular, it was found out that the algorithms performances were actually influenced by the type of wood. For example, if a type of wood could potentially show higher deformations and could, therefore, be characterized by different levels of SED, this could lead to, possibly, more highly scattered results from the FE simulations, thus affecting the prediction capability of the ML algorithms. Finally, the obtained insights may potentially diminish the dependence on expensive numerical simulations, while providing novel and smart perspectives on the fracture mechanics and preservation of wooden artworks. The practical aspect which arose from the carried-out investigation is that panel paintings made of Lime wood are the most sensitive to the variability of both the geometrical parameters and the boundary (i.e. environmental) conditions. In addition, it has to be underlined that only simplified boundary conditions were applied so far. Indeed, real-world conditions are far more complex than those analyzed in the present study. First, in actual environments, humidity changes are rarely constant or linear; they follow diurnal, seasonal and yearly cycles that vary in magnitude and rate; therefore, those fluctuations could affect the rate of moisture absorption/desorption in the wood and gesso, altering the stress fields and crack propagation patterns. Moreover, cycles of humidity fluctuations, repeated over time, can lead to material fatigue, even in presence of stress levels below the initial failure threshold. This means that the neglection of the cumulative damage induced by fatigue might underestimate the likelihood of long-term cracking (Califano et al., 2024). Introducing the fatigue models and approaches into the simulations could undoubtedly path the way in assessing the long-term durability of the considered case studies. In that sense, the ML algorithms would be of enormous help for the predictions of unseen and unknown scenarios, especially taking into account the fact that fatigue phenomena usually have extremely long time-scales. The above aspects will surely be deepened in near future evaluations, as natural continuation of the present preliminary work, whose aim was starting to investigate such topics which are still scarcely studied in literature.
The research leading to these results has received funding from the Norwegian Financial Mechanism 2014–2021 (EEA and Norway Grant), project registration number 2019/34/H/HS2/00581.
Competing interests: The authors declare no competing interests.
References
The supplementary material for this article can be found online.

