

Automation of the fatigue design under variable amplitude loading using the ViDa software
Article Type: Technical paper From: International Journal of Structural Integrity, Volume 1, Issue 1
Visual Damagemeter is a powerful software that has been developed and qualified to automate all traditional design methods used to locally calculate the fatigue damage caused by variable amplitude loading: SN, International Institute of Welding (for welded structures) and εN to predict crack initiation, and da/dN to model plane and surface crack propagation, considering load sequence effects.
Introduction
Structural components are traditionally designed against fatigue crack initiation either by the stress-based SN or the strain-based εNmethods. Welded structures are designed by SN procedures normalized by institutions such as the International Institute of Welding (IIW), the Det Norske Veritas or the American Welding Society. The da/dNmethod used to design against fatigue crack propagation is based on fracture mechanics concepts. All these methods are local, as their damage functions depend only on the stress, the strain, or the stress intensity history which loads the critical point of the structure, not on the structure global stress/strain field.
ViDa (meaning life in Portuguese but also standing for Visual Damagemeter, a Windows-based software with an intuitive and friendly graphical interface,Figure 1) is an efficient, powerful and versatile program developed to automate the fatigue damage calculations by all those local methods. It has been designed by and for structural engineers to be completely controllable by the user, and that means it even has an equation interpreter to be expanded at his/her will(Miranda et al., 2002, 2003a, b; www.tecgraf.puc-rio.br/vida).

ViDa is particularly useful to deal with variable amplitude (VA) loads considering sequence or load history effects both in the initiation and in the propagation of 1D through-the-thickness or 2D surface or internal fatigue cracks. It also includes all the information needed to apply the various fatigue damage models. Of particular academic interest are the innovations that had to be developed and implemented in the several fatigue design methods and computation routines to guarantee the reliability and to increase the speed of the calculations, such as:
an ordered rain-flow counting algorithm which includes a load amplitude filter;
a routine to account for the elastic-plastic overload effects in the SN method;
several important corrections in the traditional εNmethodology, to guarantee the prediction of physically acceptable elastic-plastic hysteresis loops at a notch root;
numerically efficient and reliable through-the-thickness and surface crack propagation models which consider load sequence effects such as delays and arrest after overloads;
extensive and resourceful databases for material properties, stress concentration factors, crack propagation rules, and stress intensity factors,etc. which include a versatile equation interpreter for new equations provided by the user;
importing and automatic fitting of experimental data;
intuitive and friendly graphical information in several idioms, using traditional notations, to eliminate any programming from the design process,including a complete manual and help file; and
a huge and expansible materials database (Figure 2), with mechanical properties of over 13,000 materials.
The fundamentals of the methods used to calculate fatigue damage caused by VA loading and their numerical implementation in these automation tools are briefly discussed next.

The SN method
The SN or Wöhler method is used to predict the fatigue life in number of cycles N to initiate a crack in any structure. It assumes this life can be correlated with the life of small specimens that should have the same fatigue strength (hence, the same material and local details), and ideally be submitted to the same service stress history that loads the critical point of the structure, generally a notch root. The SN method should only be used to model very long crack initiation lives, but this is the case in most design problems. However, in these cases the fatigue strength can indeed be much influenced by the critical point details that can help or hinder the fatigue crack initiation and/or early propagation, such as surface finish, stress gradient, micro residual stress, and local material properties, which must be considered in the damage calculations.
The SN design routine can be divided in three steps to:
- 1.
evaluate the fatigue strength of the critical point;
- 2.
calculate the stress history induced in the critical point by the real loading; and
- 3.
quantify the accumulated fatigue damage caused by the various loading events.
The fatigue strength of the critical point is characterized by an SN (a Wöhler or a Gassner) curve and by a fatigue limit SL(NL),if it exists (NL is the number of cycles associated to SL). The most used equation for the SN curve is parabolic:

For calculation purposes, the fatigue strength information, including all above discussed effects, is contained in any three of the four numbers B, C, SL, and NL. Reliability concepts can be applied to fatigue limits and SN curves, which can be plotted at 50 percent or at any other confidence level.
Since fatigue crack initiation involves microscopic dislocation movement even when the macroscopic stresses are elastic, it is the Tresca or the Mises component of the stress state acting at the critical point that must be used in the calculations. These equivalent stresses can be automatically calculated by the software from 3D stress state information or from rosette measurements. Owing to their sharp stress gradients, small radius notches have a lower than Kt effect in long life fatigue, quantified by the fatigue stress concentration factor Kf=1+q(Kt−1),where q is the notch sensitivity factor, calculated by ViDa for several alloy families.
Tensile mean stress effects are quantified by a σaσmrule, e.g. Goodman, Gerber or Soderberg, or by a more general elliptical rule:for σm≥0:

Compressive mean loads σm<0 are beneficial to the fatigue strength and can be modeled by a variation of the elliptical rule, but it is usual to choose instead just a modified Goodman rule for this purpose:

where α≥0. If α=0, the beneficial effect of compressive mean loads for is ignored, but it is considered by fitting reliable experimental data using 0<α≤1.
The treatment of VA loads, with amplitude that in general can randomly vary in time, requires a damage accumulation rule. VA load events are accounted for by the rain-flow (or by the sequential rain-flow) algorithm. Despite its many shortcomings, most fatigue designers still prefer the linear damage accumulation(or the Palmgren-Miner’s) rule, D=ΣDi,and predict failure (defined by the generation of a small crack in the SN method) when ΣDi=β, where βcan be specified by the user, with β=1 being the most used value.
In ViDa, it is also possible to modify the traditional SN methodology to consider plasticity-induced effects. This simple idea (but not that easy to be computationally implemented), is summarized as follows. First, the initial residual stress state must be known at the critical point. Residual stresses act as mean loads, thus must be added to each mean stress component. The VA load must be counted by the sequential rain-flow method, from the first load event. Every load peak must be compared to the (cyclic) yield strength. If there is yielding at the notch root, the software changes from the SN to the sequential εN method, to calculate not only the damage but also the change in the residual stress state induced by that load event. The sequential εNmethod keeps track of the correct hysteresis loops at the notch root, as discussed below. Then the software can turn back to the SN method, bringing the new residual stress value to continue the damage calculations as before. The main advantage of this hybrid method is its computational efficiency, as the SN equations are much simpler to solve than the εN equations.
Fatigue design of welded structures
The fatigue design of welded structures is a particularly simple subset of the SN method. It differs from the procedures explained above because it is based on tests performed in full-scale structures, not in small specimens. Small welded specimens are not appropriate due to the very high-residual stresses normally present in a weld fillet, and due to the geometric characteristics of the fillets. The design methodology is normalized by welding organizations, such as the IIW. It is based on only two simple premises, which assume that the fatigue strength of a welded structural component (executed according to industrial quality control standards in C or C-Mn structural steel with SU≤700 MPa) just depends on:
- 1.
the geometry or the type of the welding detail, which is classified in several classes by the different organizations (such as those in Figure 3, which presents a few IIW details); and
- 2.
the range of the nominal stress Δσ.
The several welding details are divided into classes of same fatigue strength. Since the fatigue tests are made with full-scale components, the SN curves already include stress concentration, surface finish and residual stress effects. The automation of this methodology is a simple task. For example, in the IIW procedures, the fatigue strength of a welding detail is specified by its SN curve, given by NΔσB = C(where B=3 or 3.5), and by its fatigue limit ΔσLassumed to be associated with a life NL=5×10⁶cycles (which in fact is the only independent information). The range of each load event Δσi must be counted by the rain-flow method following the procedures already discussed in the SN method. The user can choose the standard reliability of 97.7 percent adopted by the IIW,or any other proper value.

The εN method
The εN method recognizes macroscopic elastic-plastic load events at the notch roots, using the local strain range instead of the stress range to quantify them. This is a modern design method, corroborated by traditional institutions, but it has certain relatively little known idiosyncrasies. Particularly when dealing with VA loads, it is not possible to predict physically acceptable strain ranges at the critical point without recognizing the load order. Since plasticity generates memory, sequence effects must be accounted for when accurately modeling elastic-plastic hysteresis loops.
In reality, precise fatigue life predictions require an accurate description of the stress-strain history at the critical point. In practice, such predictions can only be made with the aid of appropriate automation software,since the numerical effort to sequentially solve the εN equations is quite heavy. Moreover, as the loop predictions are not trivial, the software must have powerful graphical tools, to allow for the visual checking of the calculated hysteresis loops.
The εN method uses real (logarithmic) stresses and strains to model the ΔσΔε loops by a Ramberg-Osgood(RO) relation, considering the cyclic softening or hardening of the material,but not its transient behavior from the monotonic σε curve. Neuber, linear or Moslky-Glinka rules can be used to correlate the nominal stress Δσn and strain Δεnranges with the stress Δσ and strain Δεranges they induce at a notch root. The relation between the strain range Δεat the critical point and the fatigue crack initiation life N can be described by Coffin-Manson (CM), Smith-Watson-Topper’s, Morrow elastic or Morrow elastic-plastic damage rules. For example, describing the nominal stress/strain loops by RO (instead of considering them as hookean, a regrettably common logical mistake) and using Neuber and CM, a nominal stress event Δσniinduces a damage Di obtained by solving:
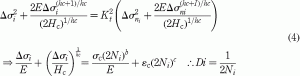
However, to properly consider mean load effects, the loading order must be preserved, as plasticity induces memory. Thus, to guarantee the quality of the predictions,the software calculates the hysteresis loops at the critical point before any rain-flow counting is performed, to preserve the loading order. The rain-flow counting is only applied to the notch root strains after they are predicted from the hysteresis loops using the original loading order.
These loops under VA loading can be quite challenging to reproduce numerically. Indeed, to properly calculate the loops several corrective routines had to be introduced in ViDa, to avoid physically inadmissible and non-conservative predictions. As shown in Figure 4, which compares predicted and experimental loops measured in American Petroleum Institute S-135 steel under VA load, only after applying all the required corrections it is possible to correctly predict the loops observed in experiments.

Figure 4 Predicted and experimentally measured stabilized loops generated under VA loading
Figure 4 Predicted and experimentally measured stabilized loops generated under VA loading
The da/dN method
The modeling and automation by the local approach of the linear-elastic fracture mechanics mode I fatigue crack propagation under VA loading are discussed below, considering load sequence effects, such as overload-induced crack retardation or arrest. Only mode I is discussed in this brief overview,since fatigue cracks tend to propagate perpendicular to the maximum tensile stress. However, mixed mode fatigue crack propagation problems can be also dealt with, as described elsewhere (Miranda et al., 2002, 2003a, b; www.tecgraf.puc-rio.br/vida).
The local approach is so-called because it does not require the global solution of the structure’s stress field, since it is based on the direct integration of the fatigue crack propagation rule of the material, da/dN=F(ΔK, R, ΔKth, KC), where ΔKis the stress intensity range, R=Kmin/Kmaxis a measure of the mean load, ΔKth is the fatigue crack propagation threshold, and KC is the structure toughness. An appropriate stress intensity factor expression for ΔKand a good da/dN rule must be used to obtain satisfactory predictions. Therefore, neither the ΔK expression nor the type of crack propagation rule should have their accuracy compromised when using this approach. Figure 5 shows one of the windows used to calculate crack growth in the software. Both the ΔKrms and the cycle-by-cycle methods can be used to calculate crack growth under VA loading, but only the last considers sequence effects. A variation of the Simpson’s algorithm can be used for numerical integration using the ΔKrmsmethod, with user-defined precision.

The cycle-by-cycle method allows the user to consider overload effects, which can have a very significant effect on the prediction of fatigue crack growth. To accomplish that, the software allows the user to perform a sequential rain-flow counting, to consider the effect of each large loading event when it happens,and not before its occurrence, as in the traditional rain-flow method. The main advantage of the sequential rain-flow counting algorithm is to avoid the premature calculation of the overload effects, which can cause non-conservative crack propagation life predictions.
Neglecting overload effects in fatigue life calculations can completely invalidate the predictions. In fact, only after considering overload induced retardation effects can the life reached by real structural components be justified when modeling many practical problems. The program includes several overload models such as Wheeler, modified Wheeler, Willenborg and its variations, Constant closure, among many others, and even allows the user to include his own models.
An experimental program was conducted to evaluate ViDa’s crack propagation predictions. In one experiment (Miranda et al., 2003a), two specimens were tested under VA loading: a regular compact-tension specimen (CTS)and a holed CTS. The goal of this experiment was to verify if load interaction models calibrated for straight cracks (such as those in the regular CTS) could be used to predict the fatigue life of the holed specimen, which presents a curved crack path. The curved crack path was predicted within a few percentage using a finite element program named Quebra2D. Figure 6 shows the measured crack sizes under VA loading on a standard compact tension (CT) and on the holed specimen. Several overload models were used in this analysis to consider crack retardation effects due to tensile overloads. In this experiment, the standard CT was first tested under VA loading, and then the overload models were calibrated using ViDa. Finally, the curved crack growth in the holed specimen was predicted (not fitted) using the overload parameters obtained for straight cracks, with a very good match (Figure 6).

These results suggest that the load interaction models calibrated using straight cracks can be used to predict the crack retardation (or acceleration)behavior of generally curved cracks. They also validate the algorithms used in ViDa to calculate crack growth including load interaction effects. Note that any crack propagation rule, stress intensity factor expression or table, and any overload effect equation can be typed in or imported into the software, to be used in the calculations.
The software also deals with surface, corner or internal cracks, which propagate in 2D, including overload effects. The main characteristic of these cracks is a non-homologous fatigue propagation: in general, the crack shape tends to change from cycle to cycle, because ΔK varies from point to point along the crack front. For a few geometries, the program is also able to calculate the transition from a surface to a through crack.
Conclusions
This paper deals with the fatigue design automation problem. Since fatigue crack generation depends primarily on the range of the local stress or strain acting on the critical point of the structure, and cracks larger than a few grain sizes have their fatigue propagation rate controlled primarily by the mode I stress intensity range, the fatigue design problem can in many cases be treated by local methods. A general purpose fatigue design software was very briefly presented. This software has been developed to predict both initiation and propagation fatigue lives under VA loading by all classical design methods:SN, IIW (for welded structures) and εN to predict crack initiation, and da/dN for studying plane and 2D crack propagation, considering load sequence effects. The software has been numerically and experimentally tested, incorporating all the requirements that design automation tools must have to generate correct fatigue life predictions under VA loadings. Finally, it is worth mentioning that all the described and many other ViDa’s features can be explored in its homepage (www.tecgraf.puc-rio.br/vida).
Marco Antonio Meggiolaro and Jaime Tupiassú Pinho de CastroMechanical Engineering Department, Pontifical Catholic University of Rio de Janeiro, Rio de Janeiro, Brazil

