One popular method to assess discriminant validity in structural equation modeling is the heterotrait-monotrait ratio of correlations (HTMT). However, the HTMT assumes tau-equivalent measurement models, which are unlikely to hold for most empirical studies. To relax this assumption, the authors modify the original HTMT and introduce a new consistent measure for congeneric measurement models: the HTMT2.
The HTMT2 is designed in analogy to the HTMT but relies on the geometric mean instead of the arithmetic mean. A Monte Carlo simulation compares the performance of the HTMT and the HTMT2. In the simulation, several design factors are varied such as loading patterns, sample sizes and inter-construct correlations in order to compare the estimation bias of the two criteria.
The HTMT2 provides less biased estimations of the correlations among the latent variables compared to the HTMT, in particular if indicators loading patterns are heterogeneous. Consequently, the HTMT2 should be preferred over the HTMT to assess discriminant validity in case of congeneric measurement models.
However, the HTMT2 can only be determined if all correlations between involved observable variables are positive.
This paper introduces the HTMT2 as an improved version of the traditional HTMT. Compared to other approaches assessing discriminant validity, the HTMT2 provides two advantages: (1) the ease of its computation, since HTMT2 is only based on the indicator correlations, and (2) the relaxed assumption of tau-equivalence. The authors highly recommend the HTMT2 criterion over the traditional HTMT for assessing discriminant validity in empirical studies.
Introduction
The assessment of discriminant validity is of particular importance for the empirical study of relationships between theoretical concepts (Bagozzi and Phillips, 1982; Henseler et al., 2015; Hair et al., 2017; Voorhees et al., 2016; Franke and Sarstedt, 2019; Rönkkö and Cho, 2020; Henseler, 2021). For the operationalization of these theoretical concepts it is vital that the employed measurement models actually measure what they are supposed to measure (Campbell and Fiske, 1959), thus establishing construct validity (Peter and Churchill, 1986). Construct validity comprises different forms, including discriminant validity (Netemeyer et al., 2003). Discriminant validity in turn is defined as “the degree to which two measures designed to measure similar, but conceptually different, constructs are related. A low to moderate correlation is often considered evidence of discriminant validity” (Netemeyer et al., 2003, p. 13).
The methodological literature provides different approaches to assess discriminant validity. Among others, the constrained phi approach (Jöreskog, 1971), the Fornell–Larcker criterion (Fornell and Larcker, 1981) and the comparison of cross-loadings (Chin, 1998) have been suggested to assess discriminant validity. Recently, Henseler et al. (2015) suggested the heterotrait–monotrait ratio of correlations (HTMT) to assess discriminant validity. Due to its good performance and straightforward application, the HTMT has found widespread application and dissemination, making Henseler et al. (2015) one of the most frequently cited papers in business research. Although the HTMT was originally proposed for models estimated by partial least squares path modeling (Wold, 1982), it also finds its application in structural equation modeling (Voorhees et al., 2016). To assess discriminant validity using the HTMT, two strategies have been proposed: (1) comparison of the HTMT to predetermined thresholds and (2) constructing confidence intervals for the HTMT. Considering the former, heuristic rules are applied for the HTMT. For instance, the HTMT is compared to 0.85 to judge whether discriminant validity is violated (Henseler et al., 2015). Following the latter, statistical inference is made by means of bootstrap confidence intervals, i.e. it is investigated whether the correlation between two latent variables is significantly different from 1. This approach has been very effective in detecting discriminant validity issues (Henseler et al., 2015; Franke and Sarstedt, 2019).
In comparison to other approaches, the HTMT's main advantage is that it is relatively easy to calculate. For its computation, only the indicator correlation matrix is required (Henseler et al., 2015). Consequently, the HTMT is not affected by the employed estimator and can be computed without estimating a model in advance. Despite this important advantage, a conceptual issue emerges since the HTMT assumes tau-equivalence (Henseler et al., 2015; Rönkkö and Cho, 2020) and thus is likely to be biased in empirical cases, in which this assumption rarely holds (e.g. McNeish, 2018).
In order to relax the assumption of tau-equivalence and to offer a superior method to assess discriminant validity in the case of congeneric measurement models (i.e. with heterogeneous loading patterns), we develop a modification of the HTMT criterion, which we call HTMT2. Specifically, we compose a new formula for the HTMT2 criterion by replacing the arithmetic means applied in the HTMT's computation by geometric means. In doing so, we show that the HTMT2 is a consistent estimator for the inter-construct correlation in the case of congeneric measurement models. Therefore, the HTMT2 is highly recommendable to be used in empirical studies, if the involved correlations among observable variables are positive. To evaluate the HTMT2's finite sample behavior, we conduct a computational experiment in form of a Monte Carlo simulation that identifies the conditions, under which the HTMT2 outperforms the traditional HTMT.
The structure of this paper largely follows the suggestion by Gregor and Hevner (2013). In the next section, we outline the composition of the traditional HTMT criterion supported by a theoretical and a numerical example to pave the way for the introduction of the new criterion HTMT2. We show that the HTMT2 is a consistent estimator for the inter-construct correlation in the case of congeneric measurement models. Thereafter, we conduct a simulation study to compare the performance of the HTMT to the HTMT2. Our simulation study shows that the HTMT2 outperforms the traditional HTMT approach in several situations. We discuss the results and conclude with avenues for future research.
The traditional HTMT
The HTMT was introduced by Henseler et al. (2015) as an estimator for the correlation between two latent variables. It is based on the multitrait-multimethod (MTMM) matrix, in which correlations are compared to assess discriminant validity (Campbell and Fiske, 1959). For a deeper understanding of discriminant validity assessment using the HTMT, we provide a theoretical and a numerical example.
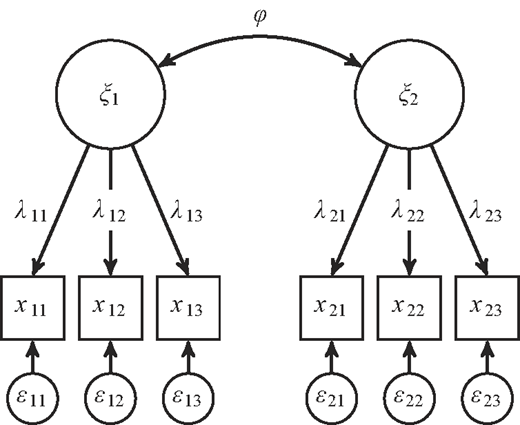
For the theoretical example, we consider a simple model with two correlated constructs ξ1 and ξ2 (see Figure 1). The inter-construct correlation is denoted by ϕ. Each construct is measured by three indicators; ξ1 is measured by x11 to x13, and ξ2 is measured by x21 to x23, where λ11 to λ13 as well as λ21 to λ23 represent the respective loadings. The random measurement errors are referred to as ɛ11 to ɛ13 and ɛ21 to ɛ23.
For the construction of the MTMM matrix and the HTMT, only the correlations among the indicators are required. Two types of correlations should be distinguished: monotrait-heteromethod correlations and heterotrait-heteromethod correlations (Campbell and Fiske, 1959). The former include the indicator correlations within one and the same construct. For ξ1 this would be the correlations between the indicators x11, x12 and x13. The latter refer to the correlations between the indicators of two different constructs (Campbell and Fiske, 1959; Henseler et al., 2015). In our example, the correlations between the indicators of ξ1 (x11, x12, and x13) and the indicators of ξ2 (x21, x22, and x23) are the heterotrait-heteromethod correlations.
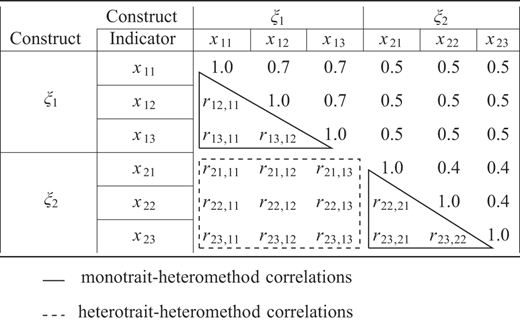
Figure 2 shows the full MTMM matrix for the model depicted in Figure 1; its elements are the indicator correlations r. For our theoretical example, the correlations among the indicators x11 to x23 can be found in the lower triangle of the matrix. The monotrait-heteromethod correlations are framed by a solid line, whereas the heterotrait-heteromethod correlations are framed by a dashed line. Regarding the MTMM matrix, monotrait-heteromethod correlations should be larger than the heterotrait-heteromethod correlations to ensure that constructs can be discriminated in a model (Campbell and Fiske, 1959).
Henseler et al. (2015) picked up this idea and translated it into a ratio of correlations. Specifically, the HTMT is the ratio of the arithmetic mean of the heterotrait–heteromethod correlations rig,jh and the geometric mean of the arithmetic means of the monotrait-heteromethod correlations rig,ih and rjg,jh. In general, the HTMT can be calculated as follows:
where Ki and Kj denote the number of indicators belonging to construct ξi and ξj, respectively.
To establish discriminant validity, the HTMT value should be different from 1 because the HTMT is an estimator for the inter-construct correlation; if the correlation between two constructs is 1, they cannot be discriminated properly (Henseler et al., 2015). For this judgment, the proposition was to compare the HTMT to a pre-defined threshold value (Henseler et al., 2015; Voorhees et al., 2016; Franke and Sarstedt, 2019). Recommended threshold values range from 0.85, which is considered a conservative benchmark (Henseler et al., 2015; Voorhees et al., 2016), to a more liberal cut-off value of 0.9 (Henseler et al., 2015; Franke and Sarstedt, 2019) or higher. The choice of the threshold level should, however, be made against the background of how conservative the researcher wants to be in assessing discriminant validity and how confident (s)he is regarding the uniqueness of the constructs (Henseler et al., 2015; Franke and Sarstedt, 2019).
In addition, the HTMT can be exposed to statistical inference. Specifically, Henseler et al. (2015) and Franke and Sarstedt (2019) suggested to investigate whether the upper bound of the 90% bootstrap confidence interval is larger than 1 warranting a type I error rate of 5%. If the value of 1, i.e. the two constructs are perfectly correlated, is larger than the upper bound of the bootstrap confidence interval, it can be concluded that the construct correlation is significantly smaller than 1 (Henseler et al., 2015; Franke and Sarstedt, 2019). Whereas Henseler et al. (2015) found that statistical inference about the HTMT is the most liberal way of assessing discriminant validity, Franke and Sarstedt (2019, p. 441) clearly advocate that “researchers should prefer inferential tests over simple cutoff values.”
To further illustrate the logic of the HTMT criterion, we use a numerical example based on the correlations in the upper triangle of the MTMM matrix in Figure 2. The mean value of the heterotrait–heteromethod correlations is 0.5, whereas the geometric mean of the mean monotrait–heteromethod correlations (0.7 and 0.4) equals 0.5291. Taken together, the HTMT is computed as follows:
Applying heuristic rules for the HTMT, the value of 0.945 in Equation (2) is then compared to a threshold value, e.g. 0.85 for more conservative and 0.90 for more liberal assessments. The HTMT value of 0.945 clearly exceeds even the more liberal HTMT level of 0.90. Hence, based on the heuristic rules, the HTMT value above the two threshold values indicates a lack of discriminant validity.
Moreover, we construct a 90% bootstrap confidence interval around the HTMT based on 999 bootstrap runs (Henseler et al., 2015; Franke and Sarstedt, 2019) using the percentile bootstrap approach (Aguirre-Urreta and Rönkkö, 2018). The upper bound of the 90% percentile bootstrap confidence interval is 0.9899. Consequently, the value of 1 is not covered by the confidence interval showing that the HTMT value of 0.945 is significantly different from 1.
Recent studies have demonstrated a good performance of the HTMT (Henseler et al., 2015; Voorhees et al., 2016; Franke and Sarstedt, 2019). Another major advantage of the criterion is that its computation is hardly demanding, because only the indicators' correlation matrix is required as input for simple calculations (Henseler et al., 2015; Voorhees et al., 2016). In contrast to other approaches, no model estimates are required for its computation (Franke and Sarstedt, 2019). Consequently, it does not suffer from Heywood cases–a phenomenon not untypical for factor analysis (see Krijnen et al., 1998). Hence, it is an easily applicable method to assess discriminant validity independent of the employed estimator (Voorhees et al., 2016; Franke and Sarstedt, 2019).
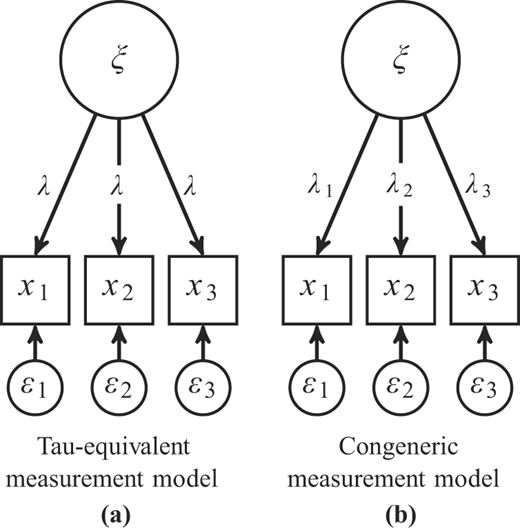
Noteworthily, the HTMT does not come without disadvantages. Specifically, the HTMT makes the rather rigid assumption of tau-equivalent measurement models (Henseler et al., 2015; Rönkkö and Cho, 2020). To illustrate this, Figure 3 depicts two different types of measurement models: Figure 3a represents a tau-equivalent measurement model, which assumes that all loadings (λ) are equal, i.e. all covariances among the indicators are equal (Lord and Novick, 1968). In contrast, Figure 3b shows a congeneric measurement model, in which this assumption is relaxed and indicator loadings (λ1, λ2 and λ3) can vary (Jöreskog, 1971).
Transferred to our example in Figure 1, the HTMT assumes that all indicator loadings of one construct are equal, i.e. λ11 = λ12 = λ13 and λ21 = λ22 = λ23. This assumption, however, is unlikely to hold in most empirical research settings. As McNeish (2018, p. 414) puts it: “Tau equivalence tends to be unlikely for most scales that are used in empirical research–some items strongly relate to the construct while some are more weakly related.” Relaxing the assumption of tau-equivalence and assessing discriminant validity in the case of congeneric measurement models, in which indicator loadings may differ from each other (i.e. λ11 ≠ λ12 ≠ λ13 and λ21 ≠ λ22 ≠ λ23), requires a revision of the traditional HTMT.
The HTMT2
We propose a new version of the HTMT, which we name HTMT2–an idea initially sketched by Henseler (2021). The purpose of the HTMT2 is to relax the HTMT's assumption of tau-equivalence and thus to allow for assessing discriminant validity in the context of congeneric measurement models. In doing so, HTMT's principle of comparing heterotrait–heteromethod correlations to monotrait–heteromethod correlations in the MTMM matrix remains untouched. Hence, like the HTMT, the HTMT2 is based on correlations as a measure of linear dependency among variables. In contrast to the HTMT, for the calculation of the HTMT2, the geometric mean instead of the arithmetic mean is used for calculating the average indicator correlation. The use of the geometric mean is inspired by the fact that the variance-covariance matrix implied by reflective measurement models is based on products of loadings, i.e. the loadings are linked in multiplicative and not an additive way. Against this background, the use of the geometric mean appears more suitable. Moreover, as we will show in this section, the use of the geometric mean draws the HTMT2 into a consistent estimator for the inter-construct correlation in the case of congeneric measurement models.
The HTMT2 is given by Equation (3).
In the numerator of Equation (3), the geometric mean of the heterotrait–heteromethod correlations is calculated, while the denominator is composed of the geometric means of the two geometric means of the monotrait–heteromethod correlations. In contrast to the arithmetic mean, the geometric mean is only defined for strictly positive values. For the HTMT2, this means that all indicator correlations used for calculating the HTMT2 must be greater than zero. This requirement is also known from the calculation of Cronbach's alpha which also requires that all indicators are positively correlated (Sijtsma, 2009).
Subsequently, we show that the HTMT2 is a consistent estimator for the inter-construct correlation ϕ. Let xi1 to be the Ki indicators of constructs ξi and xj1 to the KJ indicators of construct ξj. The empirical correlation matrix S of the indicators is generally given as follows:
Furthermore, we assume that the empirical correlation matrix S is a consistent estimate of Σ, i.e. plim S = Σ, where plim is the probability limit, and Σ is the correlation matrix implied by the reflective measurement models:
where λik denotes the factor loading of indicator xi k on construct ξi , and ϕij is the correlation between constructs ξi and ξj. Considering the HTMT2:
Consequently, plim HTMT2ij = ϕij (q.e.d.). It is noted that the HTMT2 does not make any specific distributional assumption about the indicators. To show consistency of the HTMT2, it is sufficient that S is a consistent estimate of Σ. However in the case of ordinal categorical indicators, the Pearson correlation may be replaced by a correlation measure that takes the scale of such indicators into account such as the polychoric or polyserial correlation coefficient (Olsson et al., 1982). Similar has been suggested for the calculation of Cronbach's alpha (Zumbo et al., 2007).
Evaluating the HTMT2: a Monte Carlo simulation
To investigate the performance of the new criterion, we ran a Monte Carlo simulation, in which we compared the HTMT2 to the traditional HTMT. The aim was to explore the HTMT2's finite sample behavior as well as its relative performance when the assumption of tau-equivalence is sequentially relaxed. To judge the performance of the two measures, we examined their estimated bias for the inter-construct correlation ϕ, i.e. the difference between the mean of the estimated and true inter-construct correlation.
For the simulation, we considered a model containing two constructs each measured by three indicators. To relax the assumption of tau-equivalence, we increased the heterogeneity in the loading patterns from homogeneous patterns (1) to substantially heterogeneous patterns (6). To do so, we increased and decreased the loadings in one block by 0.05 from pattern to pattern. The loading patterns used for the simulations are displayed in Table 1.
Since the HTMT assumes tau-equivalent measurement models, we expect an increasing bias for more heterogeneous loading patterns. In contrast, the HTMT2 is expected to be less biased, i.e. it produces an average inter-construct correlation close to the population counterpart. As an additional experimental factor, we varied the sample size; the factor levels were 100, 250 and 500 observations per sample (in analogy to Henseler et al., 2015) in order to investigate the finite sample behavior of the two measures. Since the HTMT2 is a consistent estimator for the inter-construct correlation, we expected that the higher the sample size, the smaller the bias. We presumed a similar behavior for the HTMT in the case of tau-equivalent measurement models. Moreover, we applied both the HTMT and the HTMT2 to the indicators' population correlation matrix. As a final experimental factor, we considered four different levels of inter-construct correlations, i.e. ϕ = 0.75, 0.85, 0.90 and 1.00 (in analogy to Henseler et al., 2015; Franke and Sarstedt, 2019). We refrained from studying medium and lower degrees of inter-construct correlations, because in these cases discriminant validity infringements become less likely. In total, we studied 6 (loading patterns) × 4 (3 different sample sizes + population correlation matrix) × 4 (inter-construct correlations) = 96 conditions.
The complete simulation was conducted in the statistical programming environment R (R Core Team, 2020, Version 4.0.2). For each condition, we drew 1,000 data sets from a multivariate normal distribution with means of zero and a variance-covariance matrix equal to the model-implied correlation matrix of the corresponding condition. To generate the data sets, we used the mvrnorm function of the MASS package (Venables and Ripley, 2002). To compute HTMT and HTMT2 values, we used own R implementations. A total of 72,024 values were calculated for each of the HTMT and the HTMT2.
Finally, for a fair comparison, we removed data sets for which at least one negative indicator correlation was observed. Although the HTMT can be technically calculated in this case, its results are not trustworthy because negative and positive correlations cancel out. Similarly, the HTMT2 cannot be calculated in this case, as the geometric mean is not defined. Such cases occurred most frequently under the condition of small sample size in combination with a low inter-construct correlation and a substantial heterogeneous loading pattern. In this situation 7.2% of the data sets were removed. In all other situations, the share of removed data sets was below 5%.
Results and discussion
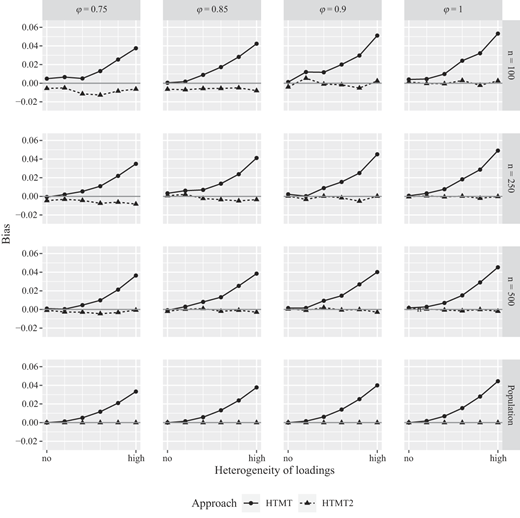
The simulation results are shown in Figure 4 [1]. The results for the different sample sizes including the indicators' population correlation matrix are visualized in the rows of Figure 4. In the columns, the four considered values of the inter-construct correlations are displayed. The vertical lines in each cell represent the six different loading patterns ranging from “no heterogeneity” to “high heterogeneity” (see Table 1). Finally, the black solid line with circles in each cell represents the results for the HTMT, whereas the dashed line with triangles represents the results for the HTMT2.
The results clearly indicate that the HTMT2 outperforms the HTMT in several situations. As expected, HTMT2 results are rather unaffected by the loading patterns when it comes to estimating the inter-construct correlation. In contrast, the HTMT's estimated bias increases when loading patterns become more heterogeneous. In other words, the HTMT becomes more distorted the more heavily indicator loadings deviate from each other, i.e. the more a measurement model diverges from tau-equivalence. In these cases, the HTMT may lead to erroneous conclusions regarding discriminant validity assessments of measurement models.
Considering the size of inter-construct correlations, both HTMT2 and HTMT results remain unaffected. However, larger inter-construct correlations increase HTMT's bias, particularly in case of a substantially heterogeneous loading pattern.
Finally, with regard to sample size, HTMT2's bias disappears for large sample sizes as expected. In case of small sample sizes (n ≤ 100), the HTMT2 is slightly downward biased, particularly for smaller inter-construct correlations (ϕ ≤ 0.85). In the case that the HTMT and the HTMT2 are calculated based on the indicators' population correlation matrix, the HTMT2 shows no bias. In contrast, the HTMT is biased if the assumption about tau-equivalence is violated.
As a result, the HTMT2 is a suitable measure to assess discriminant validity in the case of congeneric measurement models as it provides consistent estimates of inter-construct correlations. Since the HTMT2 is based on the MTMM matrix and follows the same logic as the HTMT, it benefits from the same advantages as the HTMT. In particular, the HTMT2 can be easily calculated based on the indicator correlations without performing any further estimations. Hence, the HTMT2 can be calculated without time consuming procedures even for large sample sizes making it an attractive measure in the era of big data. To conclude, the HTMT2 includes HTMT's advantages, while overcoming HTMT's drawback of being only consistent for tau-equivalent measurement models. Consequently, researchers and practitioners should prefer the HTMT2 over the HTMT in situations, in which indicator loadings deviate from each other.
In line with prior research on the traditional HTMT, we recommend using statistical inference for the HTMT2 to detect discriminant validity problems (Franke and Sarstedt, 2019; Rönkkö and Cho, 2020). As for the HTMT, this can be done by constructing bootstrap confidence intervals for the HTMT2 to investigate whether the confidence interval covers the value 1 (Henseler et al., 2015) [2]. If this is the case, a researcher has found no empirical evidence against a construct correlation of 1, which raises doubts about discriminant validity.
Conclusion and future research
In this paper, we have introduced the HTMT2 as an improved version of the HTMT criterion to assess discriminant validity in structural equation modeling (Henseler et al., 2015). We have proved that the HTMT2 is a consistent estimator for the inter-construct correlation in the case of congeneric measurement models and thus outperforms the HTMT. Since the HTMT2 is equally based on the MTMM matrix comprising the correlations between the indicators in the measurement model, it benefits from the same advantages as the traditional HTMT criterion, i.e. its computation is straightforward without any need for estimation procedures. In contrast to the HTMT, the HTMT2 relaxes the rigid assumption of tau-equivalent measurement models thus equalizing one of HTMT's main disadvantages.
To limit the scope of our study, we only focused on the application of the HTMT2 in the case of reflective measurement models. However, in empirical studies researchers also deal with formative measurement models. Currently, the literature does not provide a unique definition about formative measurement (Diamantopoulos and Winklhofer, 2001). Formative measurement can either refer to the causal-formative measurement model (e.g. Bollen, 1984; Bollen and Lennox, 1991) or the composite model (Fornell and Bookstein, 1982). For composite models, the application of the HTMT and HTMT2 is of little value because the correlations among the indicators of one construct are unconstrained by the composite model and thus do not depend on the loadings (Henseler et al., 2014; Dijkstra, 2017; Schuberth et al., 2018). As a consequence, the HTMT2 will not converge in probability to the construct correlation because the loadings do not cancel each other out. However, the HTMT2 can be applied to constructs embedded in causal-formative measurement models if additional reflective measures are specified for their identification such as in the multiple indicators multiple causes (MIMIC) model (Joreskog and Goldberger, 1975). In this case, only the reflective indicators should be used for calculating the HTMT2. Applying the HTMT2 to formative indicators is problematic, because neither the monotrait–heteromethod nor the heterotrait–heteromethod correlations of formative indicators are informative about discriminant validity.
Our research paves the way for future avenues of research. First and foremost, the HTMT2 is not defined for cases, in which indicator correlations are negative. Monotrait–heteromethod correlations may be negative, if one or more indicators are negatively worded to measure the associated construct. In this case, reverse coding of the indicator(s) may represent a way to solve this issue. Future research may particularly investigate cases, in which heterotrait–heteromethod correlations become negative. For these cases, solutions to deal with negative heterotrait–heteromethod correlations for the HTMT2 need to be developed.
Second, further research is needed to identify appropriate threshold values indicating discriminant validity infringements. Even though we share the prevailing opinion on preferring statistical inference over applying heuristic rules (Franke and Sarstedt, 2019; Rönkkö and Cho, 2020), there may be some groups of users, for whom it is more convenient to compare the HTMT2 statistics to a predetermined cut-off value. Therefore, future simulation studies may identify threshold values to identify discriminant validity infringements.
Third, future research should investigate the performance of the various bootstrap confidence intervals for the HTMT2 and their suitability for statistical inference in this context.
Finally, to evaluate the HTMT2 in more detail, its performance could be compared to other methods of assessing discriminant validity (e.g., the well-known Fornell–Larcker criterion (Fornell and Larcker, 1981) or the constrained phi approach (Jöreskog, 1971). Simulation studies as well as empirical studies could serve as a foundation for this direction of research. Both cut-off values and statistical inference should be taken into account.
Jörg Henseler acknowledges a financial interest in ADANCO and its distributor, Composite Modeling.
Notes
A table with the numerical simulation results can be received upon e-mail request to Jörg Henseler.
For the computation of the HTMT2, users may refer to the following website: www.henseler.com. The bootstrapping procedure for the HTMT2 is implemented in ADANCO 2.3. Interested users may consult www.composite-modeling.com for further information. In addition, the HTMT2 is implemented in the R package cSEM (Rademaker and Schuberth, 2020).