


Environmental, social and governance (ESG) issues have gained unprecedented prominence in the corporate world, underscoring the imperative for businesses to address sustainability and ethical practices. Though the quality of reporting and performance measures being used have significantly improved, we are far from achieving an outcome-based approach for ESG reporting. This article focuses on the steel industry in India with Tata Steel as a classic test case for reporting ESG performances, wherein the ESG performance of Tata Steel have been analysed with an outcome-based approach to demonstrate that the company is truly on a sustainable development path.
We use qualitative content analysis to map the data available in various annual reports of the company (Tata Steel) as also the sustainability reports for the period 2021–2023. Based on discussions with Tata Steel company officials, a content analysis was used to map all initiatives under ESG parameters for the period 2021–2023. Based on inductive reasoning, a comprehensive ESG information quality framework was used to examine the mapped parameters and report for ESG quality and performance, which was further corroborated with findings of Sustainalytics and Morgan Stanley Capital International (MSCI).
Improvement in reporting performance: As can be observed, the position, development and performance scores of Tata Steel in ESG dimensions shows a remarkable achievement for a company in the steel industry. It would be comparable to some of the best companies on matters of ESG reporting and performances. The findings can be corroborated with the general findings of Sustainalytics and MSCI ESG ratings.
The paper is original, and the uniqueness of the paper can be gauged from the fact that it is perhaps one of the few papers to actually measure ESG issues with an outcome-based approach based on real-time sustainability reports of companies and through quality measurement systems to demonstrate that a company is truly on a sustainable path.
1. Introduction
Corporate reporting on issues of environmental, social and governance (ESG) have never assumed such significance for companies as we see today, which is driving corporate performance towards sustainability. Though sustainability is a buzzword today that every major corporate is trying to grapple with, we see reporting for quality and quantity as per regulatory norms gaining substantial traction. It is observed that reporting for performance measures on ESG issues is still not fully developed, whereby mixed results have been reported (Arvidsson & Dumay, 2022). The issues facing companies have changed drastically. Thus, companies must plan not just for flagging severe ESG-related issues but also to meet the ever changing demands for corporate accountability through ESG performance information (Eccles & Klimenko, 2019). The majority of investment funding agencies are shifting their investment portfolio strategies to focus on sustainable development because the investor community increasingly recognizes any form of climate risk is potentially an investment risk (Edelman, 2020; Fink, 2020). Research studies towards examining the quantity, quality and performance of ESG issues are quite contradictory in its focus, methodology adopted and interpreting for results (Aureli, Del Baldo, Lombardi, & Nappo, 2020; Leong & Hazelton, 2019; Xie, Nozawa, Yagi, Fujii, & Managi, 2019). Hence, it is pertinent that corporates move their focus from ESG reporting to accountable outcome-based approaches to build a solid ground towards sustainable development. However, the outcome--based focus aspect is very rarely touched upon in the existing literature.
The significance of the article rests with attempting to validate an outcome-based framework and hence is the focal attention of this article. The article’s context rests with India, which has emerged as one of the fastest-growing emerging economies and currently the fifth largest economy in the world. With growth comes challenges on meeting ESG issues and more so with high energy usage industries like steel. For the steel industry to evolve in a sustainable manner, it is important that companies really commit to reduce carbon emissions and target with a net-zero time frame [1]. As steel industries contribute towards a significant share of global greenhouse gas emissions, it is imperative that there has to be unwavering commitment for ESG initiatives. A ground-breaking innovation gaining traction is the concept of carbon-neutral production. The current study makes an attempt to identify various key performance indicators under ESG as rated by different global rating agencies and analyse Tata Steel, a company based in India with global footprints, and see how it stands up against the various parameters, thereby giving an outcome-based approach to the study. Thus, for steel manufacturers, reducing toxic emissions and energy consumption is critical, as the decarbonization agenda is one of the most important priority areas for companies globally.
The absence of a systematic classification system for financing sustainability commitments raises concerns among investors, leading to risks such as green washing (Montgomery, Lyon, & Barg, 2023) and misallocation that undermine investor confidence. Investors require a publicly available guiding document to delineate the financial strategies employed by corporations to target sustainability goals. These gaps in sustainability reporting have the potential to affect borrowing capabilities, as investors increasingly integrate ESG metrics into their investment decisions.
2. Literature review
2.1 Variation in ESG performance reporting
ESG has entered the lexicon of investors, managers and other stakeholders in a major way over the past few years and is seen as a surrogate for the assessment of the risks and resilience of enterprises. Increasingly, it is observed that corporates are confused about what exactly is meant by good reporting quality, which meets user expectations (de Villiers & van Staden, 2006; Cort & Esty, 2020). Corporate ESG information has been looked down upon with deep sense of scepticism by investors and the financial community mainly because it lacks relevant value and suffers from comparability issues between firms and also aspects of credibility (Abhayawansa, Elijido-Ten, & Dumay, 2019; Arvidsson, 2014; Cho, Laine, et al., 2015; Cho, Michelon, et al., 2015). However, a sustainability reporting framework must demonstrate that resources are fairly bought and used to support diverse life on earth within habitable ranges (Abeysekera, 2022).
The variation in ESG performance among different firms, along with doubts about the consistency of ESG effects across various industries, further support these concerns (Cort & Esty, 2020; Crace & Gehman, 2023). Although it is widely acknowledged that sustainable ecosystems are becoming a necessary condition for organizational continuity, nevertheless, firms' sustainability reporting trends have not kept pace with addressing sustainability-related issues (Abeysekera, 2022). Determining what information about sustainability-related risks and opportunities is material in nature and is highly subjective (Abhayawansa, 2022). Many authors have commented that corporate sustainability accounting does not find much usage (Gray, 2010; Cho, Laine, et al., 2015; Cho, Michelon, et al., 2015) mainly because conflicting viewpoints give way to wrong interpretations (Eccles, Lee, & Stroehle, 2020). Theorists have argued that although the information is relevant, reports are not comparable and subject to ambiguity (Searcy & Buslovich, 2014), thereby ending up splintering the practice of reporting for ESG measures (Bartels, Fogelberg, Hoballah, & van der Lugt, 2016). Though in practice we assume that ESG reporting strategy is an indicator for actual corporate ESG performance, it is very difficult to find differences between actual performance and perceived performance (Rajesh & Rajendran, 2020). It has also been pointed out that because of pressures from regulatory bodies or activist stakeholders, ESG reporting performance tends towards gradual improvement (Leong & Hazelton, 2019).
Further as mentioned by Kaplan and Ramanna (2021), the difficulty of reconciling across various ESG activities emanates from the challenges of objectively making the underlying moral judgements. In absence of a broad consensus about the role and purpose of corporations in society, any judgements about what to measure, how to measure or how to aggregate ESG data are ad-hoc in nature and subject to manipulation for interpretation and reporting. Many a time, this can lead to legitimacy issues that a company can face (Dumay, La Torre, & Farneti, 2019), which makes it imperative for corporates to move their focus from ESG reporting to accountable outcome-based approaches to build a solid ground towards sustainable development. It is very important to note that mere reporting for quality and quantity to show a perceived improvement in performance is not going to work in the coming years. Reporting systems have to evolve towards performance-based outcomes, which could drive sustainability in organizations (Arvidsson & Dumay, 2022). Hence, our first research question is as follows:
How can we validate ESG performances of organizations with an outcome-based approach?
2.2 Investor sentiments in ESG
It is estimated by BloombergIntelligence (2024) that ESG-themed investments may hit $53tn by 2025, which would be about a third of global assets under management (Banerjee & David, 2024). The mammoth opportunities that lies ahead along with the challenges has been instrumental in attracting increased attention from both industry and academic researchers to delve on the study of financial and non-financial impact of ESG initiatives (Maji & Lohia, 2023; Efthymiou, Kulshrestha, & Kulshrestha, 2023; Anita, Shveta, Surendra, & Arvind, 2023; Rao, Dagar, Sohag, Dagher, & Tanin, 2023; Banerjee & David, 2024). However, very little is known about the relevance of critical ESG factors to Indian investors. The empirical studies available indicates that the benefits of adopting ESG initiatives for organizations are multipronged (Banerjee & David, 2024), which help firms reduce their debt burden (Atif & Ali, 2021), helps to improve the firm’s reputation (Nirino, Santoro, Miglietta, & Quaglia, 2021), creates a climate for real investment (Cupertino, Consolandi, & Vercelli, 2019), reinforces ability to raise capital (Bodhanwala & Bodhanwala, 2018) and paves way for building resilience to market related shocks (Beloskar & Rao, 2023), which in turns paves way for positively impacting firm performance (Bhaskaran, Ting, Sukumaran, & Sumod, 2020). Reporting for ESG matters in India started in 2009 when The Ministry of Corporate Affairs issued the Voluntary Guidelines on Corporate Social Responsibility. This aspect was further reinforced when Securities and Exchange Board of India (SEBI) mandated a Business Responsibility Report filing for the 100 companies by market capitalization in 2012 (Maji & Lohia, 2023; Banerjee & David, 2024). However, even after a decade, the incorporation of ESG initiatives in business reporting investing still has not gained enough traction, especially given India’s position as a fast growing major economy (Sharma, Panday, & Dangwal, 2020; Banerjee & David, 2024). Thus, understanding the investor’s sentiment towards integrating ESG initiatives in their decisions to invest gains significant relevance as evident from issues as follows:
(1) As mentioned by Banerjee and David (2024), India’s vision of becoming the third-largest economy in the world and achieving US$7tn by 2030 needs the strengthened participation of domestic investors in ESG initiatives (Maji & Lohia, 2023). (2) The accelerated integration of ESG in investment decision-making globally is pressurizing emerging countries to focus on sustainability issues while investing. As an example, in 2021 the Securities and Exchange Commission (SEC) in USA proposed mandatory disclosure of climate-related efforts to investors (KPMG, 2021). Though researchers have attempted to explore the awareness of ESG among investors, especially in emerging economies like India, Indonesia, etc., the findings of the study are contradictory in nature (Banerjee & David, 2024). Prabhu and Yesugade (2023) reported an acceptable level of awareness in a study on ESG awareness among retail investors in Mumbai, India, focusing on FinTech and ESG awareness through a survey conducted on 50 retail investors. However, contradicting results were reported by Dhingra (2020), who surveyed 40 retail investors in India and found that the awareness levels are highly skewed in favour of the male gender. In another study, ESG awareness among Indian investment bankers in Mumbai vis-à-vis European counterparts were examined, and the findings suggest that in India, though awareness is growing, but the market has limited sustainability choices (Sinha, Datta, & Zioło, 2020; Banerjee & David, 2024). Although several studies has reiterated the role of awareness in the decision-making process across various contexts in investors, there is a lack of uniformity and consistency in ESG awareness findings in emerging economies, which poses a risk in portfolios of investment.
There is a lack of unanimity on a framework for the best ways to implement a balanced ESG investment portfolio. It is observed that few investment bankers pursue developing a framework for including ESG factors in conventional financial valuation methodology, while most bankers do not believe in such a proposition (Sinha et al., 2020; Banerjee & David, 2024). As significant challenges exist in integrating ESG factors into investment decisions, including unreliable data, lack of standardization, etc., it complicates the practical adoption of ESG considerations. One way to mitigate the challenges is to have a more qualitative understanding of the investor’s viewpoint and approach to ESG considerations (Banerjee & David, 2024). Consequently, companies that are hesitant to openly disclose relevant information in public domain or are unresponsive to the stakeholder community at large faces sustainability risks and growing scepticism from the markets, which in turn can potentially lead to higher costs of capital (Fink, 2020), affecting the financial performance of companies. Thus, higher costs of borrowing can lead to risks in business as perceived by many investor companies. Thus, in a world that is highly dynamic in nature and severely impacted by climate change, companies can sustain themselves through credible reporting and disclosures (Bebbington & Unerman, 2018). The financial community is already under pressure in trying to seek more credible ESG-related information to assess corporate ESG performance, based on which sound investment decision processes can be built (Eccles & Klimenko, 2019; Eurosif & ACCA, 2013; Kölbel, Heeb, Paetzold, & Busch, 2020) and specifically on issues of sustainability (Krasodomska & Cho, 2017). There has been a great deal of attention recently on the standardization of non-financial information as a panacea for addressing the shortcomings of existing sustainability reporting (Abela, 2022).
For the last few years, and in continuation, environmental and societal risks have been the top most global risk agenda outlined at various World Economic Forums, making ESG issues critical factors in decision-making processes. Commenting on investors seeking improved ESG performance, findings suggest that companies with clear sustainable development goals get precedence (Hinze & Sump, 2019). As pointed out by Helfaya and Whittington (2019), studies on ESG issues assume that the quantity of disclosure is a good way to assess the quality or transparency of disclosure. Thus, companies must ensure that the information they provide must be relevant, credible and of high quality for reporting purposes (Eccles & Klimenko, 2019). From the above arguments, it is very clear that companies having better ESG performance on a comparative analysis should lead to relatively lower risks in business. Hence, our second research question is as follows:
Does a company with a better ESG performance rating lead to a relatively lower risk categorization for businesses?
2.3 Other outcome-based approaches:
On a different take, Kaplan and Ramanna (2021) articulated a comprehensive framework for Green House Gas (GHG) accounting and reporting and mentions that environmental (E) metrics are the most amenable for rigorous corporate reporting since they are based on objective, physical measurements of the quantities of gases, solids and liquids that companies use and produce. Further, among the multiple types of environmental degradation, the potential existential threat to humanity from climate change is a leading enabler for advocating the highest priority on improving the measurement and reporting of corporate (and government) GHG emissions. They articulated that corporate societal (S) performance along dimensions where a general moral consensus already exists – such as avoidance of slave labour anywhere in a company’s supply chain – can also be communicated via a rigorous reporting system. Majority of these studies have concentrated on the disclosure of performance information related to the common ESG categories, whereas a limited number of papers have explicitly considered or even focused on the dark side of ESG, namely controversies and scandals (e.g. Einwiller & Carroll, 2020). The fact that they are comparably under-researched in the context of sustainability reporting quality is rather surprising, as the disclosure of irresponsible ESG activities is crucial for providing a complete and balanced picture (Schwoy, Dutzi, & Messing, 2024). Governance (G) reporting is the most conceptually muddled of the three ESG components since governance at best is a process, not an outcome. Good governance is valuable only if it leads to better decisions and better financial, environmental or societal outcomes, such as the diversity of board members or compliance to statutory mechanisms to avoid litigation (Kaplan & Ramanna, 2021). Corporate reporting on societal outcomes is more complex because of diverse beliefs about the most beneficial or detrimental impacts of corporations on society. The governance component of ESG reporting needs to be subsumed into financial, environmental and societal reporting, since governance is a process and not an outcome in itself (Kaplan & Ramanna, 2021).
2.4 The Indian context - environmental imperatives and challenges
India's booming economy comes at an environmental cost. Rapid industrialization has led to air and water pollution, resource depletion and inadequate waste management. Firms face stringent regulations aimed at curbing emissions and minimizing environmental impact. However, fragmented environmental laws, limited access to clean technologies and infrastructure gaps pose significant challenges. The energy consumption in the steel industry differs from other energy-intensive manufacturing sectors like cement, etc. in several ways. The electricity consumed by these steel plants in India is predominantly derived from thermal power plants, and the potential for renewable sources of energy like solar or wind in captive power plants is limited due to the need for a steady and stable electricity supply for smelting operations. Alongside the performance of companies dedicated to doing better on ESG, there is clear evidence that shows poor ESG practices and failures of corporate governance adversely affect shareholder value. It is likely that if a company has a tainted reputation, the negative fallout is much more with ESG failures. The opposite is also true – if a company has a positive ESG reputation, it can get shielded from a significant decline in stock price (Koechler & Hespenheide, 2013).
India’s demographic base constitutes a substantial segment of the youthful workforce, which can be tapped for sustainable and ethical business practices, which in turn can guide the adoption of investment strategies based on ESG principles (Gupta, 2021). India has emerged as a formidable force in the area of sustainable finance, with surging interest in ESG funds and green investment, which can be looked as a prominent shift towards environmentally conscious investing (Pant, 2021). This trend is notable in the continuous evolving landscape of corporate responsibility and sustainable investing practices in India (Stephenson, 2021). As one of the world’s fastest-growing economies, India’s trajectory is characterized not only by its economic prowess but also by its resolute commitment to inclusive and sustainable policies (Kaur, 2019). However, research highlights the predominant hurdles hindering India’s progress in fostering a green financial market as apprehensions of greenwashing loom in the horizon (Freytag, 2020).
2.5 Brief about Tata Steel [2][3]
Tata Steel is one of the world’s most geographically diversified major steel producers with an annual crude steel capacity of 34 MnTPA. From mining to manufacturing and marketing and retail of finished products, it is one of the few steel producers that are fully integrated across the steel value chain. Tata Steel has a foot print across many countries of the world with operations in India, the United Kingdom, the Netherlands, Thailand and Canada. Tata Steel is continuously augmenting their operational capacity through a combination of organic and inorganic growth initiatives with a special focus on sustainability in its operations.
3. Methodology
3.1 Study design and data collection
We use qualitative content analysis to map the data available in various annual reports of the company (Tata Steel) as also the sustainability reports for the period 2021–2023.
Qualitative data captured from the sustainability reports of Tata Steel were picked based on the several initiatives taken on the ESG front as outlined below-
3.2 Research process
Annual and sustainability reports of Tata Steel were used to capture snapshots of parameters in ESG performance across different geographies. Based on discussions with Tata Steel company officials, a content analysis was used to map all initiatives under ESG parameters for the period 2021–2023.
A comprehensive ESG information quality framework (Arvidsson & Dumay, 2022) was used to examine the mapped parameters and report for ESG quality and performance. Thereafter, we improvised on the existing framework by highlighting the ESG performance parameters through measurable scores (position, development and performance scores), as highlighted through outcomes in Table 1. The position dimensions signifies the current state of things in terms of initiatives mentioned in the annual report of a company, while the development dimension shows progress reported in any of the multiple initiative(s) undertaken by the company and detailed in its annual report. The performance dimension tracks the targets achieved of any initiative measured quantitatively over a period.
ESG information quality framework with coding-Tata Steel
| Sl No | Environmental | Social | Governance | |||||||
|---|---|---|---|---|---|---|---|---|---|---|
| 2021 | 2022 | 2023 | 2021 | 2022 | 2023 | 2021 | 2022 | 2023 | ||
| A | Number of initiative mentioned in the annual report | 30 | 34 | 36 | 18 | 18 | 22 | 14 | 16 | 18 |
| B | Initiatives discussed in detail | 22 | 28 | 32 | 16 | 17 | 20 | 10 | 12 | 14 |
| C | Initiatives which showed progress with time | 16 | 24 | 30 | 13 | 15 | 18 | 7 | 9 | 10 |
| D | Initiatives which were targeted with a time frame in mind | 16 | 22 | 26 | 12 | 14 | 15 | 6 | 8 | 9 |
| Position score (B/A) | 0.73 | 0.82 | 0.89 | 0.88 | 0.94 | 0.91 | 0.71 | 0.75 | 0.78 | |
| Development score (C/B) | 0.73 | 0.80 | 0.94 | 0.81 | 0.88 | 0.90 | 0.7 | 0.75 | 0.71 | |
| Performance score (D/B) | 0.73 | 0.78 | 0.81 | 0.75 | 0.82 | 0.75 | 0.60 | 0.60 | 0.64 | |
| Average score | 0.73 | 0.80 | 0.88 | 0.81 | 0.88 | 0.85 | 0.67 | 0.70 | 0.71 | |
Source(s): Author’s construction based on the sustainability reports of Tata steel, 2022–24
The environmental dimension (E) in the framework attempts to portray a company's initiatives on the environmental front in terms of how it approaches issues such as climate protection, net-zero goals, water conservation, resource efficiencies and reducing pollution. The social dimension (S) covers aspects on how the company engages with its stakeholders at large covering issues of diversity, education and well-being of employees. The governance dimension (G) tries to portray how a company is responsible in terms of being a corporate citizen through usages of effective policies, standards, guidelines and regulations to guide and streamline operations, thereby adding value to the product or service. The coding procedure used is mentioned in details in the later part of the analysis. Data analysis was based on inductive reasoning.
Tracking different independent sustainability rating disclosures made over a three-year time period. ESG indicators for Tata Steel have been analysed based on various ESG disclosure frameworks of international rating agencies. Since there is no standardized method to compare, one Indian ESG disclosure framework by SEBI, i.e. Business Responsibility and Sustainability Reporting (BRSR) [4], and two Global ESG disclosure framework, i.e. Global Reporting Initiative (GRI) [5] and United Nations Sustainable Development Goals (UNSDG) [6] has been exhaustively used in the analysis. The GRI and UNSDG parameters have been mapped into BRSR. In addition, Sustainalytics and MSCI ratings are also considered in which case a comparison is made between Tata Steel and Nippon Steel.
3.2.1 Coding procedure
In line with the methodology followed (Arvidsson & Dumay, 2022) to report on quality levels of data in reporting for ESG measures, our focus was on using the same logic for coding the various initiatives of Tata Steel on their position-development-performance dimensions related to ESG issues, highlighting the outcome section. The procedure followed is mentioned as follows-
Broadly if we take the position aspect of environmental dimension, various initiatives have been undertaken by Tata Steel like reducing CO2, reducing and recycling of waste sustainably, efforts in conservation of water and emphasis on using renewable energy, etc., which are mentioned in the BRSR sustainability report in line with global practices. This aspect informed us about how many environmental initiatives were mentioned or just touched upon in the annual sustainability report. As an example, if we take the issue of conservation of water, we can examine whether this aspect is mentioned in the sustainability report.
Next, we examined the number of environmental initiatives mentioned in the sustainability report and how many initiatives were detailed in the report. Detailing of any aspect involved any initiative on the environmental dimension in which some progress was made in defining the problem or resources allocated or time frames and/or targets have been set. Broadly it enabled us to understand whether management at Tata Steel took the initiative to progress it further for implementation. If we take the example of conservation of water, what steps have Tata Steel took or is on the verge of taking to conserve water, as detailed in the sustainability report. This aspect of the methodology helped us in determining the appropriate code that should be attested. The coded value of the position score was derived from the ratio (the number of environmental initiatives described in detail/the total number of initiatives mentioned).
For the developmental aspect of the environmental dimension (i.e. progress over time), we looked at whether the company made any progress related to the environmental initiatives highlighted in the report compared to earlier time periods. As an example, how has Tata Steel progressed for reduction of GHG’s or usages of renewable energy increasing over time? The development needs considered from the report should have taken place over the last 2–3 years, with explanation given about how it was achieved without sacrificing other productivity and efficiency measures in the report. Thus, towards conservation of water, did Tata Steel made progress compared to earlier time periods through appropriate steps taken and resources allocated? The development score under environment was calculated again as a ratio (number of environmental initiatives that showed progress over time/the total number of environmental initiatives detailed in the report).
Finally, on the performance dimension of environmental issues, given the number of initiatives detailed in the sustainability report, we looked at how many initiatives were target oriented with a time frame in mind. Thus, again using the illustration of the initiative to conserve water, did Tata Steel made progress over a time period or were any targets set with a time frame in mind to conserve water? We again used a ratio (number of initiatives that are target oriented/total number of initiatives detailed in the report). In this way, we found the performance score of the environmental dimension.
Similar kinds of ratios were used both for the social and governance issues as well on the position, development and performance score of the measures. The procedure followed for coding and measurement of the coded values is outlined below with an example of the environmental dimension as picked from the annual report of 2022 and comparing it with the annual report of 2021. Refer Table 1 for details.
Number of environmental initiatives mentioned in the annual report (A) = 34.
Number of environmental initiatives detailed in the annual report (B) = 28.
Number of environmental initiatives that showed progress over 2021 (C) = 24.
Number of environmental initiatives that were target oriented with time frame in mind (D) = 22.
Position score = B/A = 0.82.
Development score = C/B = 0.80.
Performance score = D/B = 0.78.
3.2.2 Validity
To establish the validity of the findings, triangulation was used to compare the coded scores with –
Indian ESG disclosure framework by SEBI, i.e. BRSR, and two Global ESG disclosure framework, i.e. GRI and UNSDG. The GRI and UNSDG parameters have been mapped into BRSR (refer to Table 4).
Tracking different independent sustainability rating disclosures made by international rating agencies like Sustainalytics and MSCI ratings (refer to Tables 2 and 3).
A review of BRSR principles of Tata Steel
| Principles of BRSR | Mapped with | Compliance status |
|---|---|---|
| Sec A: General disclosures encompass basic company information | GRI (Universal), UNSDG | High degree of compliance |
| Sec B: Management and process disclosures provide evidence that companies are adhering to the structures, policies and processes specified in the National Guidelines on Responsible Business Conduct | GRI-Environmental and Social | High degree of compliance |
| Sec C: Principle wise performance disclosures are focused on more quantitative data relating to 9 basic principles of the National Guidelines on Responsible Business Conduct | ||
| Principle 1: Businesses should conduct and govern themselves with integrity, and in a manner that is ethical, transparent and accountable | GRI-Universal Standard Governance | High degree of compliance |
| Principle 2: Businesses should provide goods and services in a manner that is sustainable and safe | GRI- Environmental Standard | High degree of compliance |
| Principle 3: Businesses should respect and promote the well-being of all employees, including those in their value chain | GRI- Social | Moderate degree of compliance |
| Principle 4: Businesses should respect the interests of and be responsive to all its stakeholders | GRI-Governance | Moderate degree of compliance |
| Principle 5: Businesses should respect and promote human rights | GRI-Social | Moderate degree of compliance |
| Principle 6: Businesses should respect and make efforts to protect and restore the environment | GRI-Environmental | High degree of compliance |
| Principle 7: Businesses, when engaging in influencing public and regulatory policy, should do so in a manner that is responsible and transparent | GRI-Governance | High degree of compliance |
| Principle 8: Businesses should promote inclusive growth and equitable development | GRI-Social | Moderate degree of compliance |
| Principle 9: Businesses should engage with and provide value to their consumers in a responsible manner | GRI-Governance | Moderate degree of compliance |
Source(s): Author’s construction based on reports of BRSR and GRI of Tata Steel
Sustainalytics
| Indicators | Tata steel | Nippon steel |
|---|---|---|
| ESG risk rating | 29.7 | 39.6 |
| Risk category | Medium | High |
| Industry rank (1st = Lowest Risk) | 22/156 | 92/156 |
| Risk matrix _ sustainalytics | ||||
|---|---|---|---|---|
| ESG risk rating | 0–10 | 10–20 | 20–30 | 30–40 |
| Risk category | Negligible | Low | Medium | High |
Source(s): Sustainalytics ESG ratings, Link to the website
MSCI (Morgan Stanley capital international) ESG rating
| Indicators | Tata steel | Nippon steel |
|---|---|---|
| Does the company have a decarbonization target? | Yes | Yes |
| Does NIPPON STEEL CORPORATION have a decarbonization target that is considered in the calculation of Implied Temperature Rise? | Yes | Yes |
| Target year | 2045 | 2030 |
| Comprehensiveness % of company footprint covered by target | 100% | 73.25 |
| Ambition Projected reduction per year to meet stated target** | −4.5% pa | −0.57% pa |
| Would the company emission goal be enough to keep global warming to 1.5°- MSCI IMPLIED TEMPERATURE RISE | over 3.2° | over 3.2° |
| Net zero 2050 alignment | misaligned | misaligned |
| How well company managing its ESG issues that could affect it financially – MSCI Rating | B (Laggard) | A (Average) |
| ESG Rating History | B, B, B, B, B | BBB, BBB (Avg), A, A, A |
| Key Issues distribution in relation to industry peers | Laggard- Health and Safety, Labour Management, Water Stress Average-Governance Corporate Behaviour, carbon emission, Toxic emission and Waste Leader- Not a leader in any of the key issues | Laggard- Governance Average- Corporate Behaviour, carbon emission, Health and Safety, Labour Management Leader- Toxic emission and Waste, Water Stress |
| Has the company been accused of any controversial behaviour related to environment, communities, its workforce or its customers | Green – Environment, Human Rights Yellow- Customer, product safety quality, labour right, health and safety bribery and fraud | Green – Environment, Human Rights, Governance Yellow- Customer, anti competitive price, Labour Management Orange (Severe controversy) – Social, Labour right, health and Safety |
Source(s): MSCI ESG ratings, Link to the website
4. Results
4.1 ESG performance rating
The coding scores are inserted into the framework as depicted in Table 1. Also a bar chart depicting the progress made on ESG dimensions is reflected in Figures 1–3. As can be observed the position-development-performance score in the information quality framework shows progress over time when observed from 2021 to 2023, depicting a picture of a company on a sustainable path. Similarly, the figures in Table 5 can corroborate the performance improvement. The above discussion validates RQ1 that the information quality framework used in the analysis is a good indicator for validating the outcome-based approach used in the study.
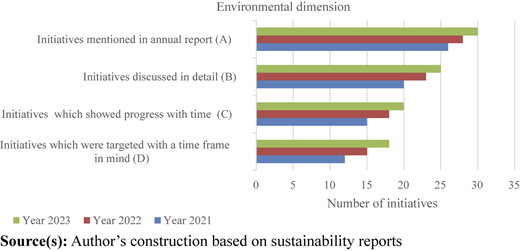
Bar chart of environmental dimension (Tata Steel)
Bar chart of environmental dimension (Tata Steel)
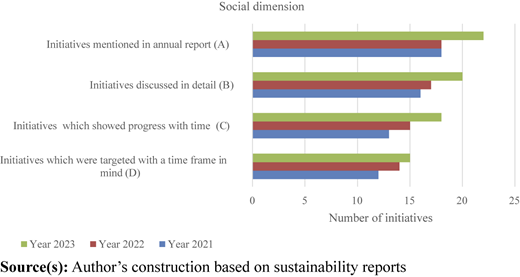
Bar chart of social dimension (Tata Steel)
Bar chart of social dimension (Tata Steel)
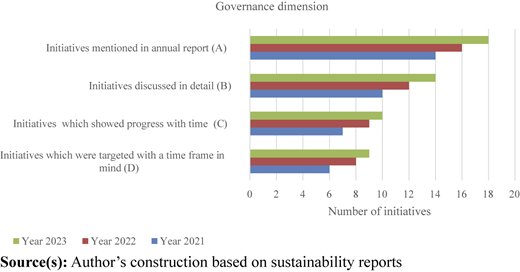
Bar chart of governance dimension (Tata Steel)
Bar chart of governance dimension (Tata Steel)
Excerpt of outcome-based targets
| TATA steel | |||||
|---|---|---|---|---|---|
| Indicators | KPI | Target | Target year | FY 23 | FY 24 |
| Environment | build 5 mntpa Steel Recycling Business | 5 MTPA | 2030 | 0 | 0.5 mtpa |
| Water intensity - | 2 m3/tcs | 2025 | 2.74 m3/tcs | 2.49 m3/tcs | |
| Water intensity – | 1.5 m3/tcs | 2030 | 2.74 m3/tcs | 2.49 m3/tcs | |
| Specific Energy Consumption (Gcal/tcs) | 4.5 Gcal/tcs | 2045 | 5.63 | 5.78 | |
| Dust emission | 0.43 kg/tcs | 2025 | 0.37 | 0.35 | |
| Co2 emission intensity | 2 tCO2/tcs | 2025 | 2.44 | 2.46 | |
| Co2 emission intensity | 1.8 tCO2/tcs | 2030 | 2.44 | 2.46 | |
| Circular economy | 99% | 2025 | 70% | 80% | |
| Net zero | 2045 | ||||
| Biodiversity- 100 % sites under biodiversity | All sites | 2025 | 70% | 85 % sites are under biodiversity | |
| Social | diversity- | 25% | 2025 | 18% | 20% |
| CSR- Improving livelihood | 2 million | 2025 | 1.61 | 1.65 | |
| Zero Harm – Employee Safety | 0 | 2030 | Fatality-4 | Fatality-4 | |
| Governance | Responsible Steel certification | All sites | 2025 | 50% | 90% of sites are certified |
| R&D-to be in top 5 in technology in steel industry | 2030 | Not in top 5 | Not in top 5 | ||
Note(s): Tcs - Tons of crude steel
Gcal - giga calorie and tCO2 - tonnes of carbon dioxide
Source(s): Based on sustainability reports of Tata steel for 2022–24
4.2 Sustainalytics ESG rating [7]
Sustainalytics provides high-quality, analytical research data on ESG issues for investors, analysts and companies. While using the summarized data from Sustainalytics, we used Nippon Steel [8][9], another leading company for comparison, as it is also a highly respected steel player with best practices across the industry. Based on parameters to identify, understand and manage ESG-driven risks and opportunities, Tata Steel is placed in the medium risk category, whereas Nippon Steel is placed in high risk category. Refer to Table 2 for details. We can infer from the broad categorization of risks that Tata Steel is well on its way to reduce the risks further as can also be corroborated with results from Tables 1 and 5. Thus, the second research question – RQ2: Does a company with a better ESG performance rating lead to a relatively lower risk categorization for business stands validated?
4.3 MSCI (Morgan Stanley Capital International) ESG rating [10]
MSCI ESG ratings are aimed to measure the capability of company’s management to handle potential ESG risks and opportunities through financial parameters. The methodology used in MSCI is to identify industry leaders and laggards based on their exposure to ESG risks and how well the company is positioned to manage the identified risks relative to peers. ESG ratings range from leader (AAA and AA), average (A, BBB and BB) to laggard (B and CCC). As can be observed from Table 3,
In the category of “How well a company is managing its ESG issues that could affect it financially”, Tata Steel is in the laggard category while Nippon Steel is placed on the average list.
Tata Steel is put in the laggard category in health and safety, labour management and water stress, and it is average in governance corporate behaviour, carbon emission, toxic emission and management of waste. Tata Steel is not a leader in any of the key issues. In the case of Nippon Steel, it is placed in laggard list in governance, and it is average in corporate behaviour, carbon emission, health and safety, labour management; however, Nippon Steel is a leader in toxic emission and waste and water stress.
As can be observed from Tables 1 to 5, Tata Steel is showing improvements in all areas of ESG parameters, so the laggard categorization will lead to an average categorization in the near future. Similarly, average categorization in the areas mentioned above should lead to a leader position in the near future.
4.4 Business Responsibility and Sustainability Reporting (BRSR)
The BRSR is an initiative towards ensuring that investors have access to standardized disclosures on ESG parameters. Access to relevant and comparable information will enable investors to identify and assess sustainability-related risks and opportunities of companies and make better investment decisions. At the same time, companies will be able to better demonstrate their sustainability objectives, position and performance resulting in long-term value creation. While tracking the BRSR reports of Tata Steel [11], all aspects of BRSR have been mapped with appropriate GRI and UNSDG goals to make it robust from the point of analysis. Detailing of Sec A and Sec B are done, which shows a very high degree of compliance of a company in the steel industry (refer to Table 4). Besides high degree of compliance, it is also observed that Tata Steel has gone beyond norms of reporting to show high performance in matters of ESG. In terms of environmental goals (carbon emission), Tata Steel has committed to be net zero by 2045. To look at some of the qualitative aspects of BRSR principles, refer to Table 4.
An excerpt of the target based outcomes achieved by Tata Steel is mentioned in Table 5, which offers a good snapshot about how Tata Steel is focused on an outcome-based approach in its drive towards sustainability.
5. Discussions and conclusions
5.1 Improvement in reporting performance
As can be observed from Table 1, ESG information quality framework with coding that the position, development and performance scores of Tata Steel in ESG dimensions shows a remarkable achievement for a company in the steel industry. It would be comparable to some of the best companies on matters of ESG reporting and performances. The findings of Tables 1 and 5 can be corroborated with the general findings of Sustainalytics (Refer to Table 2) and MSCI ESG ratings (Refer to Table 3). The scores are significant for various reasons:
It is probably rare to measure the performance of the ESG scores through a standardized and robust quality framework like the framework used in the paper, which can really report for ESG performance as an actual outcome-based approach.
The scores signify a very positive and healthy picture of a company working towards sustainable development and validate RQ1 about an outcome-based approach, which can be validated through company illustrations.
The scores can give a significant confidence to the investor community, as any score above 0.6–0.7 on the performance dimension and any score above 0.5 on the average score overall is a significant achievement.
High score on the development aspects gives an indication of a company that is truly on a sustainable path through target-based approaches with a timeframe in mind, which in turn reflects into higher performance scores.
As can be observed from the line diagrams mentioned in Figures 4–6, a, b and c, the average score on position, development and performance is on an upward trajectory since the last three years, which is a good projection of a company on the sustainability front.
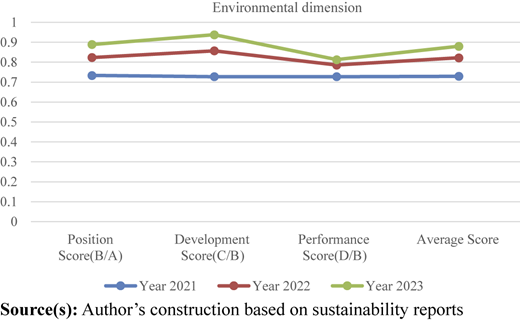
Line diagram of position, developmental, performance and average score for environmental dimension (Tata Steel)
Line diagram of position, developmental, performance and average score for environmental dimension (Tata Steel)
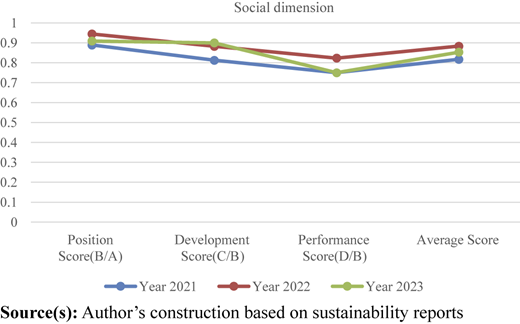
Line diagram of position, developmental, performance and average score for social dimension (Tata Steel)
Line diagram of position, developmental, performance and average score for social dimension (Tata Steel)
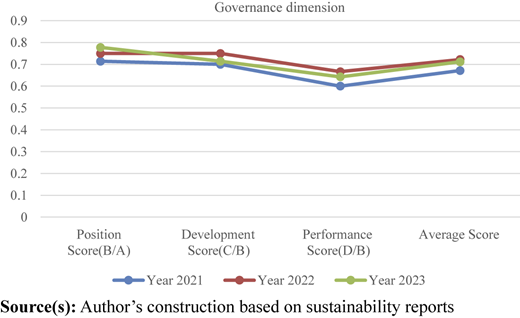
Line diagram of position, developmental, performance and average score for governance dimension (Tata Steel)
Line diagram of position, developmental, performance and average score for governance dimension (Tata Steel)
5.2 Improvement in investor’s perception of risk
The ratings of Tata Steel as given by the independent rating agencies, namely Sustainalytics and MSCI, corroborates that a better performance of ESG parameters can lead to lower risk of business for the investor community.
As there is a lack of uniformity and consistency in ESG awareness findings in emerging economies, which poses a risk in portfolios of investment, reports of independent rating agencies assumes significance to have a signalling effect on the sentiments of investors. As the findings of Sustainalytics rating agency suggest (refer to Table 2), any risk rating score below 30 can be assessed for medium risk and any score above 30 qualifies for a higher risk category cut-off. Tata Steel has a score of 29.7 compared to Nippon Steel’s score of 39.6. Thus, Tata Steel in in the medium risk category compared to Nippon Steel, which is in the high-risk category. From the above, we can infer that that a higher rating across ESG parameters as discussed earlier for Tata Steel can be corroborated with the Sustainalytics report to suggest a lower risk categorization of business.
The findings of MSCI ratings suggest that Tata Steel is not a leader in any category. However, as can be observed, Tata Steel has only green and yellow indicators of overall ESG performance, compared to green, yellow and orange indicators for Nippon Steel. Any parameters under MSCI rating that falls into orange indicator suggests that the company has been accused of controversial behaviour related to environment, communities, its workforce or its customers. Tata Steel is not rated in orange category in any indicator.
The findings of MSCI further corroborate the fact that Tata Steel is well placed from a stake holder standpoint, which should give confidence to investors that more reliance on non-financial and qualitative information could be a panacea for rectifying the shortcomings of existing sustainability reporting. Thus, reliance on non-financial indicators can give confidence to investors about a firm’s reputation in ESG issues is a good indicator for lower risk categorization for business.
The article presented on Tata Steel with an outcome-based approach is very timely and contemporary for both researchers and practitioners. It is noteworthy to mention that companies need to move beyond quantity and quality of reporting to highlight the performance of ESG measures, and towards this, this article provides an outcome-based ESG performance analysis.
In conclusion, the steel industry's status as one of the most energy-intensive sectors underscores its high-risk profile in ESG risk assessment, particularly within the dynamic landscape of India's evolving business environment. With the Securities and Exchange Board of India (SEBI) (2020) mandated reporting frameworks, ESG practices and sustainability reporting have gained paramount importance. This study has meticulously explored the nuanced landscape of ESG within the steel sector through the detailed analysis of Tata Steel through sustainability reporting frameworks such as BRSR and GRI, as also referred to the outputs of Sustainalytics and MSCI. The adoption of ESG practices within the steel sector offers numerous advantages, including the potential to mitigate risks associated with climate change, regulatory fines and reputational damage. However, addressing these challenges necessitates a multifaceted approach. The sector's immense energy requirements and greenhouse gas emissions pose significant challenges, exacerbated by India's reliance on conventional coal-fired thermal power plants. Overcoming these hurdles demands innovative solutions and substantial investments in renewable energy sources. Moreover, ensuring gender diversity and pay parity within the industry is crucial for fostering inclusive growth and social equity, ultimately enhancing corporate reputation and stakeholder trust. In addition to environmental considerations, standardized reporting frameworks like GRI and BRSR play a pivotal role in enhancing ESG transparency and accountability. These frameworks provide comprehensive guidelines for disclosing ESG metrics, empowering stakeholders to assess companies' sustainability performance consistently. Furthermore, regulatory mechanisms such as Carbon Border Adjustment Mechanism (CBAM) [12] and stringent environmental policies drive greater corporate responsibility and alignment with global climate objectives, incentivizing companies to adopt sustainable practices and mitigate environmental risks. Access to capital for green investments and expertise in sustainable technologies are critical enablers for driving innovation and implementing environmentally friendly solutions. The theoretical contribution of the paper lies in validating an outcome-based approach, which can be used by organizations and the investor community for checking the credibility of ESG performances for sustainable growth and development.
In terms of limitations, the research has been conducted on Tata Steel only with just a comparison made with Nippon Steel on certain ESG parameters. Future research can make a comparative study of Indian Steel companies or emerging market steel companies while benchmarking with global best practices. Also further avenues of studying the ESG reports of other international independent rating agencies will add robustness to the studies.
6. Research implications
The findings of the research have implications for various stakeholders. For a company that is truly on a sustainable path, the information quality framework as discussed in the paper offers a very good way and easier way of measuring ESG parameters with an outcome-based approach. The position-development-performance dimensions of the information quality framework attempts to depict a true picture of a company with sustainability view point. As can be observed, a company having higher scores on all the three dimensions of position, development and performance can really claim to have superior ESG performance.
This outcome-based approach used will be beneficial for companies to track sustainable development. Further, for investors, the ratings of independent rating agencies can be corroborated with the outcome-based approach to truly depict a company on a sustainable path and investors can then make well-informed choices. A firm whose reputation is well established in how it conducts its business can give an enhanced confidence to customers if it further show cases its performance in ESG matters with an outcome-based approach. Thus, the outcome-based approach is a good way forward to gain legitimacy in the business world and inspire confidence across various stakeholders to remain committed in companies that display enhanced ESG performance besides business results.
7. Policy implications
It is projected that Indian companies stand to lose 7.14 lacs (INR in crores) to the impact of climate change if they do not take mitigation measures over the next five years, according to the Carbon Disclosure Project’s (CDP) 2020 annual report [13], while at the same time the Indian Government has set a target to make India a $5 trillion economy by 2025. To meet its goals of net zero by 2070, India will need close to $10 trillion, according to an analysis by climate and energy research firm Council on Energy Environment and Water (CEEW). Though some major companies have taken the lead to go carbon neutral by 2030 or so, to achieve such environmental goals, the need of the support of companies beyond the top 1,000 listed seems inevitable.
The findings of the study have major policy implications. With the Indian Government having undertaken a preliminary base lining exercise of the UNSDG’s in India, with targets in place for 2030, there will be significant domestic and international stakeholder scrutiny on the delivery of the targets and an outcome-based approach would in a way become a handy tool for checking ESG performances by various agencies.
Through this framework, we could explain the improvements in performance of Tata Steel over a period of three years, which shows robustness of the framework in explaining ESG disclosures. Hence, government or other institutions can take the ESG framework just discussed and test it for other industries with a longitudinal time frame in mind. The framework stands out among other confusing frameworks where quality of data and quantity of data are not considered adequately for reporting performance. Hence, the ESG framework used in the study to come up with composite scores of performance can serve as a tool for policy-related issues in ESG.

