


The aim of this paper is to make a descriptive exploratory effort to discern the role of IT exports in India's macro-economic indicators, like national income, employment and balance of payment in the post-Liberalization, Privatization and Globalization strategy in the 1990s. The paper also explores the vital historical developments of various dimensions of IT, such as its export growth, major software and services exports destinations, compositions of IT exports and domestic growth in India.
This study is based on secondary data, which were collected from Balance of Payment Statistics Reserve Bank of India (RBI) and Handbook of Statistics on Indian Economy, National Association of Software and Service Companies (NASSCOM),rtd and Department of Electronics and Information Technology (DEITY). This study has used descriptive analysis and growth models for studying the objectives. Major IT sector dimensions, such as total output, exports revenue, domestic revenue, gross domestic product, employment and exports of the software and service industry, have been examined for the period 1991–2016.
The findings suggest that over the last 26 years, the information technology industry's economic footprint has extended by more than seven times. Over the same period, direct employment in the information technology sector increased at an average growth rate of around 17%. Software and services exports earn, on average, about three times greater than the other three major services of India's current account of the balance of payment.
This study focuses on originality in examining the role of IT exports in India's macro-economic indicators economic reforms of the 1990s and also explores the historical developments of various dimensions of IT exports and domestic growth in India. All the work has been done in original by the authors, and the work used has been acknowledged properly.
1. Introduction
During the period 1989–1990 to 2001–2002, the Indian software industry from a global perspective showed a remarkable growth rate, particularly in software and services exports. It had accomplished a 51% compound annual growth rate. The market share in the case of customized software, outsourced across borders, was strong at 18.5%. The growth rate of the software and services exports was much higher than the growth rate of the global industry. India, being the only nation in the world, had a growth rate of 50% in the software and service industry (Kumar, 2013). However, recently India's IT sector’s growth has been declining due to a global strategic paradigm shift in the technology and IT sector business. India's IT software and services exports are experiencing slowdown in growth, primarily due to its dependence on North American, European markets and also due the lack of upgrading of skills of the labour force to serve all stages of IT production domestically. Other developing countries, like China, the Philippines, Malaysia, Vietnam and Russia, are also offering same business proposition to them, which affected the growth process of the Indian IT industry to a large extent (Kathpalia and Raman, 2014).
Moreover, there is a shift in comparative advantage towards innovation, with more focus on products. Huge sector-level transformation called “standardized product” has emerged, which deals with a wide array of businesses. More advanced and specialized factor resources have been emerging from product development in the captive offshore centers, research and development (R&D) centers of transnational corporations, across all information technology clusters. While the larger players in the global markets deal with packaged software products with transactional logic labeled product business, the small and local software companies followed relational logic connected to more or less unique project deliveries. India's software export potential by looking at the structure of the global software and service market is confined to low-level works, such as coding, testing and maintenance. Besides, the growth possibilities of different types of IT companies are also quite different in India, shifting from services to productization is important to retain global power tag in IT for the future. India's software and services exports are highly skewed towards maintenance of software works and programming services. It lacks diversification in different types of export and hence relies mainly on IT service exports (Chandana and Jayachandran, 2001).
In order to compete in the global IT market and also to retain the growth of the diversified IT exports, the important question that emerges is how India will absorb strategic paradigm shifts related to IT industry? The managerial challenge for India's IT firms is how to capture IT product business with long-term customer-orientated relationship and manage the risks anticipated with foreign partners and customers. The need arises due to the failure to energize the capability building, which may have serious consequences on the growth of the IT industry (Mannermaa and Henrikki, 1999). Therefore, the present paper focuses on the following issues: (1) what are the historical episodes of key performance indicators of the IT industry, such as total output, domestic growth, export growth and employment growth, after the adoption of Liberalization, Privatization and Globalization strategy in 1990s?; (2) what is the position of IT exports in mitigating the deficit in India's current account of the balance of payment?; and (3) can India cultivate growth of labour-intensive information technology? If yes, how? If no, how can employment be provided to its abundant low-skill labour supply? These are some of the questions that need to be answered. It would be beneficial to the policy recommendations relating to these institutions and the government. Understanding of various key IT indicators would help to understand the impact of policy changes have had on the IT sector and the required policies to avoid any adverse impacts.
The structure of this paper is as follows: we first outline export and economic growth nexus; next, we show the data and methodology as well as the empirical results and findings. The analysis pertains to, first, IT industry and India's gross domestic product (GDP); second, exports revenues; third, export destinations of India; fourth, India and global services location index; fifth, components of service exports; sixth, growth of computer services and information technology enabled services (ITES) and/or business process outsourcing (BPO) services; and seventh, employment and India's IT sector. In the last section, we conclude.
2. Export and economic growth nexus
For over decades, economists have debated the nexus between international trade and economic performance in both developed as well as developing countries. While some are of the opinion that international trade leads to faster economic growth, others believe that protectionism may help in better economic growth. This debate continues even in a period when the world is passing through globalization. A large body of literature exists that supports a positive association between exports and economic growth, especially after the export success of East Asian Tigers (Hong Kong, Taiwan, Singapore and South Korea) during 1970s–1990s. Research studies claim a positive impact of export growth on economic performance through different avenues. For example, McKinnon (1964) and Chenery and Strout (1966) suggested that exports could enhance growth of an economy through easing out foreign exchange constraints. Krueger (1985) argued that export expansion led to access higher quality products, due to the availability of diverse international markets. Helpman and Krugman (1985) observed that export growth can enhance economies of scale of a nation amid expansion of market size and competitiveness of the export sector, which encourages efficiency in utilization of nation's resources. Increased export demand cultivates specialization, rise in entrepreneurship, management skills and techniques, and the redistribution of a country's resources from incompetent internal sector to the competent external sector, thereby improving productivity and output growth resulting from positive externalities of foreign sector (Lal and Rajapatirana, 1987; Kugler, 1991; Yaghmain, 1994; and Giles and Williamson, 2000). Abdulai and Jaquet (2002) stated that export-oriented technique of a labour-surplus economy allows the expansion of quick employment and real wages. Baharumshah and Rashid (1999) suggested that export growth of a country boosts total output by encouraging the accumulation of foreign exchange and foreign investments.
Empirical research studies that found positive relationship between total exports and economic growth include Smith (2001) in Costa Rica during the period 1950–1997, Lin and Li (2003) in China during 1981–2000, Awokuse (2002) in Canada during 1961–2000, Nath and Mamun (2007) in Bangladesh during 1971–2000, Jordaan and Eita (2007) in Namibia during 1970–2005, Mohan and Nanda (2007) in Kenya during 1970–1980, Halicioglu (2007) in Turkey during 1980–2005, Husein (2009) in Jordan during 1969–2005, Elbeydi et al. (2010) in Libya during 1980–2007, Velnampy and Achuthan (2013) in Sri Lanka during 1970–2010, Olubiyi (2014) in Nigeria during 1980–2012, Andrews (2015) in Liberia during 1970–2011, Faisal and Resatoglu (2017) in Saudi Arabia during 1968–2014, Bakari and Mabrouki (2017) in Panama during 1980–2015, Konstantakopulou (2016) in Organisation for Economic Co-operation and Development (OECD) countries during 1960–2012, Bakari (2017) in Japan during the period 1970–2015.
Similarly empirical studies that support positive association between exports and economic growth, exclusively in the case of India, include Bhattacharya and Mousumi (2009) during 1996–2008, Dawson (2005) during 1950–1999, Dash (2009) during 1992–2007, Pradhan et al. (2015) during 1970–1971 to 2009–2010, Kaur and Sidhu (2012) during 1996–1997 to 2008–2009, Jawaid and Raza (2013) during 1980–2010, Kumari and Malhotra (2014) during 1969–2012 and Rai and Jhala (2015) during 2000–2013.
Given the importance of exports and economic growth relation for both developed as well as developing countries, this paper makes an exploratory effort to discern the role of IT exports in India's macro-economic indicators, like national income, employment and balance of payment after the adoption of export-oriented strategy in the 1990s. The interest in monitoring current as well as historical developments of various dimensions of IT exports in India is mainly because of two reasons. First, the IT exports constitute a huge share in the total exports amounting to processed petroleum product export, which occupies the first place in overall Indian export. Therefore, any change in the position of IT exports via a change in external economic climate may have serious impact on India's balance of payment. Second, there is a need to understand the nature and compositions of information and technology and information technology enabled services (IT-ITES) exports amid swift changes in information technology across the globe led by research in computer applications. Therefore, an attempt has been made to examine the nature and understanding of complex Indian IT-ITES exports, its recent fall back and also to analyze its potential causes for policy making.
Secondary data have been used in this study, which were collected from Balance of Payment Statistics Reserve Bank of India (RBI) and Handbook of Statistics on Indian Economy, National Association of Software and Service Companies (NASSCOM) and Department of Electronics and Information Technology (DEITY). This study has used simple averages, ratios, percentages, graphs and growth models for studying the objectives. The trends in key IT sector variables, such as total output, exports revenue, domestic revenue, GDP, employment and exports of the software and service industry, have been examined for the period 1991–2016.
3. Empirical results and discussions
3.1 IT industry and India's GDP
Table 1 gives the share of IT industry in India's GDP during 1991–2017.
Share of IT industry as percentage of GDP in India: 1991–2017
| Year | IT sector revenue (bn Rs.) | Gross domestic product (bn Rs.) | IT revenue in GDP (percentage) |
|---|---|---|---|
| 1991 | 25.17 | 13,671.71 | 0.38 |
| 1993 | 47.61 | 15,223.43 | 0.62 |
| 1995 | 96.93 | 17,377.40 | 0.83 |
| 1997 | 179.85 | 19,570.31 | 1.2 |
| 1999 | 330.52 | 22,549.42 | 1.8 |
| 2001 | 625.84 | 24,749.62 | 2.7 |
| 2003 | 956.16 | 27,757.49 | 3.2 |
| 2005 | 1,713.1 | 32,530.73 | 4.3 |
| 2007 | 2,856.33 | 38,966.36 | 5.2 |
| 2009 | 3,225.8 | 45,160.71 | 6.0 |
| 2011 | 4,348 | 52,475.30 | 6.4 |
| 2013 | 6,428 | 87,363.29 | 8.0 |
| 2015 | 8,445.03 | 113,861.45 | 9.5 |
| 2017 | 11,356 | 130,108.43 | 7.7 |
Source(s): NASSCOM, various years
The contribution of IT industry to India's GDP increased from 0.38% in 1991 to 7.7% in 2017. The contribution made by IT sector has led to a steady growth of the Indian economy to a great extent, particularly during the early 1990s to around 2002. This period is also called the phase of export-led growth. During this period, the Indian software and services exports grew around 50%, accounting for more than 30% of the Indian total exports (Mitra, 2009). The Indian IT sector is regarded as a hub of innovation, providing world class software and services solution across the world. Various multinational corporations (MNCs), like Accenture and Google set up subsidiaries in India, due the availability of profit and cost incentives offered by the country's abundant skilled labour. The cost of IT software and services are lower in India than in the advanced countries, like the USA and the European nations. Hence, these developed countries have had been outsourcing IT software and services activities to India. This has transformed the country into a more knowledge-driven economy, by directly generating over 3.86million white-collar jobs in 2017 (Kathpalia and Raman, 2014). The share of IT revenue in GDP continuously increased year after year until 2015, reaching 9.5%. It is mainly because many Indian IT professionals were employed in developed countries, like the USA, Canada and the EU, especially after the new economic reforms in 1990s.
However, the contribution of IT industry to GDP has been declining during 2015–2017 from 9.5% in 2015 to 7.7% in 2017. Its main causes are: first, the country has been experiencing the heat of global economic slowdown in 2007, which had influenced the Indian IT sector badly. Second, the entry of other developing countries (like China and the Philippines) in the world market severely affected the growth of the Indian software and services exports. Third, swift technological shifts in IT industry have made Indian labour obsolete, due to a significant rise in expenditure in R&D in the IT industry across the globe. The growth of expenditure on technology related to IT industry around the developed world has increased to 6.0% in 2015 (NASSCOM, 2017). Further, the birth of new technologies in IT industry, like automation using robotic processes and artificial intelligence, has affected the hiring trend for India. All these remain the major drag factors, jointly exerting downward pressure on the pace of contribution of IT industry to India's GDP. Moreover, the protectionist policy adopted by the USA, the top export destination of India, contributing 60% of the software and services exports earnings from the country, has had serious repercussions on the exports of the IT industry in general.
3.2 Export revenues
Table 2 furnishes information on export, domestic and total revenue from the Indian IT sector, percentages of export and domestic revenues to total revenue, and their annual growth rates during 1991–2015.
Trends in export, domestic and total revenue of the Indian IT sector
| Year | Total IT revenue (bn Rs.) | Export revenue (bn Rs.) | Percentage of export revenue to total IT revenue | Growth rate of export revenue (%) | Domestic revenue (bn Rs.) | Percentage of domestic revenue to total revenue | Growth rate domestic revenue (%) |
|---|---|---|---|---|---|---|---|
| 1991 | 25.17 | 4.76 | 18.92 | – | 20.41 | 81.09 | – |
| 1992 | 34.55 | 9.31 | 26.95 | 95.59 | 25.24 | 73.06 | 23.67 |
| 1993 | 47.61 | 14.05 | 29.52 | 50.92 | 33.56 | 70.49 | 32.97 |
| 1994 | 69.38 | 19.82 | 28.57 | 41.07 | 49.56 | 71.44 | 47.68 |
| 1995 | 96.93 | 26.61 | 27.46 | 34.26 | 70.32 | 72.55 | 41.89 |
| 1996 | 132.39 | 46.52 | 35.14 | 74.83 | 85.87 | 64.87 | 22.12 |
| 1997 | 179.85 | 71.5 | 39.76 | 53.70 | 108.35 | 60.25 | 26.18 |
| 1998 | 239.56 | 107.52 | 44.89 | 50.38 | 132.04 | 55.12 | 21.87 |
| 1999 | 330.52 | 160.5 | 48.56 | 49.28 | 170.02 | 51.45 | 28.77 |
| 2000 | 545.65 | 298.96 | 54.79 | 86.27 | 246.69 | 45.21 | 45.10 |
| 2001 | 625.84 | 378.46 | 60.48 | 26.60 | 247.38 | 39.53 | 0.28 |
| 2002 | 747.87 | 478.35 | 63.97 | 26.40 | 269.52 | 36.04 | 8.95 |
| 2003 | 956.16 | 596.61 | 62.4 | 24.73 | 359.55 | 37.61 | 33.41 |
| 2004 | 1,265.11 | 810.23 | 64.05 | 35.81 | 454.88 | 35.96 | 26.52 |
| 2005 | 1,713.1 | 1,137.92 | 66.43 | 40.45 | 575.18 | 33.58 | 26.45 |
| 2006 | 2,236.07 | 1,498.23 | 67.01 | 31.67 | 737.84 | 32.99 | 28.28 |
| 2007 | 2,856.33 | 1,899.7 | 66.51 | 26.80 | 956.63 | 33.49 | 29.66 |
| 2008 | 3,412.93 | 2,344.17 | 68.69 | 23.40 | 1,068.76 | 31.32 | 11.73 |
| 2009 | 3,225.8 | 2,438.5 | 75.6 | 4.03 | 787.3 | 24.41 | −26.34 |
| 2010 | 3,561 | 2,638 | 74.09 | 8.19 | 923 | 25.92 | 17.24 |
| 2011 | 4,348 | 3,286 | 75.58 | 24.57 | 1,062 | 24.43 | 15.06 |
| 2012 | 5,281 | 4,074 | 77.15 | 23.99 | 1,207 | 22.86 | 13.66 |
| 2013 | 6,428 | 5,101 | 79.36 | 25.21 | 1,327 | 20.65 | 9.25 |
| 2014 | 7,578 | 6,128 | 80.87 | 20.14 | 1,450 | 19.14 | 9.27 |
| 2015 | 8,445.03 | 7,005.35 | 82.96 | 14.32 | 1,439.68 | 17.05 | −0.72 |
| Average growth during 1991–2015 | 2,175.28 | 1,622.97 | 56.79 | 35.71 | 552.32 | 43.23 | 19.72 |
Source(s): Constructed using the data from Dataquest and Electronics and Computer Software Export Promotion Council of India
Table 2 shows that total IT revenue increased from Rs. 25.17 bn in 1991 to Rs. 8,445.03 bn in 2015, growing at an average of Rs. 2,175.08 bn during the period. Export revenue from the sector increased from Rs. 4.76 bn in 1991 to Rs. 7,005.35 bn in 2015, at an average of Rs. 1,622.97 bn during the period with slight fluctuations.
The export revenue of the IT increased year by year, at an average growth of 35.71% during the same period. It may be observed that IT export revenue dominates total revenue during 1991–2015. One of the reasons why the IT exports constitute the largest segment, accounting for 62–66% of the total revenue, is due to the different nature of the Indian software industry, which is more service export oriented. India, being a strong player in IT-ITES services exports, exports to almost all the developed countries. It is the back-office of the entire developed countries, especially in case of business process management business. All these business activities are performed from India for the developed markets, like the USA and European countries (NASSCOM, 2017). This is mainly due to the difference in the labour cost between the developed and developing countries. Global IT firms hire labour from developing countries, like India, due to the availability of cheap labour supply. It is very cost effective for global companies to outsource work to India or to hire Indian IT professionals. Software companies from the USA, the largest software market in the world, are aware of the power of Indian IT professionals. The cost of providing IT software and services from India is approximately three to four times lower than in the USA (Arora and Athreye, 2002).
Domestic revenue from the IT sector shows relatively large year-wise fluctuations over the study period 1991–2015. It increased from Rs. 20.41 bn in 1991 to Rs. 1,439.68 bn in 2015, at an average of Rs. 1,439.68 bn during the period. The domestic revenue registered a miserable negative growth of 26.34% in the year 2009, because of the global economic slowdown. Besides, the domestic market in India is captured by multinational giants after the adoption of trade liberalization in the 1990s, against which its firms do not possess sufficient comparative advantage in the IT sector business. They do not have complete specialization in series of all these production stages of software development. They are concentrated in low-skill stages, like writing software codes and software testing required for software production, require relatively less skill and experience, but are more labour-intensive as compared to its earlier steps like specification and designing of software development (Kumar, 2013). The multinational firms are quite successful in catering to the needs and demands of providing software packages, windows software and application software for the end-users or end-customers, like banks, government organizations and households across the world. Whereas Indian IT firms are mostly involved in intermediary IT sector business, working as business-to-business (B2B) models. They mostly cater to the needs and demands of low value addition required for the IT industry, mainly focusing on exports of low-skill jobs for the IT MNCs across the globe (Heeks, 1998; Kumar, 2013).
Figure 1 shows the percentage growth rates in domestic, export and total revenue of the Indian IT sector during the period 2001–2016.
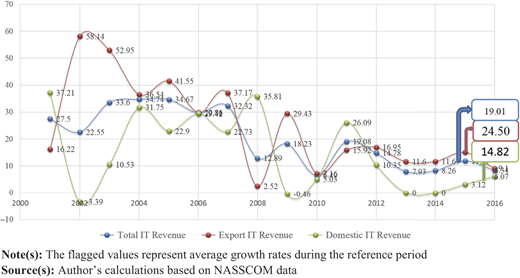
Figure 1 shows fluctuations in growth rates of IT sector export, domestic and total revenue during 2001–2016. The total revenue growth of IT sector was 27.50% in 2001, when the domestic revenue was at its peak (37.21 %). However, total revenue declined to 22.55% in 2002 due to severe competition from MNC giants (Kumar and Joseph, 2005), but it started increasing again and reached 33.6% in 2003. A low trough emerged during 2008–2010, corresponding to the global economic slowdown. It picked up slightly in 2011, increasing from 5.03% in 2010 to 19.92% in 2011. After the year 2011, the total revenue showed a moderate growth rate reaching 9.4% in 2016. Overall, the total IT sector revenue increased at an average growth rate of 19.01% during the study period 2001–2016.
The figure indicates that the share of export revenue dominates in the total IT sector revenue during the period 2001–2016. It increased at an average growth rate of 24.50% as compared to the average growth rate of domestic revenue at 14.82% during the same period. Export revenue from the IT sector demonstrates an increasing trend with slight fluctuations, whereas domestic revenue from the IT sector shows relatively larger year-wise fluctuations over the period 2001–2016. The reason for the large fluctuations in domestic revenue has been the entry of multinational firms into the domestic market (Kumar and Joseph, 2005).
3.3 IT software and services exports destinations of India
Global software market reached $US 1,400 bn in 2016. The share of India in it was nearly 10%. By 2016, Indian export of IT software and services reached 156 countries (NASSCOM, 2017). India is a preferred IT software and services destination, which can be observed from the number of countries to which it exports. Table 3 shows the IT software and services exports destinations of India in percentage share during 2007–2016.
IT software and services exports destinations: 2007–2016
| Export destination/Year | USA and Canada | Europe, including the UK | Australia and New Zealand | Asia | Rest of the world |
|---|---|---|---|---|---|
| 2007 | 64.0 | 26.6 | 1.5 | 4.0 | 3.8 |
| 2008 | 61.5 | 27.0 | 1.4 | 5.0 | 5.3 |
| 2009 | 61.9 | 26.5 | 2.3 | 4.9 | 4.4 |
| 2010 | 65.0 | 23.5 | 2.7 | 5.1 | 3.7 |
| 2011 | 64.3 | 23.3 | 3.5 | 5.2 | 3.7 |
| 2012 | 64.1 | 20.2 | 3.5 | 4.8 | 7.4 |
| 2013 | 62.7 | 24.4 | 3.9 | 5.7 | 3.3 |
| 2014 | 59.9 | 24.6 | 3.4 | 9.0 | 3.1 |
| 2015 | 61.7 | 23.5 | 3.4 | 8.4 | 3.0 |
| 2016 | 60.3 | 23.1 | 3.3 | 10.7 | 2.6 |
Source(s): RBI Annual Survey, various years
The USA, Europe and Canada are the major export destinations of IT software and services exports, accounting for 83.4% of its total exports in the year 2016. India is a preferred IT software and services destination for these developed countries, due to the cost advantages. The table shows that the Indian IT software and services exports are not diversified. It is highly skewed towards the USA, accounting for around 60% of the exports. Several factors are responsible for why the USA became the top export destination of India. First, being the world's largest software market, the USA accounted for almost 50% of the world's software sales in the 1990s. Second, IT firms from the USA made swift market integration as compared to other developed European counterparts, in order to avail the opportunity of labour arbitrage in India. Third, and most important, the USA made more liberal immigration laws for residence or work compared to other developed countries (Heeks, 1998). The shares of the USA and Canada decreased from 64% in 2007 to 60.3% in 2016. As a result, the dominance of the USA in terms of IT exports is jeopardizing the sustainability of the Indian IT software and services exports. It is mainly because, first, the US market concentration in global software market is gradually declining. Second, the USA has developed unwanted trade environment throughout the world, since the changes in the US administration after the recent presidential elections in November 2016. Third, recent US trade wars with its major trading economies, like China and India, and the probability of change in H1-B visa immigration norms may have a serious impact on the Indian IT software and services exports.
The share of Australia and New Zealand increased from 1.5% in 2007 to 3.3% in 2016. Asia's share in IT software and services increased from 4.0% in 2007 to 10.7% in 2016. The remaining percentage of exports is shared by the rest of the world.
Table 4 gives the composition of invoice currencies of IT software and services exports in India.
Currency composition invoice of IT software and services exports
| Year/Currency in bn | 2010 | 2012 | 2014 | 2016 | ||||
|---|---|---|---|---|---|---|---|---|
| Rs | $US | Rs | $US | Rs | $US | Rs | $US | |
| US dollar | 1,633.4 | 35.8 (75.3) | 2,507.8 | 46.1 (73.6) | 4,261.0 | 65.1 (73.9) | 4,754.3 | 70.9 (73.0) |
| Euro | 152.0 | 3.3 (7.0) | 243.4 | 4.5 (7.1) | 539.3 | 6.7 (7.6) | 466.6 | 7.0 (7.2) |
| Pound sterling | 212.9 | 4.7 (9.8) | 288.6 | 5.3 (8.5) | 438.0 | 8.2 (9.4) | 519.6 | 7.8 (8.0) |
| Australian dollar | 63.6 | 1.4 (2.9) | 143.0 | 2.6 (4.2) | 177.5 | 2.7 (3.1) | 191.0 | 2.8 (2.9) |
| Indian rupee | 28.3 | 0.6 (1.3) | 61.0 | 1.1 (1.8) | 75.0 | 1.1 (1.3) | 234.9 | 3.5 (3.6) |
| Other currencies | 79.9 | 1.8 (3.7) | 161.3 | 3.0 (4.8) | 272.3 | 4.2 (4.7) | 343.6 | 5.1 (5.3) |
| Total | 2,170.1 | 47.6 (100) | 3,405.2 | 62.6 (100) | 5,763.1 | 88.0 (100) | 6,510.0 | 97.1 (100) |
Note(s): Figures in parentheses are invoice percentages of the given currencies
Source(s): Constructed using RBI Annual Surveys, various years
It may be observed that US dollar has remained the leading invoicing currency for the IT software and services exports for India, followed by pound sterling and euro. Dollars share in absolute value reached $US 70.9 bn in 2016 from $US 35.8 bn in 2010. However, its share in percentages terms during the period 2010–2016 declined relatively from 75.3% in 2010 to 73.6 in 2012 and further to 73.0% in 2016.
The share of pound sterling as invoice currency for IT software and services exports reached $US 7.9 bn in 2016 from $US 4.7 bn in 2010. The share of euro as invoice currency stood at $US 7.0 bn in 2016, accounting for 7.2% of the total in the same year. Meanwhile, Euro invoices increased from $US 3.3 bn in 2010 to $US 7.0 bn in 2016. Whereas IT software and services exports invoicing in terms of Australian dollar and Indian rupee remained low, at 2.9 and 3.6%, respectively, in 2016. IT software and services exports invoicing represented by other currencies reached 5.3% in 2016.
3.3.1 India and global services location index
Table 5 examines the offshoring locations across the globe and ranks the top destinations for global offshoring for 2019.
Assessment of location attractiveness for global outsourcing hub: 2019
| Rank | Change in ranking from 2017 | Country | Financial attractiveness | People skills and availability | Business environment | Digital resonance | Total |
|---|---|---|---|---|---|---|---|
| 1 | 0 | India | 2.82 | 2.23 | 1.14 | 0.87 | 7.06 |
| 2 | 0 | China | 1.88 | 2.25 | 1.38 | 0.97 | 6.49 |
| 3 | 0 | Malaysia | 2.60 | 1.15 | 1.64 | 0.78 | 6.15 |
| 4 | 0 | Indonesia | 2.84 | 1.26 | 1.27 | 0.65 | 6.02 |
| 5 | +1 | Vietnam | 2.82 | 1.17 | 1.33 | 0.56 | 5.88 |
| 6 | +16 | USA | 0.40 | 2.34 | 1.89 | 1.21 | 5.83 |
| 7 | +1 | Thailand | 2.62 | 1.16 | 1.41 | 0.62 | 5.81 |
| 8 | +11 | UK | 0.85 | 1.84 | 1.95 | 1.14 | 5.79 |
| 9 | −4 | Brazil | 2.27 | 1.66 | 1.34 | 0.52 | 5.78 |
| 10 | −3 | The Philippines | 2.76 | 1.31 | 1.11 | 0.59 | 5.78 |
| 11 | +4 | Mexico | 2.36 | 1.31 | 1.48 | 0.56 | 5.71 |
| 12 | +13 | Estonia | 2.13 | 0.78 | 1.81 | 0.92 | 5.64 |
| 13 | −3 | Colombia | 2.50 | 1.16 | 1.42 | 0.53 | 5.60 |
| 14 | 0 | Egypt | 2.90 | 1.08 | 1.01 | 0.58 | 5.56 |
| 15 | +2 | Germany | 0.76 | 1.86 | 1.91 | 1.02 | 5.55 |
| 16 | +13 | Lithuania | 2.46 | 0.72 | 1.63 | 0.70 | 5.52 |
| 17 | −2 | Bulgaria | 2.47 | 0.73 | 1.61 | 0.61 | 5.42 |
| 18 | +5 | Russia | 2.25 | 1.23 | 1.23 | 0.68 | 5.39 |
| 19 | +1 | Peru | 2.61 | 0.98 | 1.35 | 0.43 | 5.37 |
| 20 | +4 | Ukraine | 2.90 | 0.87 | 1.01 | 0.58 | 5.36 |
| 21 | +7 | Latvia | 2.33 | 0.74 | 1.67 | 0.62 | 5.36 |
| 22 | −13 | Chile | 1.97 | 1.12 | 1.72 | 0.54 | 5.35 |
| 23 | +9 | United Arab Emirates | 2.09 | 0.76 | 1.78 | 0.72 | 5.35 |
| 24 | −12 | Poland | 2.05 | 1.11 | 1.56 | 0.63 | 5.35 |
| 25 | −14 | Sri Lanka | 2.94 | 0.85 | 1.08 | 0.46 | 5.34 |
| 26 | +10 | Portugal | 1.66 | 1.15 | 1.70 | 0.83 | 5.33 |
| 27 | +19 | Canada | 0.65 | 1.66 | 1.91 | 1.05 | 5.27 |
| 28 | −10 | Romania | 2.29 | 0.92 | 1.46 | 0.58 | 5.25 |
| 29 | +6 | Argentina | 2.21 | 1.28 | 1.26 | 0.49 | 5.25 |
| 30 | +4 | Mauritius | 2.30 | 0.75 | 1.60 | 0.59 | 5.24 |
| 31 | −5 | Hungary | 2.22 | 0.85 | 1.56 | 0.60 | 5.24 |
| 32 | −11 | Bangladesh | 2.90 | 1.01 | 0.89 | 0.43 | 5.22 |
| 33 | −17 | Czech republic | 1.95 | 0.93 | 1.68 | 0.64 | 5.21 |
| 34 | +13 | Singapore | 0.75 | 1.33 | 2.06 | 1.04 | 5.18 |
| 35 | +6 | Slovakia | 2.04 | 0.78 | 1.69 | 0.62 | 5.12 |
| 36 | −9 | Morocco | 2.52 | 0.78 | 1.36 | 0.47 | 5.12 |
| 37 | −7 | Pakistan | 2.85 | 1.08 | 0.68 | 0.48 | 5.09 |
| 38 | +2 | Panama | 2.30 | 0.65 | 1.54 | 0.59 | 5.07 |
| 39 | −2 | Turkey | 1.96 | 1.28 | 1.22 | 0.59 | 5.06 |
| 40 | +4 | Uruguay | 2.18 | 0.74 | 1.52 | 0.60 | 5.04 |
| 41 | +1 | France | 0.56 | 1.72 | 1.81 | 0.93 | 5.02 |
| 42 | +3 | Spain | 1.00 | 1.51 | 1.61 | 0.88 | 5.00 |
| 43 | −5 | Kenya | 2.46 | 0.76 | 1.12 | 0.63 | 4.98 |
| 44 | −13 | Costa Rica | 2.16 | 0.79 | 1.42 | 0.55 | 4.91 |
| 45 | −12 | Ghana | 2.57 | 0.73 | 1.07 | 0.47 | 4.84 |
| 46 | −7 | Trinidad and Tobago | 2.16 | 0.79 | 1.39 | 0.44 | 4.79 |
| 47 | +2 | Ireland | 0.57 | 1.37 | 1.86 | 0.92 | 4.72 |
| 48 | 0 | New Zealand | 0.93 | 0.91 | 1.96 | 0.76 | 4.56 |
| 49 | −6 | South Africa | 1.91 | 0.83 | 1.29 | 0.53 | 4.55 |
| 50 | 0 | Israel | 0.74 | 1.03 | 1.58 | 1.05 | 4.39 |
Note(s): Scores by Service Line
Source(s): A.T. Kearney Global Services Location Index 2016, www.atkearney.com
Asian countries have remained the best region in the world for global service locations, with India, China, Malaysia, Indonesia and Vietnam representing the top five ranks in the index. India is followed by China, Malaysia and Indonesia, which has remained stable since the 2017 year index. Thanks to the educational reforms and fiscal incentives by the Government of India, the country has retained the top offshoring destination. The availability of a huge number of private and public educational institutions, vast qualified engineers and enormous English-language speakers have been the major attractions of India (Heeks, 1998; Balakrishan, 2006). It may be observed from the table that India has been competitive in almost all the indicators of the index. However, it lags behind China in the case of indices of people's skills and availability, business environment and digital resonance, by a margin of 0.02, 0.24 and 0.1, respectively. Countries like Vietnam, the USA, Thailand, the UK, Mexico, Estonia, Germany, Lithuania, Russia, Peru, Ukraine, Latvia, United Arab Emirates, Portugal, Canada, Argentina, Mauritius, Singapore, Slovakia, Panama, Uruguay, France, Spain and Ireland are improving their location attractiveness over time. These countries are showing fast improvements in their global ranking since the 2017 year global services location index. The USA, the UK, Estonia, Lithuania, Canada and Singapore have shown fast improvements in the indicators of the index and have improved by more than ten places in the ranking as compared to the 2017 year index. Russia, Latvia, United Arab Emirates, Portugal, Argentina and Slovakia have improved by more than five places during the same period. Nations like Ukraine, Mauritius and Uruguay improved four places. Mexico, Germany, Panama and Ireland showed an improvement of two places. Whereas nations like Vietnam, Thailand, Peru and France showed improvement of one place from the 2017 years index.
Global ranking of nations like Brazil, the Philippines, Colombia, Bulgaria, Chile, Poland, Sri Lanka, Romania, Hungary, Bangladesh, Czech Republic, Morocco, Pakistan, Turkey, Kenya, Costa Rica, Ghana, Trinidad and Tobago, and South Africa have declined over the 2017 year index. The rankings of Hungary and Kenya each fell by five places, and Pakistan and Trinidad and Tobago each tumbled by seven places. The rankings of the Philippines and Colombia came down by a margin of three. The rankings of Chile, Poland, Sri Lanka, Bangladesh, Czech Republic, Singapore, Costa Rica and Ghana dived by more than ten places. Whereas the global ranking of countries like China, Malaysia, Indonesia, Egypt, New Zealand and Israel have remained the same over the 2017 index.
3.4 Components of service exports
Computer Software and IT-enabled services have been emerging as an important component in the current account of the balance of payment in India, which has led to significant net exports. According to the current account balance of payment statistics, India's software services exports stood at Rs. 4,854.6 bn in 2015, which accounted for 48% of its total services exports and 3.6% of GDP (RBI, 2016). The exports of software services are further divided into two major categories: (1) computer services exports, which comprises IT services and software product development, and (2) ITES/BPO services, including engineering services. The importance of IT-ITES subsector has been increasing substantially. Before 1999–2000, software services were merged together with other services like finance, communications and business. The exports of software, travel, transportation and insurance were reported under the category of invisible in the current account of the balance of payment. After 2000, the RBI reported the values of software services separately. India's total export IT and ITES services by Mode 1, Mode 2 and Mode 4 are estimated at $US 88.0 bn during 2015–2016, growing at an annual average growth of 14% during the last three years.
Software services are broadly divided into two major components: (1) computer services and (2) ITES/BPO services. They have emerged as significant contributors of foreign exchange in India.
Table 6 shows the composition of service exports from India during the period 2000–2016.
Composition of service exports: 2000–2016
| Year | Software services ($US million) | Travel services ($US million) | Transportation services ($US million) | Insurance services ($US million) | Total services ($US million) |
|---|---|---|---|---|---|
| 2000 | 6,341 (52.18) | 3,497 (28.78) | 2,046 (16.84) | 270 (2.23) | 12,154 |
| 2001 | 7,556 (57.50) | 3,137 (23.88) | 2,161 (16.44) | 288 (2.20) | 13,142 |
| 2002 | 9,600 (60.70) | 3,312 (20.94) | 2,536 (16.04) | 369 (2.34) | 15,817 |
| 2003 | 12,800 (59.64) | 5,037 (23.47) | 3,207 (14.95) | 419 (1.96) | 21,463 |
| 2004 | 17,700 (59.16) | 6,666 (22.29) | 4,683 (15.66) | 870 (2.91) | 29,919 |
| 2005 | 23,600 (60.77) | 7,853 (20.22) | 6,325 (16.29) | 1,062 (2.74) | 38,840 |
| 2006 | 31,300 (63.12) | 9,123 (18.40) | 7,974 (16.08) | 1,195 (2.41) | 49,592 |
| 2007 | 40,300 (63.67) | 11,349 (17.93) | 10,014 (15.82) | 1,639 (2.59) | 63,302 |
| 2008 | 46,300 (66.22) | 10,894 (15.58) | 11,310 (16.75) | 1,422 (2.04) | 69,927 |
| 2009 | 49,705 (66.87) | 11,859 (15.96) | 11,178 (17.97) | 1,591 (2.14) | 74,333 |
| 2010 | 53,100 (62.41) | 15,793 (18.57) | 14,246 (16.76) | 1,945 (2.29) | 85,084 |
| 2011 | 62,212 (61.27) | 18,462 (18.19) | 18,241 (17.97) | 2,632 (2.60) | 101,546 |
| 2012 | 65,867 (63.69) | 17,999 (17.41) | 17,334 (16.76) | 2,227 (2.15) | 103,427 |
| 2013 | 69,483 (65) | 17,922 (16.77) | 17,380 (16.26) | 2,121 (1.99) | 106,906 |
| 2014 | 73,108 (64.63) | 20,334 (17.98) | 17,485 (15.46) | 2,202 (1.95) | 113,130 |
| 2015 | 74,153 (66.55) | 21,268 (19.09) | 14,004 (12.57) | 2,002 (1.80) | 111,428 |
| 2016 | 73,651 (64.08) | 23,244 (20.23) | 15,851 (13.79) | 2,206 (1.92) | 114,952 |
Note(s): Figures in parentheses are percentages
Source(s): Constructed using Balance of Payment Statistics, RBI
Software service exports increased significantly from $US 6,341million in 2000 to $US 73,651million in 2016 in total service exports in the current account of balance of payment. Software services comprise a larger share (64.08% in 2016), as compared to travel (20.23% in 2016), transportation (13.79% in 2016) and insurance exports (1.92% in 2016) in the balance of payment in India during 2000–2016. The share of travel service exports stood at $US 23,244million in 2016. Travel service exports increased from $US 3,497million in 2000 to $US 23,244million in 2016. Transportation service exports show a relatively moderate increase from $US 2,046million in 2000 to $US 15,851million in 2016. Whereas insurance service exports comprise the lowest share in total service exports as compared to other components of balance of payment. Its exports increased from $US 270million in 2000 to only $US 2,206million in 2016. Thus, it may be observed from the table that software services exports have increased significantly as compared to travel, transportation and insurance service exports in the current account of the balance of payment in India during the period 2000–2016.
Figure 2 shows percentage composition of service exports during 2000–2015 at five year interval.
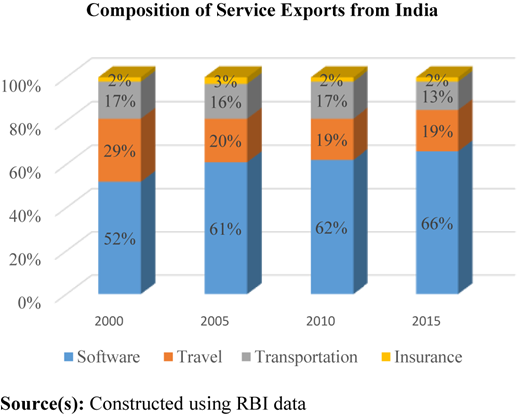
Figure 2 shows that the share of software services has been increasing rapidly in the total services from 52% in 2000, to 61% in 2005, 62% in 2010 and further to 66% in 2015. The share of travel service exports has been declining from 29% in 2000 to 20% in 2005, and remained at 19% each during 2010 and 2015, respectively. The share of transportation service export also shows a decline from 17% in 2000 to 13% in 2015, whereas the share of insurance service exports remained almost stable around 2.0% during the period 2000–2015. The lower proportion of the last three components in total services since 2000 is mainly due to the growing share of software services in total services over time.
Figure 3 shows export of computer and ITES/BPO services during the period 2010–2015.
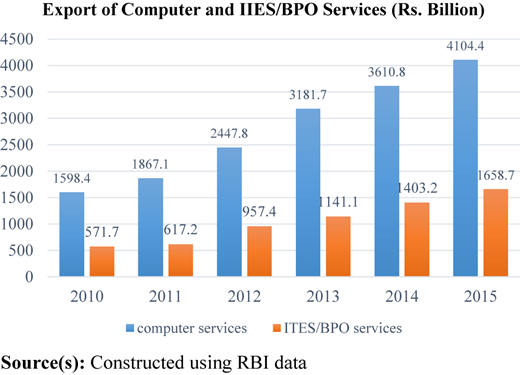
Figure 3 shows that computer services exports continues to be the dominant component of India's software services exports during the period 2010–2015. Its value increased from Rs. 1,598.4 bn in 2010 to Rs. 4,104.4 bn in 2015. Similarly, the ITES/BPO services exports also continued to rise during the period, increasing from Rs. 571.7 bn in 2010 to Rs. 1,658.7 bn in 2015. Indian software and services firms are highly dependent on these kinds of exports, concentrating mainly on intermediary selling or value addition of IT-ITES, especially since the economy started integrating with the world economy after the new economic reforms. Moreover, developed countries, like the USA and EU, also started benefiting from the human resources in India post-liberalization, turning India into an outsourcing hub, covering almost 56% of the BPO global market.
The Department of Information Technology (DIT) has further subdivided IT software and services exports into four components, viz., IT services, software product development, BPO services and IT engineering services. Table 7 presents the component-wise distribution of Indian IT software and services exports during 2008–2016.
Components of IT software and services exports
| Components (Rs. bn)/year | 2008 | 2009 | 2010 | 2011 | 2012 | 2013 | 2014 | 2015 | 2016 | Average growth rate |
|---|---|---|---|---|---|---|---|---|---|---|
| IT services | 942.09 (67.20) | 1,070.43 (64.01) | 1,115.8 (60.75) | 1,492.2 (68.77) | 1,661.8 (66.90) | 2,256.7 (66.29) | 2,936.7 (67.94) | 3,399.7 (67.81) | 3,862.8 (67.03) | 20 |
| Software product development | 132.29 (9.44) | 149.13 (8.92) | 150.8 (8.21) | 106.2 (4.90) | 205.3 (8.27) | 191.1 (5.62) | 245.0 (5.67) | 211.1 (4.22) | 241.6 (4.20) | 13 |
| BPO services | 282.68 (20.17) | 383.44 (22.93) | 431.3 (23.48) | 468.7 (21.60) | 523.0 (21.06) | 789.6 (23.19) | 934.1 (21.61) | 1089.2 (21.73) | 1336.8 (23.20) | 23 |
| Engineering services | 44.94 (3.21) | 69.40 (4.15) | 139.0 (7.57) | 103.0 (4.75) | 94.2 (3.80) | 167.8 (4.93) | 206.9 (4.79) | 314.0 (6.27) | 321.9 (5.59) | 35 |
| Total IT software and services exports | 1402.0 (100) | 1672.4 (100) | 1836.9 (100) | 2170.1 (100) | 2484.3 (100) | 3405.2 (100) | 4322.8 (100) | 5014.0 (100) | 5763.1 (100) | 20 |
Note(s): Figures in brackets are percentage
Source(s): Constructed using RBI data
It may be observed that value of total IT software and services exports increased from Rs. 1,402.0 bn in 2008 to Rs. 5,763.1 bn in 2016 during the study period, at an annual average growth rate of 20%. The contribution of computer software services (divided into IT services and software product development) increased from Rs. 1,074.38 bn to Rs. 4,104.4 bn, respectively, during the period 2008-2016. Among the computer software services, IT services export is dominant, which increased significantly to Rs. 3,862.8 bn in 2016, as compared to Rs. 942.09 bn in 2008, at an average annual growth rate of 20%. On the other hand, software product development shows a moderate annual growth rate of 13%, its absolute value increasing from Rs. 132.29 bn to Rs. 241.6 bn, respectively, during the same period. India's IT software and services exports are highly skewed towards IT and BPO services, sharing almost 90% of revenue in total. Software development, which requires relatively high skill as compared to the other components, has not grown significantly. It is mainly because Indian IT industry is more service export-oriented, mostly satisfying the needs of low skill jobs for the developed countries, like the USA and the European countries (Kathpalia and Raman, 2014).
The table also shows that BPO services recorded a notable growth rate of 23% during 2008–2016. Its exports increased remarkably from Rs. 282.68 bn in 2008 to Rs. 1,336.8 bn in 2016. Engineering services recorded an impressive growth rate of 35% during 2008–2016, with its exports increasing from Rs. 44.94 bn in 2008 to Rs. 321.9 bn in 2016. This is mainly due to the availability of large educational institutions, vast qualified engineers, enormous English-language speakers, all-encompassing education system, accommodating nature of the IT workforce, expertise in working with global IT companies, offering of diverse range of IT services, offering 24*7 services, greasing of time zone differences among the top export destination countries, high credibility and reliability, infrastructure, and the policy incentives offered by the Government of India. The country shares the top offshoring destination as per the global service index 2017, covering 56% of the global BPO market, with the presence of around half of the world's back offices in the country (NASSCOM, 2017).
3.5 Growth of computer services and ITES/BPO services
Computer services and ITES/BPO services have emerged as significant contributors to current account of the balance of payment, by way of earning foreign exchange reserves for the Indian economy. The RBI has been releasing data on these services export under the Balance of Payment Statistics since 2000. In order to get valid information on the importance of these service exports in mitigating the deficit in India's current account of the balance of payment, a comparative analysis of its major service components, such as software, travel, transportation and insurance of the balance of payment have been estimated using growth trend model during the period 2000–2016.
Growth trend models have been estimated to examine the relative performance of exports of components of the current account of the balance of payment. The model furnishes a comparative analysis in the four main service components of the current account, viz., software services, insurance, transportation and travel services. It also helps to draw inferences about the relative stability of each component on the basis of standard deviations. Hence, growth trend model has been used for comparative purposes (Gujarati, 1995). The general form of the model can be expressed as:
where,
lxt = natural log of component-wise exports;
α1 = intercept;
α2 = coefficient of time variable;
t = trend variable, in years (1, 2… n); and
et = error term.
The slope coefficient estimates the percentage change in exports for a given change in the value of the regressor. If its coefficient is positive, ít indicates overall growth in exports. If the trend coefficient is negative, then it indicates an overall decline in exports.
Software service, transportation, travel and insurance receipts of the current account are prone to volatile widely over time. It may be unwise to arrive at any conclusion regarding the instability/volatility of these components on the basis of averages only. Wide fluctuations in these components over time may bring anxiety to India's current account of the balance of payment. Hence, it might be helpful for the purpose of policy making to examine which of these components are more stable/unstable than the other. For this purpose, we have used the usual measure of the coefficient of variation (CV). The component-wise CVs are calculated separately for each given component. The formula for calculating CV is as follows:
where, σ = SD; and X = mean
The growth trends in exports of various components in the current account of the balance of payment (i.e., software services, transportation, travel and insurance services) and their respective CV are presented in Table 8.
Estimates of growth of software services
| S. No. | Dependent variable | Coefficient | SE | Prob | CV |
|---|---|---|---|---|---|
| A | Log of software service (LS) | ||||
| C | 8.93 | 0.01 | 0.00 | 8.24 | |
| Trend | 0.16 | 0.14 | 0.00 | ||
| B | Log of travel (LT) | ||||
| C | 8.04 | 0.08 | 0.00 | 7.41 | |
| Trend | 0.13 | 0.00 | 0.00 | ||
| C | Log of transportation (LTR) | ||||
| C | 7.70 | 0.01 | 0.00 | 8.75 | |
| Trend | 0.14 | 0.01 | 0.00 | ||
| D | Log of insurance (LIN) | ||||
| C | 5.80 | 0.17 | 0.00 | 10.99 | |
| Trend | 0.13 | 0.01 | 0.00 |
Note(s): CV = Coefficient of variation; S.E. = standard error; Prob = Probability
It may be observed from the table that software service increased at an annual rate of 16%, while that of travel rose at 13% during the study period 2000–2016. Transportation and insurance increased at an annual rate of 14 and 13%, respectively, during the same period. The relative growth performance of software services shows huge improvement compared to the other components of the current account. Thus, software services receipts have increased in importance and are becoming the most important component of the current account. The growth rate of software service predicts a great opportunity for reducing the deficit in the current account of the balance of payment.
The CV shows that insurance is a highly unstable item (CV is 10.99), followed by transportation (CV is 8.75), and software service (CV is 8.24). Meanwhile, travel is more stable (CV is 7.41). Travel receipts increased due to the number of foreign visitors, which makes it highly volatile in nature as compared to the other sub-components. This indicates that software services exports are relatively less volatile on the basis of low CV, and hence, requires strong interventions on the part of the policy recommendation to uplift or stabilize the country's current account of the balance of payment.
3.6 Employment in the Indian IT sector
The unemployment problem of educated people in India has been reduced to a considerable extent by the Indian IT sector. The number of IT professionals is increasing sharply year after year. According to DEITY (DEITY, 2016), it is the largest private employer in the country and has catalyzed the growth of several ancillary industries, such as transportation, real estate, catering and security. The total employment in the Indian IT sector was estimated to touch 3.7million, and the indirect employment generated by the sector to about 10million in 2015–2016.
Table 9 gives details on total employment and its growth rate in the IT sector during 1991–2016.
Growth of direct employment: 1991–2016
| S. No. | Year | Employment (in thousands) | Growth (%) |
|---|---|---|---|
| 1 | 1991 | 72 | – |
| 2 | 1992 | 83 | 15.28 |
| 3 | 1993 | 90 | 8.44 |
| 4 | 1994 | 118 | 31.12 |
| 5 | 1995 | 140 | 18.65 |
| 6 | 1996 | 160 | 14.29 |
| 7 | 1997 | 180 | 12.50 |
| 8 | 1998 | 210 | 16.67 |
| 9 | 1999 | 250 | 19.05 |
| 10 | 2000 | 280 | 12 |
| 11 | 2001 | 430 | 53.58 |
| 12 | 2002 | 520 | 20.94 |
| 13 | 2003 | 670 | 28.85 |
| 14 | 2004 | 830 | 23.89 |
| 15 | 2005 | 1,060 | 27.72 |
| 16 | 2006 | 1,290 | 21.70 |
| 17 | 2007 | 1,630 | 26.36 |
| 18 | 2008 | 2,000 | 22.70 |
| 19 | 2009 | 2,200 | 10 |
| 20 | 2010 | 2,300 | 4.55 |
| 21 | 2011 | 2,770 | 20.44 |
| 22 | 2012 | 2,960 | 6.86 |
| 23 | 2013 | 3,130 | 5.75 |
| 24 | 2014 | 3,520 | 12.47 |
| 25 | 2015 | 3,500 | −0.57 |
| 26 | 2016 | 3,700 | 5.72 |
| Overall 1991–2016 | – | 16.88 |
Source(s): NASSCOM, various years
In absolute figures, excluding hardware, direct employment in IT sector increased from 72,000 in 1991 to 3,700,000 in 2016. It has increased significantly at an average growth rate of 16.88% during the same period. The growth rate of employment in the sector has remained quite impressive, growing at double digits until 2007. The year 2001 witnessed the highest growth in direct employment (53.58 %) in the sector. The Indian IT experts have effectively reacted to the expanding demands for IT software and services, both qualitatively and cost-effectively in the software market. Eventually, this has helped India to end up as the best performer among the developing countries (Manoj, 2007). But this rapid pace in employment growth in IT industry became moderate during the period 2008–2016. The global economic recession in 2008 in the USA, the largest IT software and services exports destination, had a negative impact on the Indian IT sector. The hiring pace of labour declined during 2008–2010. After that, the absolute employment figures of the sector showed continuous rise until 2014, but its growth rate decreased and turned down to −0.57 % in 2015. Besides global economic recession in the US, there have been other major factors which led to significant decline in the growth rate of employment in recent years. Continuous technological shifts in the information technology are the major reasons for the rising demand for skilled labour, more than that of the semi-skilled labour.
With automation, it is now possible to perform repetitive and low-skill jobs, which has had adverse impact on the low-skilled labour of the Indian IT sector. New technologies now have made it possible that a single person can control ten to fifty servers. The hiring of labour, which was increasing year after year in the IT sector, is now turning downwards due to the introduction of new technologies, like automation, cloud and artificial intelligence in the IT industry. The industry is hiring lesser labour; IT firms are performing low-skilled jobs via automation, and hence making their existing labour more productive and efficient by increasing more control on servers per person. Also, the emphasis has been shifting to new niche areas, like artificial intelligence and cloud computing. Workers skilled in these areas are now in high demand. As a result, the others, particularly the engineering graduates, IT diplomas and Bachelor of Computer Application (BCA) holders, who were in demand after the globalization, are now finding hurdles in getting a job (NASSCOM, 2017).
4. Conclusion
This study presented a rigorous descriptive analysis of economic effects emerging from the extraordinary dissemination of information technology throughout the Indian economy after the economic reforms of the 1990s. Vital historical developments of various dimensions of IT, such as its export growth, export destinations and domestic exports growth in India, have been reported.
Over the last 26 years, the information technology industry's economic footprint has extended by more than seven times, from 0.38% of India's GDP in 1991 to 7.7% of GDP in 2016 or some $US 117 bn. Direct employment in the information technology sector increased at an average growth rate of 16.88%, from 72,000 employers in 1991 to 3,700,000 employers in 2016. Moreover, software and services exports earn, on average, about three times greater than other three major service components of Indian current account of the balance of payment. The growth rate of software service exports predicts a bright future for mitigating deficit in the current account or addressing the unmet needs of the balance of payment, and hence, requires special attention on the part of the Indian policymakers.
However, Indian IT software and services exports are highly skewed towards the USA, accounting for 60% of the exports. As a result, the dominance of the USA in terms of IT exports is jeopardizing the sustainability of Indian IT software and services exports. It is mainly because first the USA's market concentration in the global software market is gradually declining. Second, the USA has developed an unwanted trade environment throughout the world, since the changes in the US administration after the recent presidential elections in November 2016. Third, the recent US trade wars with its major trading economies, like China and India, and the probability of change in H1-B visa norms may have a catastrophic impact on Indian IT software and services exports.
Furthermore, multinational firms are highly concentrated in the domestic market, following the adoption of trade liberalization policies in the 1990s. These firms are quite successful in catering to the needs and demands of providing software packages, windows software and application software for the end-users or customers, like banks, government organizations and households across the world. Firms from India are mostly involved in intermediary business, working as a B2B model, which mostly cater to the needs and demands of low value addition required for the IT industry, mainly focusing on exports of low-skill jobs for the IT MNCs across the globe.
Notes
The Indian IT software and services succeed because of the supply of talent, connection to outside world and freedom of entrepreneurs to experiment, in which India has been doing a great job in meeting the requirements of global IT firms related to the IT industry. The country has succeeded in IT software and services because of its entrepreneurs and open connection to world economy. India started the globalization process in the 1980s, due to which it was well prepared in the 1990s when the IT boom opened the window of opportunities. The USA, the largest software and services market in the world, diversified business opportunities by utilizing India's skilled labour. The American MNCs played a role in showing that India has great IT software and services work talent. Both American and Indian entrepreneurs availed this opportunity by leveraging their business operations. India became one of the largest IT capital of the modern world, with all the top IT firms in the world present in the country. The city of Bengaluru is known as the Silicon Valley of India due to its dominance in exports, accounting for 77% of the total revenue from the Indian IT industry. The tremendous increase in share of IT industry to India's GDP after the 2000s was due to the amalgamation of both natural and other creative factors by the Government. The availability of a large number of private and public educational institutions, vast output of IT professionals, and enormous English-language capability have remained the real point of attraction over other developing countries like China, Malaysia and the Philippines, especially during the 2000s. Various other factors, like entry of American MNCs into the Indian market, the policy initiatives adopted by the Government of India in the form of globalization in 1980s, building of software and technology parks (STPs) in 1991 in metropolitan cities under the Ministry of Electronics and Information Technology (MEITY), the tax incentives offered to the Indian software producers, and most important, the swiftly growing external demand for software and services after the 1990s, opened enormous business opportunities for the economy. All these factors led to a significant increase in incomes and standard of living of millions of IT professional workers, who were eventually responsible for raising the share of IT industry in the country's national income (Kathpalia and Raman, 2014).
Software development is usually divided into a series of standardized production stages, from analysis and specification of software requirements, design of software, writing codes and testing of software, to software delivery and installation.
H1-B visa is an immigrant visa under the Immigration and Nationality Act in the USA, which permits the US companies to employ overseas workers on temporary basis in specialty occupations, like information technology. The top Indian IT companies, like Tata Consultancy Services (TCS), Infosys and Wipro, which jointly account for more than 55% of the industry’s revenue, are the major beneficiaries of H1-B visa program offered by the USA. Therefore, software and services exports of these IT companies may be affected severely by any policy or market change in USA (RBI 2017 and NASSCOM, 2017).
According to the Manual on Statistics of International in Trade in Service (MSITS 2002), trade in services can be carried out through four different modes, viz.: (1) transactions between members from one territory to another, covering cross-border supply (Mode 1); (2) in the territory of one member to the service consumer of any other member, consumption abroad (Mode 2); (3) by a service supplier of one member in the territory of any other member, i.e., commercial presence (Mode 3); and (4) by a service supplier of one member in the territory of any other member through the presence of natural person (Mode 4) (Reserve Bank of India, 2016).
Period of analysis (2000–2016) was dictated by data availability for composition of services exports, particularly for software services.
Period of analysis (2008–2016) was dictated by data availability for components of IT software and services exports.
For example, software development is usually divided into various production stages, from analysis and specification of software requirements, design of software, writing codes and testing of software, to software delivery and installation. Generally, software development is a skill undertaking, but this fragmentation frames the basis for a skill division of labour. This is because early stages of software development, like analysis and designing of software, require a higher level of skill and learning as compared to later stages of software development. Coding, testing and installation are relatively less skill-intensive, but more labour-intensive in nature. The average engineering graduates, IT diplomas and BCA holders with capability in programming dialects can effectively perform these low-skill tasks. Whereas early stages like analysis and designing of software require colossal aptitude and experience. In order to meet the labour requirements for the software and related service works which are more labour-intensive, Indian abundant IT skilled labour got employed significantly by the software producers in advanced countries, especially the USA and European nations. Indian IT expert's professionals, mostly the IT diplomas, engineering graduates and BCA holders, are concentrated in low-skill stages, like writing software codes and software testing required for software production, which requires relatively lower level of skill and experience, but more labour-intensiveness as compared to the earlier steps, like specification and designing of software development. However, in the most recent couple of years, new advancements and developments in the IT division are making these Indian low-skilled labour redundant (NASSCOM, 2017). Skilled labour had been one of the main comparative advantages of the country in the global software and service market, particularly during 1990–2001.

