

This paper examines the relationship of financial market inclusion, economic growth, foreign direct investment and real output on trade openness for the Saudi Arabia Economy. Trade openness potentially is a major source of economic growth and development.
This study is the first employing mixed methods and approaches of autoregressive distributed lag (ARDL) to estimate the long-run and short-run models for the Saudi Arabia Economy.
The results indicate that the inclusion of financial markets has an important role in the short term and has an effect on trade openness on this economy.
These results listed are only implications for decision-makers to achieve their objectives. Indeed, to have better economic growth, economic and financial decision-makers can rely on financial inclusion and trade openness.
This article investigates an approach testing the relationship of variables in a short and long term by using annual data from 1990 to 2017 for the Saudi Arabia economy. This paper tests the relationship between finance and economy with an econometric model.
1. Introduction
Financial inclusion is defined as the supply of new financial and banking services whose costs are low for consumers in difficulty and therefore excluded from traditional services. This inclusion has become an important phenomenon for economic and financial decision-makers to plan strategies for achieving sustainable growth.
Several authors have argued that financial inclusion is an engine of economic growth. Let us cite for example Schumpeter's previous approach which demonstrated that the financial sector with its services not only contributes to the accessibility of capital formation but also encourages efficiency and investment which in turn increases production and ultimately stimulates economic growth. In line with the growth of the economy, the banking sector appears to be more precise and profitable because it encourages capital accumulation and attracts business competition between banks, which translates into more investment and growth in its outfit.
The term “financial inclusion” has received a lot of attention since the 1990s as the issue of economic and financial policymaking requires an evolution in financial inclusion. According to several studies and authors, this phenomenon has significant positive effects on macroeconomic factors.
Naceur and Samir (2007) studied the relationship between financial inclusion and economic growth for 11 countries in the Middle East and North Africa (MENA) region. The empirical result of this study showed that the development of banks had a negative effect on economic growth. Regarding this result, Naceur and Samir (2007) interpreted that the underdeveloped financial systems in the MENA region slow economic growth.
Moreover, Pradhan et al. (2016) examined the causal interaction of insurance market penetration, broad money, market capitalization and economic growth with a focus on the Association of Southeast Asian Nations (ASEAN) Regional Forum (ARF). As a result of the analysis, they revealed that all the variables are cointegrated and mutually causal. This study concluded that there is a short-term two-way causality between the insurance market and economic growth. On the other hand, Boukhatem (2016) found that in 67 low- and middle-income countries, over the period 1988–2012, improved financial development has a direct effect on poverty reduction. In other words, an increase in the money supply or bank credit contributes to improving the well-being of the poor and a growth in financial transactions leads to the opportunity for asset accumulation and regular consumption.
In other recent works, several studies have shown relationships between financial inclusion and openness. Among the authors are the studies of Mbutor and Uba (2013), Hasanul and Kabir Hassan (2021), Mehrtora and Yetman (2015), Gnangnon (2019) and Sha'ban et al. (2020).
Theoretical works have presented positive relationships between trade openness and growth in many countries. The results are divergent according to the level of development of the countries (Gwaindepi et al., 2014). The link between economic growth and trade openness and financial inclusion is theoretically controversial (Zahonogo, 2017). The literature has shown that trade openness can improve economic development by mediating the country's financial inclusion. Moreover, these results are favorable thanks to the diffusion of knowledge and the diffusion of technologies (Grossman and Helpman, 1991; Rivera and Romer, 1991; Barro and Sala-i-Martin, 1997; Keho, 2017; Makina and Walle, 2019). In addition, Zahonogo (2017) further argues that the benefits of openness are not, however, automatic according to the level of economic development.
Many studies suggest that financial inclusion is a prerequisite for economic growth (Evans, 1997). Countries with low gross domestic product (GDP) per capital seem less financially inclusive (Sarma and Pais, 2011). The theoretical literature shows that (1) financial inclusion improves trade openness (Rabia Jagadish, 2019); (2) trade openness can have a positive or negative impact on economic growth and (3) financial inclusion can have a positive or negative impact on economic growth. What have not been demonstrated in the literature that this study seeks to show are (1) the impact of financial inclusion on trade openness and (2) the role of financial inclusion in improving the impact of trade openness on economic growth.
According to the positive results which have affected the economic growth, several economies have advanced programs and visions of improvements in financial services called financial inclusion. Among the countries, we will focus on Saudi Arabia. The choice of this country is dependent on the fact that it has a major trade opening, especially through the export of oil and the importation of non-oil goods. This country has long since launched programs to improve financial services. Ibrahim (2013) examined the link between financial growth and economic expansion in Saudi Arabia over the 20-year period using the fully modified ordinary least squares (FMOLS) approach. The results showed that domestic bank credit to the private sector has a negative short-term effect but a considerable and favorable long-term effect on economic growth.
The main purpose of the study is to investigate the short- and long-run effects of various macroeconomics variables on trade openness in Saudi Arabia. This paper is organized as follows: Section 2 provides econometric method. Section 3 contains data description and empirical results. Finally, the last section contains the conclusion remarks.
2. Data and methodology
2.1 Model specification
The main purpose of the current study was to investigate the effect of imports, remittances and foreign direct investment on economic growth in Saudi Arabia. On the basis of accessibility of data, aggregate imports, remittances inflow and net inflow of foreign direct investment were utilized in the analysis. Empirical execution will be based on using observations during the 47-year period from 1970 to 2017. The model specification for the econometric analysis is shown in Eq. (1):
where
LnTO is the log of economic integration (dependent variable)
LnGDP is the log of real GDP
LnIN is the log of financial inclusion
LnFD is the log of financial development.
The GDP, financial inclusion and financial development are the explanatory variables. Also all the indicators were sourced from World Bank (2018).
2.2 Estimation methodology
The estimation methodology will be done in several stages (Keshmeer, 2018): first, it starts with the study of the stationarity of the variables. The next step is based on results of unit root test (stationarity) because it will be the choice of technique of estimation (Gujarati and Porter, 2009). We find many econometric techniques such as FMOLS and the recently designed autoregressive distributed lag (ARDL) procedure. The ARDL method of cointegration was designed by Pesaran et al. (2001). There are several advantages of the ARDL method. First, it is possible to test the cointegrating association between the variables regardless of different orders of integration (Pesaran et al., 2001).
This technique, the ARDL, is appropriate to test long-run associations among the series if the sample period is small and it can also correct for probable endogeneity (Pesaran et al., 2001). Therefore, this paper used the ARDL procedure for long-run cointegration and estimation analysis if the series were nonstationary. This will be examined in the following results. Also the ARDL was applied recently in the same country, Saudi Arabia, by Jamel (2022) in the sukuk market development.
2.3 Cointegration analysis (ARDL)
The bound F-test for cointegration is within the ARDL methodology. The ARDL method is a two-step technique. To examine the presence of long-run cointegration, Eq. (1) is rearranged as an unrestricted error correction model (UECM) in the ARDL framework as Eq. (2):
where is the difference operator and represents short-term dynamics. The parameters attached along with one-period lagged variables measure long-term relationships. If the null proposition of zero cointegration is discarded, the existence of the long-term cointegration relationship is established.
The bound F-test procedure is about imposing restrictions on long-run parameters using the Wald coefficient restrictions check and obtaining the Wald F-statistics. This F-statistic is compared against the lower and upper band critical values calculated by Pesaran et al. (2001). There could be three probable outcomes in relation to cointegration amid the variables. When the estimated F-statistic surpasses the upper band critical value, then the null proposition can be rejected in favor of the alternative hypothesis.
If the expected F-statistic is less than the lower band critical value, then the null proposition cannot be discarded. When the estimated F-statistic is in between the lower and upper band critical values, then the outcome is inconclusive. Narayan (2004) argued that a critical value of Pesaran et al. (2001) is for large sample studies and using it for small sample studies may give misleading results. Narayan (2004) calculated a new set of critical values based on small samples. Since our sample size was not very large, we used Narayan's (2004) critical values. Thus, the estimated F-statistics were evaluated against the critical values calculated by Narayan (2004) to ascertain the long-term relation between the series. The succeeding step examined the ARDL model to obtain long-run estimates. The long-term parameters can be computed based on the ARDL unrestricted regression estimates by dividing the coefficients of individual explanatory variables with lag one coefficient of the response variable and multiplying it by minus one (Fahmida and Mazbahul, 2012). Finally, the error correction short-run model was estimated. The short-run error correction model (ECM) is used to identify short-run dynamics and to verify the robustness of the estimated coefficient of long run with respect to Eq. (2). It is specified as shown in Eq. (3):
where ECM represents the error correction item. The ECM was computed from the long-term estimated parameters in Eq. (2). The error correction term was expected to be significant and negatively associated with the dependent variable.
3. Results
3.1 Unit root test result
As a first step, the likely nonstationary concern was addressed using a standard augmented Dickey–Fuller (ADF) test even though the ARDL technique does not necessitate prior checking of the unit root issue. In the empirical analysis, it is essential to undertake this test to ascertain that variables do not have a unit root problem and their integration order is not more than one.
The ADF unit root test, showed in Table 1, was performed on two groups, being constant and constant with trend. The results indicated that the variables in the levels were stationary with the exception for GDP and REM which were stationary at the first difference. The order of integration was not greater than one, which is important for long-term cointegration analysis.
Unit root test
| Null hypothesis: the variable has a unit root | |||||
|---|---|---|---|---|---|
| At level | |||||
| LNTO | LNGDP | LNIN | LNFD | ||
| With constant | t-statistic | −1.6678 | −0.5589 | −4.3550 | −2.2133 |
| Prob | 0.4388 | 0.8677 | 0.0014 | 0.2051 | |
| n0 | n0 | *** | n0 | ||
| With constant and trend | t-statistic | −1.6657 | −2.8985 | −4.1234 | −2.1779 |
| Prob | 0.7463 | 0.1746 | 0.0129 | 0.4873 | |
| n0 | n0 | ** | n0 | ||
| Without constant and trend | t-statistic | −0.7894 | 0.2260 | 1.7932 | −3.0040 |
| Prob | 0.3673 | 0.7463 | 0.9805 | 0.0037 | |
| n0 | n0 | n0 | *** | ||
| At first difference | |||||
|---|---|---|---|---|---|
| d(LNTO) | d(LNGDP) | d(LNIN) | d(LNFD) | ||
| With constant | t-statistic | −4.6038 | −3.8549 | −4.4191 | −5.6640 |
| Prob | 0.0007 | 0.0056 | 0.0012 | 0.0000 | |
| *** | *** | *** | *** | ||
| With constant and trend | t-statistic | −4.5432 | −4.3576 | −3.1339 | −6.0704 |
| Prob | 0.0046 | 0.0074 | 0.0154 | 0.0001 | |
| *** | *** | ** | *** | ||
| Without constant and trend | t-statistic | −4.6038 | −3.9084 | −4.1995 | −5.0525 |
| Prob | 0.0000 | 0.0003 | 0.0001 | 0.0000 | |
| *** | *** | *** | *** | ||
Note(s): a: * significant at the 10%; ** significant at the 5% and *** significant at the 1%
To ensure the existence of long-term relationship between the variables, we rely on Table 2. The results of this table show that the F-statistic of 4.79 was higher than the upper band critical value of 4.66 at the 1% significance level. Hence, the null hypothesis of zero cointegration was rejected. This means that there is a long-term relationship between variables studied.
3.2 ARDL estimates
In the previous section, we examined cointegration and found that the series were cointegrated in the long term. The following step will verify the ARDL model and the associated long-term relationship between the economic integration, inclusion, financial development and economic growth. We will analyze the estimation of the model in the long term. This will be the subject of the next paragraph on Table 3.
Long-run coefficients
| Variables | Calculated long-run coefficient | Prob |
|---|---|---|
| Dependent variable is LNTO | ||
| LNGDP | −0.052050 | 0.6781 |
| LNIN* | 0.893675 | 0.0030 |
| LNFD** | 0.549676 | 0.0201 |
Note(s): * and ** represent significance level at one and five percent, respectively
Based on Table 3, the results show the long-term relationships between trade openness, imports and remittances. Indeed, the explanatory variables have different impacts: for the positive relations one, we find that the financial development (FD) and the financial inclusion have an important effect on long-term trade openness.
But in examining these relationships on short run, we will refer to Table 4.
Short-run error correction model
| Variable | Coefficient | T-ratio | P |
|---|---|---|---|
| Panel A | |||
| D(LNGDP) | 0.779865 | 3.858702 | 0.0006 |
| D(LNGDP(-1)) | 0.515616 | 2.543017 | 0.0170 |
| D(LNIN) | 0.428292 | 1.992595 | 0.04465 |
| D(LNIN(-1)) | 0.561635 | 2.885137 | 0.0076 |
| ECM(-1)* | −0.305950 | −4.966032 | 0.0000 |
| Panel B: Reliability check | |||
| R-squared | 0.676913 | ||
| DW statistic | 1.964022 | ||
| Serial correlation | 2.25 (0.9792) | ||
| Normality | 0.973 | ||
| Heteroscedasticity | 5.42 (0.0132) | ||
Note(s): * and **represent significance level at 1 and 5%. In panel B, figures in the parentheses are the p-values
The results show that in the short term, the coefficients of the variable (GDP) have a positive and insignificant sign. Indeed, the economic growth has a positive effect on trade openness. As for the variable financial inclusion (IN), it has a positive and significant effect on the dependent variable.
In addition, it is found that the coefficient of the restoring force toward equilibrium ECM (−1) = −0.305950 is negative and significantly different from 0 at the threshold of 5%. There is therefore an error-correcting mechanism. The error correction model is validated. This coefficient, which expresses the degree with which the variable y (economic integration) will be biased toward the long-term target, is estimated to be −0.305950 in our ARDL model, reflecting an adjustment to the long-term target relatively quickly.
The negative sign on the error correction term confirms the expected convergence process in the long-term dynamics. In fact, 30.59% of last year's imbalances are corrected during the current year, suggesting a good speed of adjustment in the relationship process following a shock last year (see Figure 1).
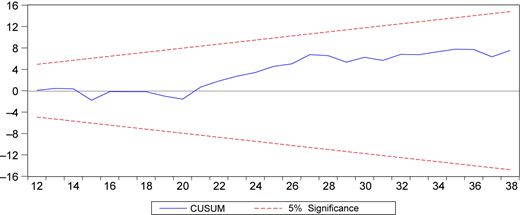
According to the figure of the Cumulative Sum (CUSUM) test performed by the software EViews, we find that the recursive residuals always remain in the interval for the confidence threshold of 5% so that the coefficients are stable over time, so we reject the hypothesis’ structural change.
4. Conclusion and implications
The purpose of this article is to examine the relationship of financial market inclusion, economic growth, foreign direct investment and real output on trade openness for the Saudi Arabia Economy. The analysis was based on annual macroeconomic data between 1980 and 2017. In addition, focusing on the Saudi economy, this article is the first to contain the recent ARDL technique used to understand these relationships.
On the basis of several stages, the results obtained using this technique have shown that financial market inclusion, economic growth and financial development have different effects on the long- and short-term trade openness of Saudi Arabia.
First, it was found that in the short term, financial inclusion and economic growth had significant positive effects on trade openness. On the economic and financial plan, the development of financial services can be a pillar of trade openness growth: Saudi Arabia has developed financialization programs. This initiative contributes to the promotion of innovation in the delivery of financial and digital payment services and assists financial institutions and financial technology companies to experience their innovative products with reduced controls, which will have a positive impact on the financial sector to improve and facilitate transaction procedures, reduce the cost and enhance financial inclusion. One of the important outcomes was allowing the bank account to be opened electronically without the need to visit bank branches and allowing the use of digital portfolios that enable customers to carry out financial operation via a mobile phone. This reduction in costs makes it possible to achieve economies of scale and to become internationally competitive. This contributes to a greater trade opening of the country.
Second, the results of the article showed that long-term financial inclusion and financial development have positive effects on trade openness. This is an extension of the positive effects of the short term. Indeed, financialization improves financial development and especially transactions. Thereafter, the international transactions improve because of the reduction of costs and delays, which increases the attractiveness of customers and therefore a greater trade openness. Based on these results, we recommend that Saudi Arabia attracts investment by strengthening financial inclusion, which has multiple effects in the short and long term.
All these aforementioned results are only implications for decision-makers to achieve their objectives. Indeed, to have better economic growth, economic and financial decision-makers can rely on financial inclusion and trade openness.
Finally, these results concern a single country which is Saudi Arabia; we cannot generalize the results except that we use the same data and the same methodology and apply it to a panel of similar countries, for example, the Gulf countries.
