


The purpose of this paper is to study whether switching trading venues create value in the Hong Kong stock market.
By using an event study, the paper investigates the abnormal returns (AR) earned by firms in the Growth Enterprise Market (GEM) relating to switching to the Main Board (MB). Two measures, turnover of the stock and Amihud’s (2002) illiquidity ratio, are used to examine the liquidity effects.
The switch is accompanied by a long-term increase in stock price for low liquidity firms only. High liquidity firms underperform with persistent negative excess returns after switching, while the transient negative excess returns in low liquidity firms reverse gradually. The results further show a significant increase in trading activity for low liquidity firms following the switch, while there is a significant decline in both trading activity and liquidity in firms with high liquidity. The overall results suggest that moving from GEM to the MB is beneficial to low liquidity firms but detrimental to high liquidity firms.
This study is the first to investigate whether moving from GEM to the MB creates value in the Hong Kong stock market.
1. Introduction
Trading venue choice has drawn significant attention in recent years. Considerable evidence from the United States shows that positive abnormal announcement returns resulted when firms switched from Nasdaq/Amex to NYSE and from Amex to Nasdaq (Sanger and McConnell, 1986; Kadlec and McConnell, 1994; Tse and Devos, 2004; Jain and Kim, 2006). The positive announcement effect is mainly attributable to the enhanced liquidity and lower trading costs after switching the trading venues (Amihud and Mendelson, 1986, 1988; Merton, 1987). Kadlec and McConnell (1994), Elyasiani et al. (2000), Tse and Devos (2004), and Jain and Kim (2006) find that firms that switched from Nasdaq/Amex to NYSE experienced higher trading volume and lower bid-ask spread.
Outside of the U.S. market, Lamba and Ariff (1997) investigated firms (involuntary) switched from Section 2 to Section 1 of the Tokyo Stock Exchange (TSE) and find that firms with lower liquidity in Section 2 have the most to gain in price and trading activity. Bacmann et al. (2002) study the market reaction when stocks from a lower segment switch to the main segment in the French Stock Market. Liao and Yu (2013) study Taiwan firms moving from the GreTai Securities Market (GTSM) to the Taiwan Stock Exchange (TSE). They find that the stocks earn abnormal positive returns, and the liquidity of the stocks improves after the switch.
More recent studies focus on the corporate governance aspect of exchange listing (Coffee, 1999; Stulz, 1999). They propose the “bonding effect” by listing on an exchange with higher regulatory standards (e.g., the NYSE and the Main Market of the LSE) and a firm can signal to investors that it is committed to higher standards of disclosure and corporate governance, thereby justifying a lower cost of capital. Carvalho and Pennacchi (2012), Jenkinson and Ramadorai (2013), Campbell and Tabner (2014), and Kim (2014) find that firms moving to more regulated markets experience positive announcement returns and an increase in trading volume. Interestingly, Park et al. (2016) find that Korean firms experience deterioration in trading-related market quality (increase in bid-ask spread and decrease in volume) following the switch from KOSDAQ to the more regulated KOSPI.
Hong Kong stock market has ranked fifth and third in the world and in Asia, respectively[1]. Due to different structures and characteristics across various markets, extending this area of research to the Hong Kong stock market is thus of value, and as far as the authors are aware, this study is the first to do so. Like other markets, increasing stock liquidity is a typical motive quoted by the management of firms in Growth Enterprise Market (GEM) to switch to the Main Board (MB). Therefore, the authors investigate the market reaction to switching announcements and the post-switching price effects, and also examine whether there are any changes in trading activity and liquidity following the switch. The results show that market reactions to the switch announcement depend on the liquidity of GEM firms. High liquidity firms have no significant market reaction around the announcement. On the contrary, low liquidity firms experience a much larger positive market reaction. The results also show that the switch is accompanied by a long-term increase in stock price only for low liquidity GEM firms. High liquidity firms underperform with persistent negative excess returns after moving to the MB, while low liquidity firms reverse the transient negative excess returns gradually. The results further show a significant increase in trading activity following the switch for low liquidity firms while there is a significant decline in both trading activity and liquidity in firms with high liquidity. Therefore, management and investors should be cautious that moving to the MB is beneficial for low liquidity GEM firms but detrimental to high liquidity firms.
2. The structure of the Hong Kong stock market
The Hong Kong Stock Exchange (HKEx) operates two markets on which firms may choose to list their shares: the Main Board (MB) and Growth Enterprise Market (GEM). The two markets are segmented completely from each other. Each market targets different types of firms and has different listing requirements. It is unambiguous that the MB is more highly regulated than GEM.
Table I shows a brief comparison of the listing requirements between the MB and GEM during the sample period in this study[2]. In brief, the MB has a higher profit or other financial standards requirements for firms to raise funds in the market. Both the MB and GEM are employed in the same order-driven auction system—Automatic Order Matching and Execution System (AMS) without the involvement of dealers or market makers. Different from the U.S. stock exchanges where NYSE-listed firms can list concurrently on the NASDAQ (e.g., APA), firms cannot be dually listed on both the MB and GEM.
Selective comparison between the Main Board and GEM
| Main Board | GEM | |
|---|---|---|
| Financial Requirements: | A Main Board new applicant must have a trading record of not less than three financial years and meet one of the following three financial criteria: Profit test, market cap/revenue test or market cap/ revenue/cash flow test | A GEM new applicant must have an operating cash flow of at least HK$20 million in aggregate for the two financial years |
| Operating history and management: | A Main Board new applicant must have a trading record period of at least three financial years | A GEM new applicant must have a trading record of at least two full financial years |
| Minimum market capitalization: | HK$200 million | HK$100 million |
| Market capitalization of public float: | HK$50 million | HK$30 million |
| Spread of shareholders: | The publicly held equity securities should have at least 300 shareholders | The publicly held equity securities should have at least 100 shareholders |
| Listing fee:* | Initial listing fee (HK$): | Annual listing fee (HK$): |
| Minimum: 150,000 | Minimum: 100,000 | |
| Maximum: 650,000 | Maximum: 200,000 | |
| Annual listing fee (HK$): | Initial listing fee (HK$): | |
| Minimum: 145,000 | Minimum: 100,000 | |
| Maximum: 1,188,000 | Maximum: 200,000 | |
Notes: *For transfer from GEM to the Main Board, the initial listing fee payable by a GEM listed issuer is at a 50 percent discount
Source: http://www.hkex.com.hk/eng/listing/listreq_pro/ListReq.htm, retrieved on May 12, 2017
With effect from 1 July 2008, GEM has been repositioned as a second board and a stepping stone toward the MB. Different from the involuntary switching procedure in the Japanese stock market, there is no automatic transfer mechanism from GEM to the MB. A GEM firm can apply for a transfer of listing to the MB, and the relevant conditions, requirements, and procedures are set out in the Main Board Listing Rules Chapter 9A—Transfer of listing from GEM to Main Board. In brief, it requires that a GEM-listed issuer meets the Main Board admission criteria, has been listed on GEM for a full financial year, and is not a subject of disciplinary investigations by the Exchange for serious or potentially serious rule breaches during the preceding 12 months[3].
3. Sample and data
The initial sample consists of 101 GEM firms that switched to the MB during 2002–2016. The announcement date of a GEM firm switching application and the effective date of the switch to the MB are both of interest. The authors collect the effective dates of GEM firms switched to the MB from the HKEx Fact Books and check back the announcement dates of the application for the switch to the MB from HKExnews (http://www.hkexnews.hk/index.htm). Daily data on stock price, trading volume, number of shares outstanding, and Hang Sang Index are collected from Thomson Datastream.
The final sample is constructed after some firms are excluded due to the following reasons. Six GEM firms with less than a year of trading history before applying for the switch to the MB are excluded. Second, five firms having less than 50 days of price and volume data during the estimation period (from 150 days to 26 days before the announcement) are also excluded. Finally, after excluding four firms having at least five consecutive nontrading days over days −20 to +20 around the announcement and the actual switching days, there are 86 firms in the final sample.
4. Methodology
4.1 Stock price reaction on the switch announcement
To investigate the stock price reaction on the switch announcement, the authors applied an event study method similar to that of Clyde et al. (1997). The pre-event period is [A − 150, A − 26], where A is the announcement day. The two event windows [A − 1, A] and [A − 1, A + 1] are employed. The [A − 1, A] window is applied because early private or insider trading may not be impossible in Hong Kong. The [A − 1, A + 1] window is used to investigate whether investors react to the announcement immediately.
The authors compute the returns and market-adjusted returns for the sample GEM firms. Return for a firm on day t is defined as , where Pit is the closing price of firm i on day t. The market-adjusted return (AR) for a firm on day t is calculated as follows:
where Rmt is the market return on day t. The Hang Seng Index is used to adjust the stock return[4].
The average abnormal return (AAR) for day t in the event window is computed by averaging all individual-adjusted returns for that day as follows:
The cumulative abnormal return (CAR) is then calculated as follows:
where t1 and t2 are the beginning and the end of the period of interest. The significance of the abnormal returns is measured by a t-test based on the standard deviation of mean market-adjusted returns for the pre-event period.
4.2 Liquidity measures
The authors further investigate whether there are any changes in the various liquidity measures of the firms after the switch to the MB. Liquidity measures in the pre-event period are treated as the benchmarks for comparison with those in the post switching period [S + 10, S + 134], where S is the effective switch day. Two liquidity measures are used. The first is the turnover ratio of the firm, which is the trading volume divided by the number of outstanding shares. The second liquidity measure is the illiquidity ratio (ILLQ) proposed by Amihud (2002) as follows:
where Rit is the return of firm i on day t, VOLDit is the daily dollar trading volume of firm i on day t, and Dt is the number of trading days in the period. The lower the ILLQ is, the greater is the liquidity of the stock.
5. Empirical results
5.1 Stock price reaction on the switch announcement
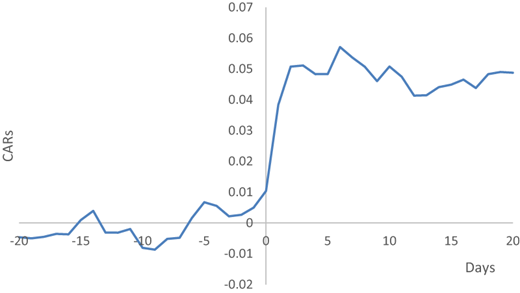
Figure 1 shows the reaction around the switch announcement period [A − 20,A + 20]. A large price increase around the announcement can be clearly observed.
The market reaction around the switch announcement day
The market reaction around the switch announcement day
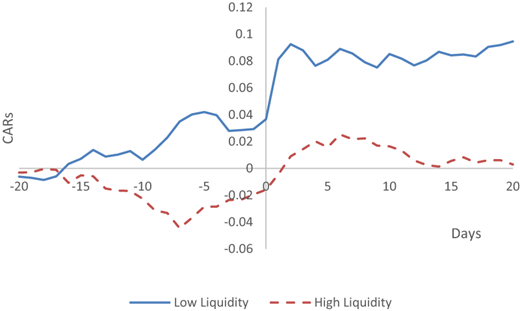
However, combining the results across all GEM firms may result in the loss of important information. The authors, therefore, divide the sample into low and high liquidity groups based on the turnover ratio. Each group has 43 firms. Figure 2 shows that the reaction around the announcement period for firms based on different liquidity. The reaction for firms with low liquidity is much more prominent in comparison to firms with high liquidity. The authors, therefore, further investigate whether the market reaction differs for firms with low and high liquidity.
The market reaction around the switch announcement day: Low liquidity firms versus High liquidity firms
The market reaction around the switch announcement day: Low liquidity firms versus High liquidity firms
For testing the significance of the result, the two event windows [A − 1, A] and [A − 1, A + 1] are employed to investigate the market reaction around the announcement day. Table II reports the average of market-adjusted CAR around the switch announcement. In Panel A, the CAR of 86 GEM firms over the interval [A − 1, A] is 0.77 percent. The t-statistic is 1.25, which is insignificant at conventional levels. The result implies no leakage of information before the announcement. Consistent with previous studies that the trading venue switching increases the share value, and the authors find that there is a positive market reaction around the announcement. The CAR over the interval [A − 1, A + 1] is 3.57 percent. The t-statistic is 4.72, which is highly significant at the 1 percent level.
Price reaction around the switch announcement day
| CAR | t-stat | |
|---|---|---|
| Panel A: All firms | ||
| [−1,0] | 0.0077 | 1.25 |
| [−1,1] | 0.0357 | 4.72*** |
| Panel B: Low liquidity firms | ||
| [−1,0] | 0.0081 | 1.02 |
| [−1,1] | 0.0527 | 5.41*** |
| Panel C: High liquidity firms | ||
| [−1,0] | 0.0073 | 0.75 |
| [−1,1] | 0.0188 | 1.56 |
Notes: *** indicate significance at the 1 percent level
Panel B and C show the CARs over the interval [A − 1, A] for firms with different liquidity. The CARs are 0.81 percent and 0.73 percent for low and high liquidity firms, respectively. All results are insignificant at the conventional levels. Again, the results imply no leakage of information before the announcement. Like prior studies (Baker and Edelman, 1991, 1992; Edelman and Baker, 1993), the results show that positive market reactions to the switch announcement depend on the liquidity of the firms. Panel B shows that GEM firms with low liquidity experience a much larger positive market reaction around the switch announcement. The CAR over the interval [A − 1, A + 1] is 5.27 percent and the t-statistic is 5.41, which is highly significant at the 1 percent level. On the contrary, high liquidity firms have no market reaction around the switch announcement. Panel C shows that the CAR over the interval [A − 1, A + 1] for high liquidity firms is 1.88 percent, and the t-statistic is 1.56, which is insignificant at the conventional levels. Hence, the results are consistent with the prior studies that firms with low liquidity benefit more from the switch in trading venue, and the market reaction is more prominent.
5.2 The gross and net effects
Prior studies report that abnormal returns tend to be positive during the interval between the announcement and the actual switch. For instance, Sanger and McConnell (1986), Kadlec and McConnell (1994), and Jain and Kim (2006) find that the firms that switched to NYSE earn positive abnormal returns during the interval between the announcement and the effective days. Similar to prior studies (Sanger and McConnell, 1986; Kadlec and McConnell, 1994; Jain and Kim, 2006; Devos et al., 2014), the authors estimate the gross and net effects by calculating the CAR from one day before the announcement to one day after the switch, i.e., [A − 1, S + 1] and the CAR from one day before the announcement to ten days after the switch, i.e., [A − 1, S + 10], respectively. Table III reports gross and net effects. In Panel A, the gross and net effects of the whole sample are 12.82 percent and 8.04 percent, respectively. The t-statistics are 4.76 and 2.62, respectively, which are significant at least at the 5 percent level.
The gross and net effects
| CAR | t-stat | |
|---|---|---|
| Panel A: All firms | ||
| Gross effect | 0.1282 | 4.76*** |
| Net effect | 0.0804 | 2.62** |
| Panel B: Low liquidity firms | ||
| Gross effect | 0.1961 | 5.95*** |
| Net effect | 0.1371 | 3.34*** |
| Panel C: High liquidity firms | ||
| Gross effect | 0.0603 | 1.50 |
| Net effect | 0.0237 | 0.53 |
| Panel D: Low liquidity versus high liquidity | ||
| Gross effect | 2.61*** | |
| Net effect | 1.87** | |
Notes: The gross and net effects are calculated by the CAR from one day before the announcement to one day after the switch, i.e., [A − 1, S + 1] and the CAR from one day before the announcement to ten days after the switch, i.e., [A − 1, S + 10], respectively. **, *** indicate significance at the 5 percent and 1 percent levels, respectively
Again, the results show that the effects depend on the liquidity of the firms. GEM firms with low liquidity experience significant positive effects. Panel B reports that the gross and net effects for low liquidity firms are 19.61 percent and 13.71 percent, respectively. The t-statistics are 5.95 and 3.34, respectively, which are significant at the 1 percent level. The results imply that the switch to the MB is accompanied by a persistent increase in stock price for GEM firms with low liquidity. By contrast, high liquidity firms experience insignificant gross and net effects. Panel C shows that the gross and net CARs for high liquidity firms are 6.03 percent and 2.37 percent, respectively. However, all CARs are insignificantly different from zero at conventional levels. Based on two-sample t-tests, both the gross and net CARs for low liquidity firms are significantly positive and greater than those of high liquidity firms at the 5 percent level. These results are consistent with the hypothesis that the switch to the MB had a positive impact on the GEM firm’s value, in particular, to those firms with low liquidity.
5.3 Post-switching stock price performance
Some previous studies find that firms earn insignificant abnormal CAR after moving the trading venues (Baker and Edelman, 1990, 1991; Kadlec and McConnell, 1994; Bacmann et al., 2002; Liao and Yu, 2013; Park et al., 2016) while others report negative post-switching CAR on firms (Sanger and McConnell, 1986; McConnell and Sanger, 1987; Baker and Edelman, 1992; Dharan and Ikenberry, 1995; Lamba and Ariff, 1997). More recent evidence shows that the post-switching performance depends on the regulatory standards of the markets. Firms generate negative (positive) post-switching abnormal returns after they move to more (less) regulated markets (Jenkinson and Ramadorai, 2013; Campbell and Tabner, 2014).
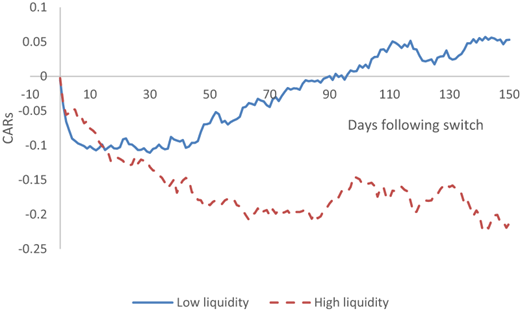
Figure 3 shows that high liquidity firms experience persistent price decline and negative CAR for 150 days after the switch to the MB. By contrast, the CAR for low liquidity firms drops sharply from the switch day but increase gradually. The CAR eventually fully reverses the negative price reaction and becomes positive for low liquidity firms.
The post-switching CARs: Low liquidity firms versus High liquidity firms
The post-switching CARs: Low liquidity firms versus High liquidity firms
Table IV reports the significance of the post-switching CAR of GEM firms. The results find that, in general, GEM firms earn significant negative abnormal returns after moving to the MB. The CAR is negative (−12.3 percent) for 60 days after the switch, and the t-statistic is −3.62, which is significant at the 1 percent level. The negative CAR then becomes insignificant.
Post-switching CARs after moving to the MB
| All firms | Low liquidity firms | High liquidity firms | ||||
|---|---|---|---|---|---|---|
| CAR | t-stat | CAR | t-stat | CAR | t-stat | |
| [0,5] | −0.0709 | −6.63*** | −0.0935 | −6.79*** | −0.0483 | −2.85** |
| [0,10] | −0.0883 | −6.10*** | −0.1012 | −5.43*** | −0.0755 | −3.29*** |
| [0,20] | −0.1111 | −5.55*** | −0.1026 | −3.98*** | −0.1197 | −3.77*** |
| [0,30] | −0.1210 | −4.97*** | −0.1106 | −3.53*** | −0.1314 | −3.41*** |
| [0,40] | −0.1260 | −4.50*** | −0.0943 | −2.62** | −0.1576 | −3.56*** |
| [0,50] | −0.1272 | −4.08*** | −0.0678 | −1.69 | −0.1866 | −3.78*** |
| [0,60] | −0.1234 | −3.62*** | −0.0586 | −1.33 | −0.1883 | −3.48*** |
| [0,90] | −0.0918 | −2.20 | 0.0004 | 0.01 | −0.1839 | −2.79** |
| [0,120] | −0.0782 | −1.63 | 0.0298 | 0.48 | −0.1862 | −2.45** |
| [0,150] | −0.0799 | −1.49 | 0.0530 | 0.77 | −0.2128 | −2.50** |
Notes: **, *** indicate significance at the 5 percent and 1 percent levels, respectively
Different results are shown when the firms are divided into two groups based on the turnover ratio. High liquidity firms after the switch earn significant negative excess returns for a much longer period, and the negative CAR is persistent. Table IV shows that high liquidity firms continue to earn negative CAR (−21.3 percent) for 150 days following the switch, and the result is significant at the 5 percent level. However, different from prior studies, there is a reversal in negative CAR for low liquidity firms around 30 days after the switch. The negative excess returns (−11.1 percent) for low liquidity firms for 30 days following the switch are significant at the 1 percent level, and then the CAR gradually becomes insignificantly positive after 60 days following the switch.
In summary, the results show that the price drop in low liquidity GEM firms after switching to the MB is a transient rather than a persistent phenomenon. By contrast, the negative post-switching phenomenon is much more persistent for high liquidity firms.
5.4 Changes in liquidity following the switch
The results above show that the market reactions differ for firms with low and high liquidity. In this section, we investigate the change in various liquidity measures after the effective switch day. The pre-event period is [A − 150, A − 26]. The pre-event period measure is treated as the benchmark for comparison with the post switching period [S + 10, S + 134]. Two liquidity measures are used. The first is the turnover ratio of the firm. The second measure is the illiquidity ratio (ILLQ) proposed by Amihud (2002). Paired t-tests are used to test for the difference between the pre- and post-switching periods.
Table V reports the liquidity measures of GEM firms before and after switching to the MB. Panel A shows that there is an insignificant change in liquidity for the whole sample after switching to the MB in comparison with the pre-event period. The average (median) turnover ratio increased from 0.31 percent (0.19 percent) to 0.34 percent (0.20 percent). The t-statistic for change in turnover ratio is 0.56, which is insignificant even at the 10 percent level. Similarly, the average (median) illiquidity ratio ILLQ insignificantly changes from 4.65 (0.51) to 5.69 (0.65) after switching.
Stock liquidity before and after the switch to the Main Board
| Pre-event period | Post-switching period | Difference | |||
|---|---|---|---|---|---|
| Mean | Median | Mean | Median | t-stat | |
| Panel A: All firms | |||||
| Turnover | 0.0031 | 0.0019 | 0.0034 | 0.0020 | 0.56 |
| ILLQ | 4.6549 | 0.5113 | 5.6937 | 0.6479 | 0.48 |
| Panel B: Low liquidity firms | |||||
| Turnover | 0.0007 | 0.0005 | 0.0027 | 0.0015 | 2.64*** |
| ILLQ | 8.6959 | 3.2793 | 7.6398 | 0.8435 | −0.26 |
| Panel C: High liquidity firms | |||||
| Turnover | 0.0054 | 0.0034 | 0.0040 | 0.0022 | −2.32** |
| ILLQ | 0.6140 | 0.1790 | 3.7475 | 0.5266 | 2.08** |
Notes: Paired t-tests are used to test for the difference between two periods. **, *** indicate significance at the 5 percent and 1 percent level, respectively
Again, aggregating the results across all GEM firms may result in loss or distortion of important information. Therefore, the authors divide the firms into two groups based on liquidity. For the low liquidity group, Panel B shows a significant increase in trading activity after the switch. The average (median) turnover ratio increased from 0.07 percent (0.05 percent) to 0.27 percent (0.15 percent). The t-statistic for change in turnover ratio is 2.64, which is significant at the 1 percent level. Further, the average (median) illiquidity ratio ILLQ decreases from 8.70 (3.28) to 7.64 (0.84) after the switch of trading venue, although the result is insignificant at the conventional levels.
On the contrary, there is a significant decline in liquidity for firms with high liquidity after the switch to the MB. Panel C shows the average (median) turnover ratio decreases from 0.54 percent (0.34 percent) to 0.40 percent (0.22 percent). The t-statistic for change in turnover ratio is −2.32, which is significant at the 5 percent level. Further, the average (median) illiquidity ratio increases significantly from 0.61 (0.18) to 3.75 (0.53) after switching. The t-statistic for change in illiquidity ratio is 2.08, which is significant at the 5 percent level. The stock liquidity of high liquidity GEM firms deteriorates after moving to the MB, as evidenced by both lower turnover and higher illiquidity ratio.
Overall, our results are consistent with both the liquidity effect and the bonding effect associated with more regulated markets. Low liquidity GEM firms exhibit the pre-switching rise in firm values since the market perceives a switch to the MB as being good news. The increased bonding costs incurred by firms moving to the MB are outweighed by a lower cost of capital arising from the lower agency risks and the improved liquidity, and so we find the post-switching reversal in returns. On the other hand, as evidenced by insignificant pre-switching abnormal returns, the market does not value the move by firms that are already highly liquid on the GEM because they gain very little or no improvement in liquidity (Baker and Edelman, 1992; Lamba and Ariff, 1997) but they must bear the associated bonding costs of maintaining the MB listing. The post-switching fall in firm values indicates that the additional bonding costs far outweigh the benefits from the MB listing. The authors conjecture that the deterioration in post-switching trading volume and liquidity may be due to the migration of the investors.
5.5 Robustness checks
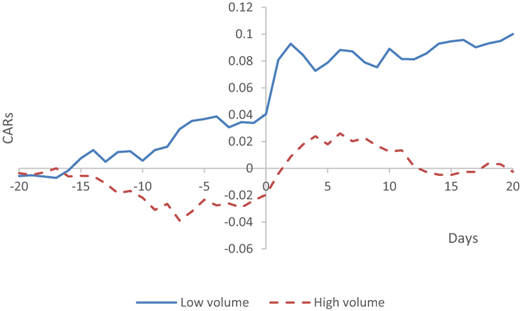
For the robustness of our main results, the authors divide the sample based on dollar trading volume to repeat the tests. The results are summarized in Tables VI–IX and Figures 4–5.
Robustness test - Price reaction around the switch announcement day
| CAR | t-stat | |
|---|---|---|
| Panel A: Low volume firms | ||
| [−1,0] | 0.0060 | 0.65 |
| [−1,1] | 0.0463 | 4.14*** |
| Panel B: High volume firms | ||
| [−1,0] | 0.0095 | 0.96 |
| [−1,1] | 0.0251 | 2.08 |
Notes: *** indicate significance at the 1 percent level
Robustness test - The gross and net effects
| CAR | t-stat | |
|---|---|---|
| Panel A: Low volume firms | ||
| Gross effect | 0.1885 | 5.24*** |
| Net effect | 0.1332 | 3.20*** |
| Panel B: High volume firms | ||
| Gross effect | 0.0679 | 1.77 |
| Net effect | 0.0276 | 0.63 |
| Panel C: Low volume versus high volume | ||
| Gross effect | 2.30** | |
| Net effect | 1.74** | |
Notes: The gross and net effects are calculated by the CAR from one day before the announcement to one day after the switch, i.e., [A − 1, S + 1] and the CAR from one day before the announcement to ten days after the switch, i.e., [A − 1, S + 10], respectively. **, *** indicate significance at the 5 percent and 1 percent levels, respectively
Robustness test - Post-switching CARs after moving to the MB
| Low volume firms | High volume firms | |||
|---|---|---|---|---|
| CAR | t-stat | CAR | t-stat | |
| [0,5] | −0.0926 | −5.85*** | −0.0492 | −2.89*** |
| [0,10] | −0.0968 | −4.52*** | −0.0799 | −3.46*** |
| [0,20] | −0.1109 | −3.75*** | −0.1113 | −3.49*** |
| [0,30] | −0.1282 | −3.56*** | −0.1138 | −2.94*** |
| [0,40] | −0.0959 | −2.32** | −0.1560 | −3.50*** |
| [0,50] | −0.0798 | −1.73 | −0.1745 | −3.51*** |
| [0,60] | −0.0598 | −1.18 | −0.1870 | −3.44*** |
| [0,90] | 0.0122 | 0.20 | −0.1958 | −2.95*** |
| [0,120] | 0.0378 | 0.53 | −0.1942 | −2.54** |
| [0,150] | 0.0513 | 0.65 | −0.2111 | −2.47** |
Notes: **, *** indicate significance at the 5 percent and 1 percent levels, respectively
Robustness test - Stock liquidity before and after the switch to the Main Board
| Pre-event period | Post-switching period | Difference | |||
|---|---|---|---|---|---|
| Mean | Median | Mean | Median | t-stat | |
| Panel A: Low volume firms | |||||
| Turnover | 0.0010 | 0.0005 | 0.0027 | 0.0013 | 2.19** |
| ILLQ | 8.9103 | 3.2793 | 8.3889 | 2.0891 | −0.13 |
| Panel B: High volume firms | |||||
| Turnover | 0.0052 | 0.0034 | 0.0041 | 0.0023 | −1.80** |
| ILLQ | 0.3996 | 0.1441 | 2.9984 | 0.2006 | 1.75** |
Notes: Paired t-tests are used to test for the difference between two periods. **, *** indicate significance at the 5 percent and 1 percent level, respectively
Robustness test. The market reaction around the switch announcement day: Low volume firms versus High volume firms
Robustness test. The market reaction around the switch announcement day: Low volume firms versus High volume firms
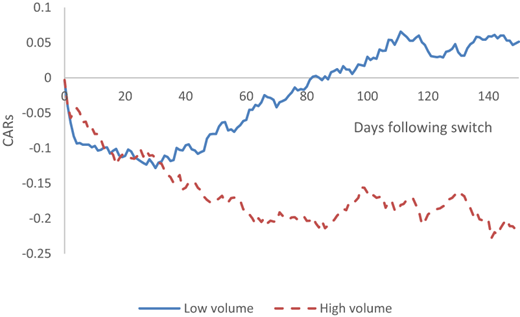
Robustness test the post-switching CARs: Low volume firms versus High volume firms
Robustness test the post-switching CARs: Low volume firms versus High volume firms
The results are similar to those for turnover ratio, and thus, support our conclusion. In brief, firms with lower trading volumes have a much larger positive market reaction around the announcement. Both the gross and net CARs for low volume firms are significantly positive and greater than those of high volume counterparts. The post-switching fall in values of low volume GEM firms is short-term, while the negative post-switching abnormal returns are persistent for high volume firms. The low volume firms show a significant post-switching increase in trading activity, but the liquidity of high volume GEM firms deteriorates after moving to the MB.
6. Conclusion
The HKEx operates two markets: the Main Board (MB) and Growth Enterprise Market (GEM). Over the past decades, more than 100 firms have voluntarily switched from GEM to the MB. Using an event study, the authors find that the market reactions to the switch announcement depend on the liquidity of GEM firms. Firms with high liquidity have no market reaction around the announcement. However, firms with low liquidity experience a much larger positive market reaction around the switch announcement. The results also show that the switch is accompanied by a long-term increase in stock price only for low liquidity GEM firms. High liquidity firms underperform with persistent negative CARs after moving to the MB, while low liquidity firms gradually reverse the transient negative CARs. Further, the results show a significant increase in trading activity for the low liquidity firms following the switch, while there is a significant decline in liquidity for firms with high liquidity. Therefore, the management and investors should be cautious that moving from GEM to the MB is beneficial to low liquidity firms but detrimental to high liquidity firms.
Notes
https://www.sfc.hk/web/EN/files/SOM/MarketStatistics/2019/a01.pdf, retrieved on June 11, 2019.
Our study covers the period before the amendments of the Hong Kong Listing Rule effective on February 15, 2018.
https://www.hkex.com.hk/eng/listing/listhk/faq.htm, retrieved on May 12, 2017.
Our results are qualitatively unaffected using S&P/HKEx GEM Index to calculate the market-adjusted returns.

