


Consumers are the ultimate arbitrators in agri-food value chains (VCs) who evaluate a product based on its attributes. Understanding these preferred attributes is crucial for prioritising value-creation and product differentiation activities. Despite the growing trend in the production, consumption and trade of mandarins in Nepal, consumer preferences for mandarin attributes remain poorly understood. In this paper, we investigate Nepalese consumers' preferences and willingness to pay (WTP) for external mandarin attributes.
We conducted a discrete choice experiment with 395 mandarin consumers from four major markets in Nepal. Consumers' preferences and choice heterogeneity were analysed using Multinomial Logit (MNL), Random Parameter Logit (RPL), and Latent Class Model (LCM) approaches.
The results revealed that a thin peel is the most preferred mandarin attribute, with the highest WTP, followed by a fully orange peel colour, large size, and freshness. Notably, extra-large-sized mandarins are negatively valued, in contrast to the current understanding of mandarin VC actors. Significant preference heterogeneity is observed, with three distinct consumer segments that are influenced by age, gender, income, family size and consumption frequency.
The use of an orthogonal design may have constrained the granularity of attribute interactions. Furthermore, the study predominantly focuses on external attributes and consumers from Nepal, overlooking internal quality attributes and consumers from countries with export potential for Nepal.
The study focuses on consumers, who are an important but largely overlooked actor in agri-food VC upgrading and development initiatives in developing countries. It highlights valuable insights for producers, breeders, marketers and policymakers to develop competitive and targeted production and marketing strategies.
1. Introduction
Understanding consumer preferences and aligning production with value-maximising attributes are central to value chain (VC) development (Jo and Lee, 2021). However, VC initiatives in developing countries are often implemented without a clear understanding of consumers' preferences (Tran et al., 2025). This leads production practices being misaligned with market demand (Pelupessy and Van Kempen, 2005). VC principles hold that adopting a consumer-centric approach strengthens marketing and pricing strategies while fostering competition and sustainable growth within agri-food chains (Adhikari et al., 2012; Collins et al., 2015; Macharia et al., 2013). Integrating consumer preferences into VC design also strategically enhances production, distribution and marketing, thereby enabling actors to respond more effectively to changing consumer demands and preferences (Berampu et al., 2019; Godfrey et al., 2025).
Modern marketing theory emphasises that providing consumer value, primarily determined by product quality, is fundamental to business performance (Slater and Olsson, 2001). Since profitability in agri-food chains relies heavily on satisfying consumers, the importance placed on the specific product attributes: freshness, taste, appearance, labelling and packaging critically shape marketing strategies and inform VC development (Basha and Lal, 2019). For fruit commodities in particular, quality is a multifaceted construct influenced by both intrinsic physiochemical properties and external properties reflected in consumers' sensory and visual perceptions (Kyriacou and Rouphael, 2018). Since intrinsic attributes, such as taste and flavour, cannot be assessed until after the fruit is consumed, visible attributes, such as size, freshness and peel colour, become pivotal in guiding purchasing decisions (Campbell et al., 2006). Therefore, understanding these external quality cues is essential for designing production and marketing interventions that respond successfully to market demands (Jansen et al., 2025).
Mandarins are among the most widely consumed fresh fruits globally (Gambaro et al., 2021; FAO, 2021). Fresh fruits are primarily evaluated by consumers based on external attributes, especially during pre-purchase (Ceschi et al., 2018; Cummins et al., 2016). This type of trend is more prevalent in developing countries, where the fruit's physical appeal drives consumers' purchases (Tarancon et al., 2021). Even with these external cues, consumer preferences are not uniform; they vary widely across geographical and cultural contexts and socio-demographic traits (Gao et al., 2011; Mitra et al., 2021; Reicks et al., 2011). These differences highlight the need to understand consumer segments and preferences for tailored marketing strategies and targeted product differentiation, especially in emerging markets (Van Loo et al., 2011).
The literature often generalises findings about citrus types, for example, mandarins and oranges, despite distinct differences in product attributes and consumer preferences for each (Di Vita et al., 2020). However, a critical gap within mandarin-specific consumer research shows that the attributes driving preferences for mandarins may differ fundamentally from other citrus types (Goldenberg et al., 2017). Studies in countries such as the USA, the UK, France and Uruguay provide valuable insights into mandarin attributes, including sweetness, size, seedlessness and appearance (Campbell et al., 2004; Poole and Baron, 1996; Simons et al., 2018; Gambaro et al., 2021), such evidence is low in developing regions, particularly South Asia and Nepal.
In Nepal, mandarin is one of the leading fruit crops, occupying the largest cultivation area among all fruits (Rokaya et al., 2016), ranking third in its contribution to the agricultural gross domestic product in 2023 Ministry of Agriculture and Livestock Development (MOALD, 2023). Its dominance is evident since mandarins occupy over 57% of the total area dedicated to citrus fruit cultivation (MOALD, 2023). This prevalence highlights mandarin's central role in the agricultural economy and the livelihood of Nepalese farmers. Although Nepal ranks 41st in global mandarin production (FAO, 2022), it is the mainstay of farmers in Nepal's mid-hill region, which covers two-thirds of the country. This region spans over 1,000 km from east to west, with elevations of 800–1,500 meters above sea level (masl) and offers optimal agro-ecological conditions for mandarin production (Paudyal et al., 2016). In Nepal, the rise of the middle class and increased consumer awareness of health and nutrition have driven demand for fresh fruits, such as mandarins, which is expected to continue (Joshi et al., 2023). Moreover, Nepal's geographical positioning, with prominent markets in China, India and Bangladesh, and its active bilateral and regional trade agreements with these countries, present immense opportunities for fresh mandarin exports from Nepal (Aryal et al., 2022).
Mandarin production in Nepal increased by 89% from 10,300 ha in 2003 to 19,481 ha in 2023 (MOALD, 2023), driven by rising consumer demand and increased government support for establishing orchards (Paudyal et al., 2016; Pokhrel, 2011). However, the industry's overall performance has not reached its full potential because various inefficiencies in production, collection, distribution, marketing and value addition exist along the VCs (Aryal et al., 2022; NPC, 2016). The underperformance of VCs in Nepal is attributed significantly to an insufficient understanding of consumer preferences (Adhikari et al., 2012) and a misalignment between demand and supply-side preferences, particularly in the mandarin industry (Thapa, 2021).
Given this context, it becomes imperative to understand consumers' preferences and willingness to pay (WTP) for mandarin's external attributes. Understanding WTP can help producers and policymakers identify value-enhancing opportunities, align production with market demand and serve high-value consumer segments, thereby creating better value for all stakeholders in the industry, including consumers. Moreover, the findings of this study can inform VC upgrading, export strategies and product positioning, particularly as Nepal seeks to expand its trade prospects in the South Asian regional fruit market (Aryal et al., 2022). The insights derived from this study may offer valuable comparative relevance to culturally and geographically similar neighbouring countries like India and Bangladesh, which are not only the net importers (https://www.fao.org/faostat/en/#data/TCL) of fresh mandarin but also a good export market, as both countries are experiencing increasing consumption of fresh mandarin (Dharanikumar et al., 2023; Rahman et al., 2022).
This study contributes to the literature on consumer research and VC development in three ways. First, it extends the discrete choice experiment (DCE) methodology to examine preferences for mandarin attributes in Nepal, an underrepresented context in citrus research. Second, this research provides empirical evidence on the heterogeneity of consumer preferences and the valuation of specific mandarin attributes. This nuanced understanding of how different consumer segments value mandarin attributes offers practical ideas for product differentiation and targeted marketing. Third, it addresses a critical geographical and methodological gap in the literature, with implications for both domestic and regional agri-food export strategies.
2. Literature review
2.1 Mandarin markets in the global context
Mandarin is a popular citrus fruit, primarily consumed fresh and appreciated for its sweet taste and flavour (Goldenberg et al., 2017). The mandarin industry has expanded rapidly over the past 2 decades, driven by rising consumer demand and global production growth (Mukhametzyanov et al., 2024). The harvest area increased significantly from 1.80 million ha in 2000 to 38.93 million ha in 2023, representing a more than 20-fold rise (2063%) (FAOSTAT, 2025). This rapid expansion in cultivated area contributed to a substantial increase in global production, which rose from 19.94 million tons to 52.56 million tons, representing an overall increase of 164%. Productivity also improved, with average yields rising from 11.05 ton/ha in 2000 to 13.50 ton/ha (FAOSTAT, 2025), reflecting a 22% increase and indicating incremental advances, mainly through orchard management, improved varieties and better input use (Mukhametzyanov et al., 2024). International trade in mandarins increased significantly during the same period. Import volumes increased by 150% and their value surged by 365%, indicating not only higher traded quantities but also a rising market. Likewise, export quantities expanded by 137%, accompanied by a 337% increase in export value (FAOSTAT, 2025), indicating mandarins have emerged as a high-value fruit.
Mandarin is the leading citrus fruit in terms of production growth, attributed to increasing consumer demand for easy-to-peel varieties and appealing sensory qualities (Goldenberg et al., 2017). Globally, China is the dominant producer, accounting for the largest share of world production, followed by major Mediterranean producers, including Spain, Turkey, Morocco and Egypt, which supply high-quality fruit to premium export markets in Europe, Russia, and the Middle East (FAOSTAT, 2024). The global trade in mandarins is shaped by stringent quality standards that emphasise uniform peel colour, the absence of defects, appropriate size grading, sweetness and sufficient shelf life, reflecting the importance of both visual appearance and eating quality.
Across South Asia, mandarins are widely cultivated and consumed, making the region a significant contributor to the global citrus industry. China not only leads global production but also provides a large consumer market driven by urbanisation, rising incomes, and the expansion of modern retail outlets (Lu, 2020). In addition to being a major producer, China is also an increasingly significant citrus importer, with imports growing at an annual rate of 10.91% China Business Intelligence Network (CBIN, 2021). This demand is projected to rise by approximately 4.65 million tons by 2030 (Chunjie, 2000). Reflecting this growing market, China signed an agreement with Nepal in 2012 to import Nepalese mandarins into Tibet to help meet increasing domestic demand (Aryal et al., 2022).
India, another major producer and consumer of fresh mandarins, has experienced substantial growth in mandarin cultivation and market demand in recent years (Gosal et al., 2024). In 2022, India signed an agreement with Australia to import its mandarins under the Australia-India Economic Cooperation and Trade Agreement (Walters, 2022) to fulfil its growing domestic demand. However, its domestic market remains dominated by informal retail channels, in which quality differentiation relies primarily on visible attributes rather than on standardised grades or labels.
2.2 Previous studies on mandarin attributes and preferences
The literature has identified three broad categories of attributes that influence consumer preferences for mandarins: external, internal sensory and credence attributes as presented in Table 1. Together, these attributes structure how consumers evaluate mandarins before deciding to purchase them (Hurgobin et al., 2020).
Summary of past studies on consumer preferences for mandarin attributes
| Authors | Country of research | Attributes included | Method employed |
|---|---|---|---|
| Campbell et al. (2004) | USA | Price, colour, size, seediness, blemishes, production region label and organic production | Conjoint analysis |
| Campbell et al. (2006) | USA | Price, package type, mandarin type, label | Conjoint analysis |
| Di Vita et al. (2020) | Italy | Peelability, sweetness, and acidity | Rating and Likert scale |
| Di Vita et al. (2021) | Italy | Price, production method, and presence of a geographical indication | Conjoint analysis |
| Gambaro et al. (2021) | Uruguay | Texture, odour, flavour, seed, peel colour and appearance | Focus group |
| Gao et al. (2011) | USA | Freshness, flavour, price, appearance, juiciness, and country of origin | Rating scale |
| Gao et al. (2014) | France | Country of origin | Likert scale |
| Poole et al. (2007) | UK | Colour, size, ease of peeling, juiciness, sweetness and acidity | Experimental auction |
| Simons et al. (2018) | USA | Appearance, flavour and texture | Hedonic test |
| Tarancon et al. (2021) | Spain | Rind colour, leaf presence, calyx condition, waxing and rind condition | Choice-based conjoint experiment |
| Wei et al. (2003) | Indonesia | Appearance, taste, texture, overall quality of fruit segment and skin colour | Focus group |
External visual attributes influence consumer preferences for mandarins most as research in diverse countries shows that visual appearance-based cues such as peel colour, size, uniformity and the absence of blemishes play a central role in shaping initial quality assessment and purchase decisions (Campbell et al., 2004, 2006; Wei et al., 2003). Tarancon et al. (2021) further confirm that rind colour, calyx condition, leaf presence and skin appearance significantly affect consumer utility. Across these types, attributes such as colour, size, peel texture and external appearance serve as proxy indicators of internal quality, especially in markets where consumers rely primarily on visual inspection to infer fruit quality.
Alongside visual attributes, internal sensory qualities strongly influence consumer preferences and repeat purchase. Studies consistently show that sensory attributes such as sweetness, juiciness, flavour intensity, aroma and texture greatly influence consumer preferences across diverse cultures, including Uruguay, the USA, Italy and the UK (Di Vita et al., 2020; Gambaro et al., 2021; Poole et al., 2007; Simons et al., 2018). However, most sensory research focuses on mandarin segments or juice, providing little insight into how whole-fruit appearance shapes consumers' perceptions of internal quality prior to purchase.
While credence attributes also influence mandarin preferences, they cannot be directly verified at the point of purchase. Studies of European countries demonstrate strong consumer interest in credence attributes such as country of origin, organic production, geographical indications and sustainability labels, which signal safety, authenticity and ethical value (Di Vita et al., 2020; Gao et al., 2014). In the USA, branding and labelling also shape consumer perceptions of quality (Campbell et al., 2006). These credence attributes are more salient in markets with established certification systems.
Despite these perspectives, the existing literature remains geographically concentrated in high-income countries such as the USA, Italy, France, Spain and the UK. Only a small number of studies, such as Badar et al. (2023) and Wei et al. (2003), examine consumer preferences for mandarins in developing or middle-income countries. This represents a significant knowledge gap, particularly where developing countries are major producers and consumers of fresh mandarins.
Methodologically, most of the research into mandarins has employed focus group discussion (Kurzer et al., 2019), face-to-face interviews (Poole and Brown, 1996), hedonic evaluations (Simons et al., 2018), rating techniques (Campbell et al., 2006; Poole et al., 2007; Gao et al., 2014; Di Vita et al., 2020) and Likert scales (Campbell et al., 2004), which although offer valuable insights but hardly capture the complex trade-offs consumers make when choosing from among bundles of attributes. Only a small number of studies, such as Bi et al. (2014), Ho et al. (2024) and Tarancon et al. (2021), have adopted choice-based conjoint methods that better reflect real-world trade-offs in the developing country context.
3. Methodology
3.1 Study area
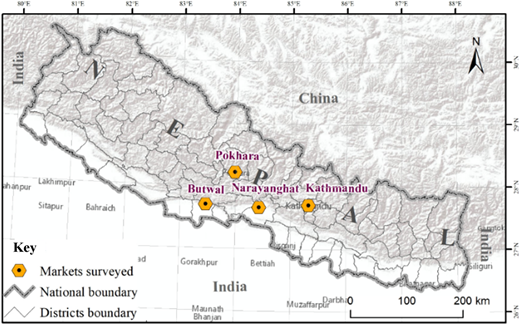
Four major cities of Nepal, namely Kathmandu, Narayanghat, Pokhara and Butwal (Figure 1), were purposively selected for this study. These cities are the destination markets for mandarins produced in the Syangja district, the largest mandarin-producing district in the country (MOALD, 2023). Consumers residing in these four cities were the target respondents for this study.
3.2 Data collection
To obtain a representative sample from the study population, the initial sample size was calculated using Cochran's formula [1], a common method used in survey research when the population proportion is unspecified (Khan et al., 2022). This calculation determined a necessary sample size of 385. To address potential non-response, an additional 15 samples were included, bringing the target to 400 respondents. This aligns with Orme's (2010) recommendation of a minimum of 300 samples for a robust quantitative choice experiment.
The selection of respondents for this study involved a three-stage process. Initially, consultations with extension personnel working in the mandarin industry in Syangja district identified that mandarin was relatively evenly distributed among Kathmandu, Pokhara, Butwal and Narayanghat. Based on this information, we decided to allocate a sample size of 100 respondents per market. In the second stage, we identified various retail outlets within these markets where consumers typically purchase mandarins (Caputo et al., 2025). This identification was carried out through consultations with wholesalers and industry experts. The retail outlets included fruit and vegetable retail markets, corner fruit shops, street vendors and supermarkets. Finally, in the third phase, enumerators randomly approached respondents within each selected retail outlet to collect survey responses (Okpiaifo et al., 2020). To maintain randomness, every consumer encountered was approached and invited to participate in the survey voluntarily. Consumers who were at least 18 years old, had purchased and consumed mandarins in the past 12 months and agreed to participate voluntarily were included. A total of 400 respondents were initially surveyed. After excluding five incomplete responses, 395 valid responses were used for analysis. Undergraduate students in agriculture were recruited and trained to administer the survey. Smartphones and tablets were used to record survey responses. The survey was conducted in July 2023 using a questionnaire programmed and administered via Qualtrics to collect data.
3.3 Questionnaire design
The questionnaire used in this study was organised into three sections. The first section included questions about their mandarin consumption habits and purchasing experiences. The second section focused on the choice experiment. Respondents were presented with eight choice sets, each comprising three alternatives, including a “no choice” option. Before beginning the choice tasks, respondents received a brief explanation of the DCE method, along with a description of the specific mandarin attributes and their respective levels evaluated in the study. The final section collected socio-demographic data, including age, gender, household size, education level and income.
3.4 Choice experiment design
This study employed a DCE to assess consumers' preferences for mandarin attributes. As a stated-preference method, the DCE presents respondents with hypothetical choice sets containing multiple alternatives and asks them to select their preferred option (Mzek et al., 2022). This approach is particularly effective for evaluating products or services with multiple attributes, as it allows researchers to estimate preferences for individual attributes and the associated WTP (Khanal et al., 2017).
Rooted in random utility theory, the DCE assumes that individuals derive utility not from the product itself, but from its underlying attributes (Lancaster, 1966). The key principle of this method is the systematic variation of product attributes, treated as independent variables, across alternatives in each choice set, to examine their effects on the dependent variable, namely the respondent's choice. McFadden (1974) established this approach through a theory-based econometric model for discrete responses, where utility is modelled as a linear function of observable attributes and their associated coefficients. By estimating attribute-level utilities, the DCE method provides detailed insights into consumer preferences and the relative importance of attributes (Aravindakshan et al., 2021).
3.4.1 Attributes and levels
The attributes and levels utilised in this study were selected through a two-phase process. Initially, a review of the relevant literature and consultations with experts in the mandarin VC in Nepal identified 12 potential attributes [2] and their corresponding levels. Following this, a preliminary survey was conducted with a sample of 17 horticulture experts and 12 consumers to get the top five mandarin attributes, of which three were allocated two levels, one was assigned three levels, and one was designated with four levels, as detailed in Table 2. Identifying consumers' preferences and WTP for mandarin attributes, being a primary objective of this study, each of the selected attributes contributes to the purchase decisions of consumers.
Attributes and their labels used in this study
| Attributes | Levels | Description |
|---|---|---|
| Peel colour | Full orange | Peel has a complete orange colour without a single green patch |
| Partial orange (base level) | Peel has some patches of green colour | |
| Freshness | Freshness indicated by green leaves intact | Freshness indicated by the presence of one to two green leaves on the fruit peduncle |
| Fresh without green leaves intact (base level) | Fresh without green leaves on fruit peduncle | |
| Fruit size | Extra-large | Fruit diameter larger than 7 cm |
| Large | Fruit diameter between 6–7 cm | |
| Medium | Fruit diameter between 5–6 cm | |
| Small (base level) | Fruit diameter less than 5 cm | |
| Peel thickness | Thin | Thin, shiny and brighter mandarin peel |
| Thick (base level) | Thick, dull and less bright mandarin peel | |
| Pricea | NRsb 100 per kg | Price expressed in NRs per kilogram of mandarin |
| NRs 140 per kg | ||
| NRs 180 per kg |
Price levels were chosen based on observed market prices across different cities in Nepal, as well as consultations with experts in mandarin industry. We selected NRs 100, 140 and 180 per kg to represent low, average, and high price typically encountered by consumers
1 USD = 132.58 Nepalese rupees (NRs) as per the exchange rates of Nepal Rastra Bank on 16 February 2024
3.4.2 Choice set design
After identifying five attributes and their corresponding levels, a full factorial design yielded 96 (23 × 31 × 41) potential choice profiles. To facilitate the decision-making process and reduce cognitive overload and decision fatigue for participants, the options were reduced to 16 using an orthogonal fractional factorial design in IBM SPSS (version 29.0.0.0), as presented in Table 3 (Carzedda et al., 2021). These 16 profiles were randomly grouped into eight choice sets, each comprising two choice alternatives (alternative A and B) (Carzedda et al., 2021). To create a realistic market situation and avoid forcing respondents to choose, a no-buy option was included as a third alternative in each choice set (Ceschi et al., 2018; Gao and Schroeder, 2009). Text descriptions were used to present the attributes and their levels, facilitating an understanding of the choices. Before the choice tasks, trained enumerators explained the attributes and levels used in each choice set to ensure consistent understanding among respondents. Furthermore, a “cheap talk” statement was included in the instructions before the experiment (Lusk, 2003). Informed consent was obtained from all participants in the study, which was approved by the institutional ethics committee (2023/HE000774). An example of a choice set is presented in Table 4.
Mandarin profiles generated by orthogonal fractional factorial design
| Product | Colour | Freshness | Size | Peel thickness | Price/kg |
|---|---|---|---|---|---|
| 1 | Partial orange | Fresh without 1–2 green leaves intact | Medium | Thick | 180 |
| 2 | Full orange | Fresh without 1–2 green leaves intact | Small | Thin | 100 |
| 3 | Full orange | Fresh with 1–2 green leaves intact | Medium | Thin | 100 |
| 4 | Full orange | Fresh without 1–2 green leaves intact | Medium | Thick | 140 |
| 5 | Partial orange | Fresh with 1–2 green leaves intact | Small | Thick | 140 |
| 6 | Partial orange | Fresh without 1–2 green leaves intact | Extra large | Thin | 140 |
| 7 | Partial orange | Fresh with 1–2 green leaves intact | Medium | Thin | 100 |
| 8 | Full orange | Fresh without 1–2 green leaves intact | Extra large | Thin | 180 |
| 9 | Partial orange | Fresh without 1–2 green leaves intact | Large | Thick | 100 |
| 10 | Partial orange | Fresh without 1–2 green leaves intact | Small | Thin | 100 |
| 11 | Full orange | Fresh with 1–2 green leaves intact | Large | Thin | 140 |
| 12 | Full orange | Fresh with 1–2 green leaves intact | Extra large | Thick | 100 |
| 13 | Full orange | Fresh with 1–2 green leaves intact | Small | Thick | 180 |
| 14 | Partial orange | Fresh with 1–2 green leaves intact | Extra large | Thick | 100 |
| 15 | Partial orange | Fresh with 1–2 green leaves intact | Large | Thin | 180 |
| 16 | Full orange | Fresh without 1–2 green leaves intact | Large | Thick | 100 |
A sample choice set
| Attributes | Alternative A | Alternative B | Alternative C |
|---|---|---|---|
| Peel colour | Full orange | Partial orange | Nonea |
| Freshness | Fresh with 1–2 green leaves intact | Fresh without green leaves intact | |
| Fruit size | Medium | Extra large | |
| Peel thickness | Thin | Thin | |
| Price | NRs 100 per kg | NRs 140 per kg | |
| Tick (۷) the alternate you would choose | ☐ | ☐ | ☐ |
None means none of the alternatives (Alternative A or Alternative B) are preferred
3.5 Econometric model
Data were analysed using Multinomial Logit (MNL), Random Parameter Logit (RPL) and Latent Class Models (LCM), grounded in Lancaster's theory of consumers' choice (Lancaster, 1966) and McFadden's random utility theory (RUT) (McFadden, 1974). These models were selected due to their interpretability, computational efficiency and alignment with the study's objectives of identifying distinct consumer segments and estimating attribute-level preferences (Hensher et al., 2015). However, the MNL model is criticised for assuming preference homogeneity (Hensher et al., 2005). We acknowledge that the MNL model assumes independence of irrelevant alternatives (IIA) (Train, 2009), which may not hold in all consumer choice contexts. However, the use of RPL and LCM mitigates this concern by allowing for random taste variation and class-level heterogeneity, respectively. These models were estimated using NLOGIT6.0, a software designed for discrete choice analysis.
The random utility theory assumes that consumer (n) chooses alternative (j) in choice set (t) to maximise utility Unjt;
Where is the observable deterministic component and is the unobservable stochastic error, which is assumed to be independent of . Consumers aim to maximise their utility when choosing between alternatives (Mzek et al., 2022; Hensher et al., 2015). Therefore, consumer () chooses alternative () over alternative () if .
Based on Lancaster's consumer choice theory, utility is a linear function of product attributes, expressed as;
Where is the alternative specific constant (ASC), denotes the attributes of alternative (j) and are coefficients representing preference strengths for each attribute. represents the error term, assumed to be independent of both and X.
The MNL model estimates choice probabilities assuming independently and identically distributed (IID) errors following a type I extreme-value distribution (Train, 2009). Therefore, a respondent's ( probability of choosing alternative () over alternative () in the MNL model can be expressed as;
Where is the choice probability of the respondent () to choose an alternative (), , are the coefficients for the attributes of alternatives () and (), and β is the coefficient of the parameters.
While MNL is useful, it assumes homogeneous preferences across respondents and cannot account for heterogeneity (Mzek et al., 2022). However, heterogeneity in preferences for mandarin attributes was hypothesised. To test this hypothesis, the RPL model was applied (Sagebiel, 2017). It estimates both the mean coefficients and standard deviations for each attribute, thereby revealing the extent of preference heterogeneity (Hensher et al., 2015). It addresses the limitations of the MNL model by accounting for consumer preference heterogeneity (Train, 2009). The RPL model assumes that there are random parameters that are expected to follow continuous distributions across the surveyed population. The utility that consumer derives from alternatives () in choice set () is expressed as;
Where, is the vector of observed variables, denotes the coefficients for respondents' choices, is an independently and identically distributed error component. A larger standard deviation indicates greater heterogeneity in preferences across the population.
The choice probability in the RPL model is expressed as;
Although RPL captures unobserved preference heterogeneity, it does not explain its sources. Individuals may belong to distinct preference segments influenced by socioeconomic factors. The LCM addresses this by assuming preference homogeneity within classes but heterogeneity between them (Green and Hensher, 2003). It segments the sample into latent classes, each with distinct utility functions. The probability that a consumer belongs to the class , choosing an alternative in the choice set , is expressed as;
The membership probability for the respondent in a particular class (Green and Hensher, 2003) with vector being normalised for model identification is expressed as;
Where is the class assignment probability for individual to be in class , denotes class-specific parameters and represents individual-specific characteristics.
Following estimation of the MNL, RPL and LCM models, marginal WTP for each attribute was calculated using the Wald procedure (Hensher et al., 2005), by taking the negative ratio of the attribute coefficient to the price coefficient (Train and Weeks, 2005).
Where is the coefficient for any of the attributes and is the coefficient for the price attribute.
4. Results
4.1 Demographic characteristics of the respondents
All respondents included in our survey were mandarin consumers and purchasers. Of the 395 consumers whose responses were analysed, 38.73% were female and 61.27% were male. This gender distribution reflects cultural norms in Nepal, where women typically engage more in household chores and men in outdoor activities. The mean age of the respondents was 37.45 years. The age breakdown shows that the majority (58.99%) were in the 21–40 age group, followed by 28.86% in the 41–60 age bracket. The remaining 12.16% were either younger or older than the groups in this study (Table 5). This age structure aligns well with the findings of Nepal's 2021 population census, which indicates that 61.69% of the total population falls within the 15–59 age range (NSO, 2021).
Respondents' demographics
| Demographic characteristics | Total (N = 395) |
|---|---|
| Gender | |
| Male | 242 (61.27) |
| Female | 153 (38.73) |
| Age (years) | |
| <20 | 18 (4.56) |
| Between 21–40 | 233 (58.99) |
| Between 41–60 | 114 (28.86) |
| Between 61–80 | 28 (7.09) |
| >80 | 2 (0.51) |
| Mean age in years | 37.45 |
| Education | |
| 0 years of education | 11 (2.78) |
| 1 year of education | 13 (3.29) |
| 2–5 years of education | 52 (13.16) |
| 6–10 years of education | 95 (24.05) |
| 11–12 years of education | 94 (23.80) |
| 13–15 years of education | 130 (32.91) |
| Mean years of education | 10.89 |
| Family size | |
| ≤2 persons | 8 (2.03) |
| 3–5 persons | 229 (57.97) |
| 6–9 persons | 145 (36.71) |
| ≥10 persons | 13 (3.29) |
| Mean family size | 5.32 |
| Monthly family income (NRs) | |
| <2,500 | 2 (0.51) |
| 2,501–7,500 | 7 (1.77) |
| 7,501–15000 | 49 (12.41) |
| 15,001–35000 | 199 (50.38) |
| 35001–75000 | 112 (28.35) |
| >75000 | 26 (6.58) |
| Mean monthly family income | 47495.78 |
Note(s): Figures in parentheses represent the percentage of total respondents
Respondents were notably well-educated, with 56.71% having completed 11 or more years of schooling. This aligns well with Nepal's national literacy rate, which stands at 76.2%. Notably, the literacy rate differs by gender, with 83.6% of males and 69.4% of females being literate (NSO, 2021). More than half of consumers lived in households with a family size of 3–5 persons. Regarding family income, the largest segment (50.38%) reported a middle-income range of NRs 15,001–35,000 per month. This group was followed by the respondent groups earning between NRs 35,001–75,000 (28.35%) and between NRs 7,501–15,000 (12.41%). The highest-income earners, earning over NRs 75,000 monthly, accounted for 6.58% of the respondents, whereas the lowest-income group, earning less than NRs 2,500, accounted for only 0.51%.
4.2 Consumers' preference for mandarin attributes
The estimated coefficients from the MNL and RPL models are presented in Table 6. The results indicate that mandarin alternatives (MNL coefficient = 2.320, p < 0.01) provide significantly higher utility than the no-buying option. However, preferences for these attributes vary significantly across individuals, as indicated by the RPL estimates (mean coefficient = 4.497***, p < 0.01). Notably, most of the mandarin attributes included in the choice set were statistically significant, except for medium fruit size (Table 6). The pseudo-R2 values of 0.464 (MNL) and 0.312 (RPL) suggest that both models have a good fit.
Multinomial and Random parameter logit estimates for mandarin attributes
| Attributes | MNL | RPL | ||
|---|---|---|---|---|
| Coefficient | Standard error | Mean | Standard deviation | |
| Constant | 2.320*** | 0.186 | 4.497*** (0.858) | 0.703 (0.639) |
| Peel colour (Full orange) | 0.431*** | 0.025 | 1.052*** (0.200) | 0.552 (0.589) |
| Freshness (Fresh with 1–2 green leaves intact) | 0.187*** | 0.030 | 0.251*** (0.085) | 0.471 (0.421) |
| Fruit size (Extra-large) | −0.277*** | 0.061 | −0.229 (0.168) | 2.379*** (0.690) |
| Fruit size (Large) | 0.195*** | 0.047 | 0.349*** (0.124) | 1.328*** (0.512) |
| Fruit size (Medium) | 0.069 | 0.065 | 0.268* (0.150) | 0.371 (0.467) |
| Peel thickness (Thin) | 0.473*** | 0.033 | 1.171*** (0.234) | 2.062*** (0.471) |
| Price | −0.002* | 0.001 | −0.009** (0.004) | 0.007 (0.004) |
| Number of observations | 3,160 | 3,160 | ||
| Pseudo-R2 | 0.464 | 0.312 | ||
| Log likelihood | −2427.041 | −2386.922 | ||
Note(s): ***, ** and * represents significance at 1%, 5% and 10% probability levels respectively. Partial orange colour, fruit without green leaves intact on peduncle, small fruit size, and thick peel were used as base attribute levels. Values in parentheses are standard errors
Positive coefficients from the MNL model for attributes such as full orange peel colour, large size, freshness (indicated by the presence of 1–2 green leaves intact on fruit peduncle) and thin-peel suggest higher utility from mandarins possessing these characteristics. In contrast, the significantly negative coefficient for extra-large size (−0.277***, p < 0.01) indicates an apparent aversion to extra-large fruits compared to small-sized mandarins. As expected, the negative coefficient for price indicates that higher prices reduce consumer utility, implying price sensitivity among consumers.
Heterogeneity in preferences was indicated by the RPL model, as presented in Table 6. Statistically significant standard deviations for the extra-large size (2.379***, p < 0.01) and thin peel attributes (2.062***, p < 0.01) indicate substantial unobserved heterogeneity in preferences for these attributes, independent of other choices. In other words, even within the same attribute category, individual preferences can vary markedly. Such insights are invaluable for understanding the complexity of consumer choice behaviour and for tailoring marketing strategies that address the needs of diverse consumer segments.
4.3 Preference heterogeneity for mandarin attributes
The significant standard deviations in the RPL model suggest heterogeneous preferences for mandarin attributes among respondents. However, as RPL does not reveal the underlying source of this heterogeneity, the analysis was extended using an LCM to identify distinct consumer segments. A critical step in estimating LCM is selecting the optimal number of classes, typically guided by information criteria, where the model with the lowest score indicates a better fit (Cai et al., 2024). Accordingly, the Akaike Information Criterion (AIC) and Bayesian Information Criterion (BIC) (El Benni et al., 2019) were used to assess model performance as presented in Table 7.
Criteria for determining the optimal number of classes
| Number of classes | Number of parameters | Log-likelihood | AIC | BIC |
|---|---|---|---|---|
| 2 | 14 | −2413.150 | 4854.300 | 4939.098 |
| 3 | 56 | −2263.189 | 4638.378 | 4968.638 |
| 4 | 74 | −2413.146 | 4958.542 | 5406.760 |
While the AIC values suggest that a three-class model is optimal, the BIC values indicate that a two-class model is more suitable. This discrepancy suggests that statistical criteria alone may not be sufficient for determining the appropriate number of latent classes. Therefore, interpretability and substantive meaningfulness were also considered, leading to the selection of the three-class model (Cai et al., 2024). The estimated parameters for each class are presented in Table 8.
Latent class model estimates
| Variables | Class 1 | Class 2 | Class 3 |
|---|---|---|---|
| Coefficient | Coefficient | Coefficient | |
| Average class probability | 43 | 36 | 21 |
| Utility function | −36.947 (131.70) | 2.325** (0.941) | 4.922*** (1.475) |
| Peel colour | 0.289*** (0.052) | 1.049*** (0.095) | −0.043 (0.121) |
| Freshness | 0.067 (0.063) | 0.270*** (0.083) | 0.569*** (0.124) |
| Extra-large | 0.267 (0.163) | −0.664*** (0.151) | −0.342 (0.212) |
| Large | 0.025 (0.093) | 0.598*** (0.123) | −0.268 (0.192) |
| Medium | 0.221 (0.152) | 0.644*** (0.150) | 0.117 (0.295) |
| Peel thickness | 0.047 (0.078) | 0.413*** (0.079) | 1.699*** (0.169) |
| Price | −0.008***(0.003) | −0.003 (0.003) | −0.005 (0.004) |
| Class membership function | |||
| Constant | 3.581*** (1.335) | 2.830** (1.347) | |
| Sex | 1.023** (0.443) | 0.803* (0.444) | |
| Age | −0.060*** (0.019) | −0.039** (0.019) | |
| Education | −0.062 (0.064) | 0.019 (0.069) | |
| Income | −0.239** (0.101) | −0.164* (0.960) | |
| Family size | 0.258** (0.116) | 0.112 (0.120) | |
| Frequency of consumption | −0.737 (0.563) | −1.516*** (0.556) | |
Note(s): ***, **, *Significant at the 1%, 5%, and 10% probability levels, respectively
Values in parentheses are the standard error
To uncover distinct segments, variations in both attribute and socio-demographic variables were examined across the latent classes. The estimated coefficients for mandarin attributes, along with respondents' socio-demographic characteristics, are presented in Table 8. Class 3 serves as the baseline; hence, socio-demographic parameters are estimated only for Classes 1 and 2.
Budget-conscious consumers (Class 1), the largest segment (43.00%), comprise predominantly younger males with less than 10 years of education and larger families. These consumers prioritised peel colour when making choices for mandarin attributes. They were highly price sensitive, indicating a decreasing consumer utility for them with increasing price and they typically belonged to lower-income households. In contrast, they did not consider attributes such as freshness, size, or peel thickness, indicating limited sensitivity to quality-related attributes of mandarin. This class of consumers can be characterised as conventional consumers, driven primarily by price and basic visual appeal (peel colour).
Quality-conscious consumers (Class 2), representing 36.00% of the sample, exhibited significant and positive preferences for most mandarin attributes, except for extra-large size. Among the attributes, peel colour was found to be most important, followed by size (medium and large, respectively), thin peel and freshness. A strong sensitivity to appearance and quality-related attributes thus characterises this class. Demographically, members of this class are mostly younger males with household monthly incomes below NRs 35,000 and are more likely to be occasional consumers rather than regular buyers. Their educational level and family size did not significantly influence their class membership.
Pragmatic quality seekers (Class 3), representing 21.00% of the sample, exhibited significant and positive preferences for fresh mandarins with thin peels. Unlike Class 2, this group was not influenced by peel colour or fruit size and unlike Class 1, it showed no sensitivity to price. This class is thus characterised as a niche segment of quality-seeking consumers who value intrinsic mandarin attributes over visual appearance (peel colour, size) and cost. Demographically, members of this class are predominantly older females with higher household income (above NRs 35,001), smaller family sizes and are more likely to be regular mandarin consumers.
4.4 Willingness to pay for mandarin attributes
The WTP was calculated using the coefficients estimated by the MNL (Table 6) and LCM (Table 8), applying Equation (8) as presented in Table 9. Based on MNL results, consumers had the highest WTP for mandarins with thin peel, at NRs 191.15 per kg, suggesting they are willing to pay more for this attribute. Conversely, consumers exhibited a strong dislike for extra-large mandarins, as indicated by a negative WTP of NRs −111.69, suggesting a preference for smaller mandarins, as evidenced by positive WTP for large and medium-sized mandarins. Notably, the WTP estimates for full orange colour, fresh with 1–2 green leaves intact on the peduncle and thin peel are statistically significant, indicating that a substantial proportion of respondents were willing to pay a premium price for these attributes. In contrast, the WTP estimates for medium and large-sized mandarins are not statistically significant, suggesting that consumer preferences for these sizes relative to the base category (small) were less pronounced or inconsistent.
Willingness to pay for mandarin attributes in Nepalese Rupees
| Attributes | MNL | LCM | ||
|---|---|---|---|---|
| Class 1 | Class 2 | Class 3 | ||
| Peel colour (Full orange colour) | 174.22* | 36.13 | 349.67 | −8.60 |
| Freshness (1–2 green leaves attached) | 75.80* | 8.38 | 90.00 | 113.80 |
| Fruit size (Extra-large) | −111.69 | 33.38 | −221.33 | −68.40 |
| Fruit size (Large) | 78.87 | 3.13 | 199.33 | −53.60 |
| Fruit size (Medium) | 27.88 | 27.63 | 214.67 | 23.40 |
| Peel thickness (Thin) | 191.15* | 5.88 | 137.67 | 339.80 |
Note(s): * Significant at the 10% probability level
Across consumer segments, the WTP estimated by LCM differs distinctly for mandarin attributes. For example, the Class 1 and Class 2 consumer segments had the highest WTP for mandarins with full orange peel colour, valued at NRs 36.13 and NRs 349.67, respectively. In contrast, the class 3 consumer segment had a negative WTP for the same mandarin attribute. Interestingly, the class 3 consumer segment had the highest WTP for mandarins with thin peel, valued at NRs 339.80.
5. Discussion
This study presents empirical evidence about Nepalese consumers' preferences for external mandarin attributes using a DCE, revealing significant heterogeneity across the consumer segments. The findings estimate the importance of thin peel, full orange peel colour and freshness, as indicated by the presence of 1–2 green leaves on the fruit peduncle, as well as size, in shaping consumer utility. They also highlight trade-offs and socio-demographic influences that inform purchasing behaviour.
5.1 Thin peel as a quality signal
Among the evaluated attributes, thin peel was the most preferred, with the highest WTP (NRs 191.15/kg). This strong preference was particularly evident among more educated, higher-paid, older women who regularly consume mandarins (as class 3 consumers), a preference likely reflecting superior eating quality. The literature demonstrates that thinner peels are associated with higher juiciness and sweetness due to higher total soluble solids (TSS [3]) and a high brix-to-acid ratio (Rokaya et al., 2016; Timsina and Tripathi, 2019). Cohen (1976) reports that excessive potassium fertilisation can, conversely, increase peel thickness, which subsequently contributes to coarse peel texture, reduced juice content, increased acidity and a lower brix-to-acid ratio, all characteristics that diminish fruit quality. In pre-purchase scenarios in which tasting is not feasible, consumers rely on external cues, such as peel thickness, to infer internal quality. Peel thickness is thus a salient extrinsic indicator through which consumers form expectations about sweetness, juiciness and overall quality. This behaviour is consistent with Simons et al. (2018), Goldenberg et al. (2017) and Tarancon et al. (2021), who found that consumers frequently use external appearance cues, such as peel thickness, glossiness and surface uniformity, to assess internal quality.
Findings also suggest pre-harvest factors, such as rootstock [4] and orchard elevation significantly influences peel thickness. For example, Pectinifera rootstock and high-altitude orchards (1,300–1,400 masl) are associated with thinner peels, which are linked to an enhanced taste (Gora et al., 2022; Rokaya et al., 2016). Therefore, in the Nepalese context, promoting high-altitude mandarin cultivation and selecting rootstocks associated with thin peel could increase both consumer satisfaction and VC competitiveness.
5.2 Rethinking fruit size and grading practices
Contrary to conventional grading practices, extra-large mandarins received a negative utility coefficient, indicating consumers are averse to oversized fruit. This finding challenges the widespread assumption within VCs that larger fruits receive higher market value (Combrink et al., 2013). Instead, the preference patterns observed here suggest that consumers, particularly those purchasing for household consumption, tend to favour medium or small-sized mandarins. The results are consistent with research from Taiwan and the USA, which reports that fruit size plays a relatively small role in citrus quality evaluation (Huang et al., 2020; House et al., 2011). These views call for value chain actors to reconsider size-based grading approaches, particularly for extra-large size and rather emphasise attributes that closely align with consumer preferences.
5.3 Visual appeal and peel colour
Full orange peel colour was the second most preferred attribute, particularly among budget- and quality-conscious consumers. This confirms the role of visual appeal in consumer decision-making, consistent with the literature (Campbell et al., 2004; Goldenberg et al., 2017). In addition, Lima et al. (2025) confirm that perceived trust mediates the relationship between visual appeal and purchase intention. A full orange peel colour signals ripeness and sweetness (Gao et al., 2019), whereas greenish patches on peel are perceived negatively (Tarancon et al., 2021). Post-harvest treatments, such as de-greening [5] by ethylene can enhance peel colour without compromising flavour (Mayuoni et al., 2011), thus offering a practical strategy for farmers and markets in developing countries.
5.4 Freshness and trust in naturalness
Perceived freshness largely determines consumers' food choices, yet its comprehensive, consumer-centric definition remains lacking (Jaeger et al., 2023). The results of this study revealed that freshness, indicated by intact green leaves on the fruit peduncle, was positively preferred across consumer segments. In informal markets lacking certification, the presence of green leaves signals freshness, a recent harvest and minimal handling of fruit (Qian et al., 2014). Since freshness is a multidimensional construct shaped by sensory cues, emotional responses, and expectations of quality (Jaeger et al., 2023), harvesting with leaves is often discouraged due to concerns about future flowering. Rather, extension services should promote safe pruning practices, such as 10–20% pruning, to balance yield and market appeal (Aftab et al., 2021). Alternatively, harvest date labelling could serve as a freshness indicator in formal retail settings.
5.5 Segment-specific strategies
The LCM revealed three consumer segments, each with specific preferences and WTP profiles. The budget-conscious segment prioritises peel colour and price, showing little sensitivity to other quality attributes. In contrast, the quality-conscious segment values multiple attributes, including peel colour, size, freshness and thin peel. The pragmatic quality-seekers segment primarily comprises educated, older women with higher incomes who are experienced mandarin consumers, preferring thin-peeled mandarins.
These insights valuably guide VC upgrading. For instance, thin peel mandarins from high-altitude orchards could be positioned as a premium brand to target health-conscious, higher-income consumers in both domestic and international markets. Meanwhile, mandarins with orange peel, priced affordably, could appeal to more price-sensitive consumers. The WTP estimates highlight that consumers are willing to pay for specific attributes, which vary significantly across segments. Aligning production, harvesting and handling practices with consumer-valued attributes can increase producer margins and consumer satisfaction, ultimately enhancing market competitiveness. These findings equip VC actors and policymakers with the information needed to develop successful, segment-specific strategies that balance price efficiency with quality.
Consumers' preferences are influenced by a dynamic interplay of personal, social, economic, and environmental factors (Bett et al., 2013; Dominici et al., 2021; Jin et al., 2025). The socio-demographic characteristics of gender, income, education and age emerged as significantly influencing preference heterogeneity. Female consumers showed a strong positive preference for thin-peel mandarins, whereas male consumers favoured full orange peel colour. This difference may be associated with how men and women perceive health and nutrition (Baker and Wardle, 2003; Rondoni et al., 2020; Thomas et al., 2015; Quisumbing and Doss, 2021). In this study, gender, age, income, family size and consumption frequency emerged as the most influential factors in the heterogeneity of preferences for mandarin attributes.
From a marketing strategy perspective, consumer segments with distinct preferences reinforce the need for differentiated marketing strategies. In supermarkets and grocery stores, the findings emphasise the importance of shifting quality criteria away from size-focused grading towards consumer-preferred attributes, namely, thin peel, uniform colouration and visible freshness cues (e.g. green leaves). Online grocery and instant-delivery platforms can create new marketing opportunities by leveraging these insights. These platforms can display mandarin images by clearly highlighting peel thickness, colour and freshness cues to enhance the confidence of digital consumers, who rely heavily on visual cues (Lima et al., 2025).
Despite its contribution, this study has some limitations. First, the use of an orthogonal experimental design may have constrained the ability to capture complex interactions among attributes. More importantly, the analysis focused exclusively on external quality attributes and urban consumers in Nepal. As a result, the findings do not reflect consumer preferences for internal quality attributes or credence attributes. Furthermore, findings of this study cannot be generalised to rural consumers, who may differ in purchasing behaviour, income levels and quality perceptions, since sample was restricted to major urban markets in Nepal.
Future research could address these limitations by incorporating internal and credence attributes into discrete choice experiments to provide a more comprehensive assessment of quality preferences. The design should include both revealed preferences and organoleptic evaluations. Extending this analysis to consumers in export-oriented markets would also be valuable for evaluating whether Nepalese mandarins align with international demand and quality standards. Additionally, employing alternative experimental designs that allow for richer interaction effects and using visual choice sets (images) in contexts with lower literacy levels may further enhance methodological robustness and external validity.
6. Conclusions and implications
This study provides important evidence about consumer preferences for mandarin attributes in Nepal using a discrete choice experiment that reveals a clear hierarchy of attributes and a clear heterogeneity across consumer segments. Thin peel, full orange peel colour and freshness indicated by intact green leaves emerged as strongly and positively influencing utility, whereas extra-large sizes were negatively preferred. The identification of three distinct consumer segments demonstrated the importance of market segmentation strategies tailored to socio-demographic characteristics, such as gender, age, income and consumption frequency.
These findings offer several important implications for policymakers, VC actors and market intermediaries. From a policy perspective, the strong consumer preference for thin peel and freshness signals the need to integrate these preferences into mandarin development programs. Policies under the breeding program should incorporate consumer-preferred parameters into varietal development. Overall, by integrating consumer preferences into production, grading, marketing and policy interventions, stakeholders can foster more efficient, profitable and equitable mandarin value chains that benefit both producers and consumers.
Declaration of generative AI and AI-assisted technologies in the writing process
During the preparation of this work the author(s) used ChatGPT to improve the language and readability of the paper. After using this tool/service, the author(s) reviewed and edited the content as needed and take(s) full responsibility for it within the publication.
Notes
Sample size (n)
Peel colour, Size, Peel thickness, Seed content, Origin (local Nepali or imported from India), Freshness, Graded, Ease of peeling, Sweetness, Juiciness, Waxed, Price (per kg)
Total soluble solids in fruits, typically measured as 0Brix, are a measure of the sugar content and other dissolved solids in a fruit's juice or extract. This value is often used to indicate the sweetness and maturity of a fruit.
A rootstock is a part of a plant with a well-developed root system, to which a bud or scion from another plant is grafted.
De-greening in mandarins is a process used to remove the green colour (chlorophyll) from the fruit's skin after harvest, typically using ethylene gas treatment.

