This study investigates how corporate governance (CG) influences the alignment between firms’ environmental performance and their environmental disclosure practices. Drawing on the concept of policy–practice decoupling, the study examines whether CG mechanisms enhance the credibility and consistency of environmental reporting.
Using a panel dataset of 80 Johannesburg Stock Exchange-listed firms covering the period 2012 to 2023, the study employs panel-corrected standard error regressions and various robustness tests. Corporate carbon performance (CCP) is used as a proxy for environmental commitment, and environmental disclosure level (EDL) captures the extent of implementation.
The results show a significant positive relationship between CCP and EDL, suggesting that firms with stronger environmental performance are more likely to disclose information. Furthermore, corporate governance significantly moderates this relationship, with stronger governance associated with greater alignment between commitment and disclosure.
This study contributes to emerging literature on the role of governance in reducing policy–practice decoupling in sustainability. It offers evidence from an under-researched emerging market context (i.e. South Africa), where progressive governance reforms coexist with many implementation challenges. The findings offer insights for regulators, boards, and investors aiming to enhance the transparency and credibility of corporate sustainability practices.
1. Introduction
A good head and a good heart are a formidable combination [1]. – Nelson Mandela
Firms today face increasing pressure to commit to environmental goals and disclose their performance. However, many firms struggle to align their actions with their disclosures (Crilly et al., 2012). Some firms show strong environmental results but disclose little. Others disclose extensively but lack actual progress (Gull et al., 2023a). This gap is known as policy–practice decoupling (García-Sánchez et al., 2021). Decoupling is not always about deception. It can result from weak internal coordination or external pressures. Firms may disclose information to meet stakeholder expectations, even when implementation is weak. Recently, some research efforts have been devoted to understanding the organisational determinants of this phenomenon; however, the results remain somewhat confusing (Talpur et al., 2024). This study explores how corporate governance can reduce such misalignment.
Corporate governance includes the systems and structures that guide company behavior. Strong governance can improve transparency (Hussain et al., 2018). It can help align internal actions with external reports. Boards play a key role in monitoring performance and ensuring accountability. Prior studies suggest that strong governance supports consistency between what firms do and what they report (Ali et al., 2024; Hussain et al., 2023). This study examines the relationship between corporate carbon performance (CCP) and environmental disclosure level (EDL). Carbon performance is used as a measure of environmental commitment. Disclosure reflects a firm’s communication of environmental practices.
The key research question is whether corporate governance strengthens this relationship. In other words, does governance help firms walk their talk? This research uses data from South Africa. The country has progressive governance codes. It was the first to mandate integrated reporting. The King Reports emphasise ethics, performance, control, and transparency (IoDSA, 2016). Yet, many challenges remain, which include energy dependency, regulatory gaps, and high inequality. Despite strong frameworks, the implementation of environmental disclosure is uneven (Chalmers et al., 2023; Iredele and Moloi, 2020).
Since the release of the first King Report in 1994, issued to guide the South African economy transition from apartheid to a new democratic regime, Johannesburg Stock Exchange (JSE)-listed firms moved to the forefront with their well-known King Reports, and were the first to mandate integrated reporting. Where King I was the first to advocate a multistakeholder approach (Dube, 2016), its successor, King II, further innovated by setting out principles for sustainability reporting (Van Zyl, 2013). As King II resulted in a siloed approach with the preparation of separate sustainability reports (Van Zyl, 2013) King III required listed firms to, for the first time, prepare an integrated report that integrates sustainability reporting with financial reporting. To address accusations of mindless tick-box compliance by firms, King IV replaced King III in 2017. Although ethical principles were already core in King III, King IV placed an increased emphasis on ethics by expanding the King III RAFT [2] values by incorporating integrity and competence to establish ICRAFT (Rossouw, 2016). King IV defines CG as the exercise of ethical and effective leadership by the governing body towards the achievement of four governance outcomes: ethical culture, good performance, effective control, and legitimacy (IoDSA, 2016). Good governance should therefore result in transparent and ethical disclosure practices, the opposite of what is assumed with decoupling (Gull et al., 2023b). Empirical evidence, however, appears to report mixed results (Talpur et al., 2024).
To contribute to this growing stream of literature, this study examines the alignment of environmental management practices and EDL in the context of a developing country, where social issues often overshadow environmental concerns (De Villiers and Van Staden, 2006; Acar and Temiz, 2020). Developing nations frequently prioritise economic growth, but this growth is frequently linked to environmental degradation (Solikhah and Wahyudin, 2020). In such settings, a lack of stringent regulation (Netto et al., 2020) and ineffective CG reforms (Chai-Aun et al., 2016) further exacerbate issues, breeding opaqueness (Okyere et al., 2021). Using data from JSE-listed firms, this study aims to explore these dynamics. The study underscores the significant role CG plays in aligning CCP with EDL and helping firms walk the talk.
In South Africa, JSE-listed firms are required to publish integrated reports alongside compliance with the King Reports. Integrated reporting promotes “integrated thinking,” compelling firms to evaluate how they create value across six capitals: financial, manufactured, intellectual, human, social, and natural. Firms must consider both their dependence on and impact upon these capitals, enhancing transparency in value creation over time. Although South Africa has signed the 2015 Paris Climate Agreement and leads Africa in sustainability-related policies (Chalmers et al., 2023), research by Iredele and Moloi (2020) found no significant improvement in environmental disclosures among JSE-listed mining firms from 2015 to 2018. However, a comparison by Ofoegbu et al. (2018) between South Africa and Nigeria (where only traditional annual reports are required) found a positive link between integrated reporting and environmental disclosures. While South African firms were not labeled as “greenwashers” in a cross-country study (Yu et al., 2020), Nuhu and Alam (2024) noted low ESG reporting levels among energy firms in BRICS countries, including South Africa.
CG challenges persist in South Africa, compounded by issues like corporate scandals, corruption, and a reliance on fossil fuels, which makes it Africa’s largest polluter (DBSA, 2023). Despite the improved CG disclosures among JSE-listed firms (Ntim et al., 2012), compliance remains largely voluntary and varies significantly between firms (Scholtz et al., 2022). Additionally, with an average of 25 JSE firms delisting annually from 2015 to 2022, costs associated with regulatory compliance are often cited as a deterrent (Larkin, 2022).
To address these issues, this study employs a panel-corrected standard error regression (PCSE) model using a dataset of JSE-listed firms from 2012 to 2023. The final balanced dataset includes 960 observations from 80 firms across eight sectors. Environmental management disclosure (EDL) serves as the dependent variable, environmental performance as the independent variable, and CG as a moderating variable. Additional control variables are discussed in Section 3. EDL is measured using a framework with five dimensions and 31 items based on ISO standards ( Appendix A1), while environmental performance is quantified through the Refinitiv carbon emissions score, a standardised measure relevant to South Africa’s carbon-intensive economy. For CG, this study adopts a composite measure, consistent with the “bundles approach” to CG (Schnyder, 2012), rather than individual measures [3], aligning with King IV’s outcome-based approach in South Africa.
Findings reveal a statistically significant positive relationship between corporate carbon performance (CCP) and EDL, with CG positively moderating this relationship. However, CG’s significance emerges only at “higher” levels, indicating that enhanced CG strengthens environmental disclosures, thereby improving the alignment and transparency related to EDL.
This study contributes to the literature in three ways. First, it provides evidence from South Africa, an emerging economy with advanced reporting frameworks but limited empirical research on environmental disclosure practices (Wachira and Mathuva, 2022). Second, it focuses on the alignment between environmental performance and disclosure as a key indicator of reporting transparency. Third, it applies the Johnson-Neyman technique to show that the positive influence of corporate governance on this alignment becomes significant only at higher levels of governance quality.
2. Theoretical framework, prior related research and hypothesis development
This study draws on several theoretical perspectives to understand environmental disclosure practices. Signalling theory suggests that firms with robust environmental practices disclose their activities to reduce information asymmetry (Yekini and Jallow, 2012), mitigate adverse selection (Clarkson et al., 2011), and establish a competitive edge (Maas et al., 2014). Additionally, stakeholder theory, framed by the resource-based view, posits that firms seek legitimacy from stakeholders to secure capital. Khlif et al. (2015) found that, compared to Morocco, South African firms aligned with a stakeholder-oriented model report more social and environmental information, catering to investor expectations.
Both signalling and stakeholder theories indicate a positive link between CCP and EDL. However, evidence suggests that firms with poor CCP often emphasise environmental disclosures to legitimise their activities (Lindblom, 1994; Hughes et al., 2001; Patten, 2002; Clarkson et al., 2011; Dhaliwal et al., 2014; Bhagat, 2022). Agency theory explains this potential discrepancy, as managers may disclose favourable environmental information to benefit themselves rather than accurately reflect company performance. Legitimacy theory thus predicts both positive and negative relationships between CCP and EDL. Ashforth and Gibbs (1990) distinguish substantive (moral) legitimacy, which supports a positive relationship, from symbolic legitimacy, which aligns with the decoupling argument. Literature has acknowledged the prevalence of policy-practice decoupling. The policy–practice decoupling refers to the gap between what organisations commit to in formal policies and what they implement in practice. This phenomenon often arises when firms face conflicting demands from stakeholders, lack internal coordination, or operate under weak enforcement environments. Rather than assuming deliberate deception, decoupling theory highlights how symbolic actions, such as public disclosure, may not always translate into substantive change (Graafland and Smid, 2019). However, the quest for symbolic legitimacy may exist, which is driven by self-interest and short-term economic goals (Soobaroyen et al., 2023). In this regard, Jensen and Meckling (1976) propose that monitoring, such as CG, may mitigate agency issues and symbolic legitimacy.
2.1 Prior related research and hypothesis development
Research on the relationship between environmental performance, CG, and environmental disclosures has largely focused on developed countries, often examining polluting industries and single governance characteristics, such as board independence and board size. For example, Al-Tuwaijri et al. (2004) and Clarkson et al. (2008) analysed data from U.S. industries with high pollution, both finding positive associations between environmental performance and disclosure levels. Similarly, Baalouch et al. (2019) observed positive relationships using data from French-listed firms. Acar and Temiz (2020) further validated these findings using Turkish data, offering insight from a developing country by employing the Global Reporting Initiative guidelines. However, studies such as Freedman and Jaggi (1982), Sulaiman et al. (2014), and Hughes et al. (2001) reported weak or even negative relationships, suggesting the need for a nuanced view that considers variations across countries.
In terms of the economic benefits of sustainable business practices, studies show mixed results. Voinea et al. (2020) and Shrestha et al. (2023) report inconsistent outcomes, though Trumpp and Guenther (2017) found that firms adopting a proactive approach to environmental disclosure can achieve financial advantages. South Africa presents a unique context where, despite significant encouragement from standard setters, environmental disclosures remain largely voluntary (Chalmers et al., 2023). This mixed evidence suggests that the economic advantages of sustainability practices depend on factors such as industry, country, and regulatory environment.
Similarly, Gull et al. (2023a) argue that environmental decoupling restricts the integration of real environmental factors into investment decisions, while Garcia-Sanchez et al. (2021) highlight that it leads to resource misallocation and restricted capital access. In addition, the gap between walk and talk can reduce a firm’s market value (Hawn and Ioannou, 2016). This stream of literature strongly supports the idea of strong CG in place to ensure environmental practices align with actual performance and to reduce decoupling. In this vein, Siems and Alvarez-Macotela (2017) and Solikhah and Maulina (2021) argue that CG can restore trust and balance economic, social, and environmental interests, improving the quality of reporting. According to Aluchna et al. (2023), strong internal governance mechanisms, such as effective board oversight, can be instrumental in ensuring credible environmental disclosures, especially under the scrutiny of stakeholders and legitimacy pressures.
Additionally, CG’s role in shaping environmental reporting is influenced by regional and industry differences. For instance, Nuskiya et al. (2021) found that governance factors, such as board size, board independence, and board meeting frequency, were positively associated with environmental disclosures among Sri Lankan firms. Similar trends were observed by Matuszak et al. (2019) in Poland’s banking sector. However, studies from Pakistan (Gull et al., 2022) and Mauritius (Soobaroyen et al., 2023) reveal that governance reforms may not automatically enhance disclosure quality, suggesting that other factors also play a role. On the other hand, some recent studies show that governance effectiveness may help firms improve disclosure practices (Gull et al., 2023a, b).
Evidence suggests that firms with poor environmental performance may disclose more information in response to public pressure, often to influence stakeholders’ perceptions of their practices. For instance, Patten (2002) and Lindblom (1994) found that poor environmental performers tend to make more disclosures, which may serve as a form of legitimacy-seeking behavior to divert attention from their environmental shortcomings. In this regard, Fabrizio and Kim (2019) suggest that firms with a reputation for poor environmental performance often use language to downplay their issues, managing perceptions without fully addressing them. Conversely, Carlos and Lewis (2018) found that some U.S. firms may withhold environmental certification status if it poses reputational risks.
In South Africa, the King III and IV codes have significantly impacted CG, promoting trust, ethical leadership, and inclusivity. This study, inspired by Schnyder's (2012), Oh et al. (2018), and Hussain et al. (2023) uses the “bundling approach” and employs a composite CG score that includes dimensions of management, shareholder, and corporate social responsibility. The management score reflects a firm’s adherence to best practices, which enhances its reputation, attracts investors, and improves performance. The shareholder score measures equality in shareholder treatment, holding management accountable, and safeguarding rights. The corporate social responsibility score assesses a company’s commitment to incorporating financial, social, and environmental factors into decision-making. We argue that using a composite score provides better insights as it takes into consideration the complementary or substitutive effect that may exist between various governance mechanisms (Oh et al., 2018). Based on the above discussion, we hypothesise that:
Corporate governance positively moderates the relationship between environmental performance and environmental management practices disclosure, promoting transparency and enhancing the credibility of reporting.
3. Research design
To test the study hypothesis, this study employed a quantitative research approach based on secondary data analysis. We extracted all data from the Refinitiv database, a reputable and leading international source of information on financial, environmental, and governance data (Luo and Tang, 2021; De Villiers et al., 2022). This section describes the sample selection process, measurement proxies used for the dependent, independent, moderator, and control variables, and finally the empirical model employed to test the research hypothesis.
3.1 Data and sample
Over the period 2012–2023, the initial sample consisted of 2,964 company-year observations from South African JSE-listed firms in nine different sectors. Data collection therefore commenced with the King III effective date (i.e. financial years ending February 28, 2011), and spanned two governance regimes with King IV replacing King III in its entirety on 1 April 2017.
To maintain comparability, 612 financial sector firms were excluded due to their unique reporting and regulatory requirements, which would have made it difficult to make fair comparisons (Kamel and Awadallah, 2017; Yu et al., 2020; Aslam et al., 2021). Additionally, the study excluded a total of 1,392 company-year observations due to the absence of data on CCP, CG, or EDL throughout the study period. The final balanced panel dataset consisted of 960 company-year observations from 80 firms across eight different sectors. Although this study preferred a balanced dataset due to its ability to facilitate direct comparison between two governance regimes, as discussed above, such datasets are often criticised for survivorship bias. To address this, an unbalanced panel dataset was tested for robustness.
Table 1 outlines the final sample and the industry membership of the 80 firms included in the final study sample. Although most studies to date examined only environmentally sensitive (or polluting) industries, we argue that, as all JSE firms, regardless of industry membership, are required to report on natural capital, we contribute by also including industries assumed to be “less” sensitive (refer to Table 1).
3.2 Operationalisation of variables
Table 2 shows the measurement of the study’s variables.
3.2.1 Dependent variable
This study examined environmental management practices (EDL) as the dependent variable. The results of a factor analysis conducted by Trumpp et al. (2015) provide evidence that environmental management can be captured in terms of a framework consisting of five dimensions: environmental policy (EP), environmental objectives (EO), environmental processes (EPR), organisational structure (OS), and environmental monitoring (EM). These dimensions, as defined below, are based on ISO 14001 in combination with ISO 14031 (ISO, 1999; ISO, 2004).
EP is a commitment made by a company to take responsibility for the natural environment. It also outlines the organisation’s philosophy on improving CCP. EO are defined as specific goals and targets that are established to operationalise the environmental policy. EPR are specific procedures implemented by firms to enhance their operational performance in relation to the environment. OS is a formal management system that is established to achieve environmental objectives. Finally, EM involves the implementation of review processes and corrective measures to facilitate ongoing enhancements in environmental operational performance (Darnall and Edwards, 2006; Trumpp et al., 2015).
Following previous studies (Xie and Hayase, 2007; Trumpp et al., 2015; Aslam et al., 2021), EDL is measured using a set of 31 items that are categorised into the five sub-dimensions identified by Trumpp et al. (2015). A score of one is assigned to each of the 31 items if disclosed by the company, with zero if not disclosed. This study calculated an EDL score for each company by dividing the company’s total disclosure score by 31. Higher scores indicate greater efforts in disclosing environmental management practices, reflecting a superior level of disclosure. In line with Guthrie and Mathews (1985), a Cronbach alpha coefficient of 0.879 confirmed the reliability (internal consistency) of the instrument used to measure EDL. Moreover, the estimate of the Cronbach’s coefficient was 0.704, 0.809, 0.796, 0.695 and 0.621 for categories EP, EO, EPR, OS, and EM, respectively. Additionally, the relationship between the total score of EDL and its respective categories (EP, EO, EPR, OS, and EM) was examined using Pearson correlation and Spearman’s rank correlation. The data presented in Table 3 demonstrates a high and statistically significant positive correlation between the EDL and every category of the index. As a result, we can infer that the total score of the EDL accurately represents each category of disclosures, thereby confirming the index’s reliability (Kamel and Awadallah, 2017). The 31 items measured to calculate an EDL score per company is listed in Appendix A1.
3.2.2 Independent variable
This study uses Environmental performance (CCP) as the main independent variable. CCP has become a crucial issue for firms in recent years, as it is an indicator of their operational performance and has attracted the attention of various stakeholders (Xue et al., 2020). Following Xu et al. (2022), Aliani (2023), and Tanthanongsakkun et al. (2023), we measured CCP, using the carbon emission score extracted from Refinitiv. The score provides a percentile rank that assesses a company’s effectiveness in reducing environmental emissions in its production and operational activities relative to its industry, with high scores reflecting superior performance. Although broader environmental performance measures may include aspects like water usage or waste management; carbon emissions are a particularly significant and crucial environmental concern in South Africa, as evidenced by national and international policy frameworks, including the Paris Climate Agreement (Chalmers et al., 2023).
3.2.3 Moderator variable
This study uses the level of CG practices as a moderator variable. The governance score for each company was collected from Refinitiv Eikon Environmental, Social, and Governance (ESG) scores. As discussed in the hypothesis development section, the CG score assessed commitment to CG principles by considering CG strengths and weaknesses related to management, shareholders, and corporate social responsibility (Bătae et al., 2021; Widyawati, 2021). The CG score ranged between 0 and 100, with a higher score suggesting superior governance practices.
3.2.4 Control variables
Following previous studies, we controlled for leverage (LV), financial distress (Zscore), financial performance (FP), company size (CSZ), current ratio (CR), and sector. In addition, we also control for governance reform (Reform) in South Africa as our study spanned two CG regimes as discussed in the hypothesis development section. Table 2 summarises the proxies used to measure these control variables and includes examples of previous studies that used similar control variables to control for variations in disclosure. All control variables were collected from Refinitiv Eikon. This study, in keeping with Hünermund and Louw (2020), does not make any assumptions about the directional relationships of the control variables, nor does it discuss the regression results in the results section of this paper. Control variables often correlate with other unobserved factors, potentially rendering the marginal effects uninterpretable (Hünermund and Louw, 2020).
3.3 Model and estimation method
This study employed static panel data analysis to consider variations in the independent and control variables across firms and over time (Baltagi and Baltagi, 2008). Three panel data models were proposed: pooled ordinary least squares (OLS), the random-effects model (REM), and the fixed-effects model (FEM). To determine the appropriate model, several statistical tests were applied. First, the Breusch-Pagan Lagrange multiplier test was conducted to compare the OLS with the REM (Breusch and Pagan, 1980). The findings (p < 0.01) indicate that the REM was more appropriate than the OLS model. Second, the F-test was conducted to compare the OLS model with the FEM model. The results (p < 0.01) suggest that the FEM model was statistically superior to the OLS estimation (Balestra, 1992). Finally, the Hausmann test was used to determine whether the individual effects for every company were fixed or random. The results (p < 0.05) reveal that the REM was statistically preferable to the FEM (Hausmann and Korte, 1978). The results of each test for each model are presented in Table 6.
Additionally, several tests were conducted to assess the omitted variable bias problem, heteroskedasticity, serial autocorrelation, and cross-section dependency to confirm the absence of any bias that could potentially affect the significance of the coefficients. A Ramsey (1969) regression specification-error test was conducted to examine the presence of an omitted variable problem. The results displayed in Table 6 for each model indicate that the models do not exhibit any potential omitted variable bias at a significant level of 5%. Moreover, the Breusch-Pagan/Cook-Weisberg test for heteroskedasticity indicated that the structure of the errors among the panels was heteroskedastic (p < 0.05). Furthermore, the Wooldridge test for autocorrelation in panel data indicated the presence of a first-order autocorrelation problem. The Pesaran (2004) scaled Lagrange multiplier test was conducted to identify potential cross-section dependency. As a result, to obtain unbiased and efficient estimates, the Beck and Katz (1995) a PCSE [4] estimation was employed to correct for heteroscedasticity, first-order autocorrelation, and cross-section dependency problems in the dataset (Torres-Reyna, 2007). This estimation method is appropriate for panel data with a larger number of firms than time periods (Reed and Ye, 2011). To examine the relationship between CCP and EDL, the following regression model was employed:
where i and t respectively stand for company and year, respectively; , are regression coefficients, EDL is the environmental management practices disclosure level, CCP is the CCP, CG is the corporate governance level, and εit is the error term. All variables included in the above model are described in Table 2.
To examine the moderating effect of CG on the relationship between EDL and CCP, an extension is made to model 1 by incorporating the interaction variable as follows:
The variable CG was interacted with the CCP to examine its moderating effect on the CCP-EDL relationship. The CCP and CG variables were mean centred to avoid multicollinearity associated with the CCP * CG interaction term (Aiken et al., 1991; Howell, 2012).
Finally, model 2 was extended to control for governance reform, leverage, financial distress, financial performance, company size, liquidity, and sector as follows:
All variables included in the above model are described in Table 2.
4. Empirical results and discussion
This section provides descriptive statistics, a correlation analysis, the results of regression models (1) to (3), and concludes with a summary of the robustness and endogeneity tests that were conducted to confirm the main results.
4.1 Descriptive statistics
Table 4 displays the descriptive statistics of the study variables. It shows the mean, overall standard deviation (variation over time and firms), within standard deviation (variation within firms over time), between standard deviation (variation between firms), as well as the minimum and maximum per variable.
The mean EDL is 0.413, suggesting that firms generally disclose 41.3% of the environmental information, with a standard deviation of 0.189. The variation between firms is 0.155 and within firms is 0.109, suggesting that firms maintain a relatively consistent level of disclosure over time, while also exhibiting noticeable differences between them. The Environmental Policy (EP) has the highest level of disclosure, with an average of 0.554. This indicates that firms are more likely to have well-defined and effectively communicated environmental policies. This could be attributed to the growing regulatory requirements and an increasing focus on sustainability reporting frameworks, as discussed in Sections 2 and 3. On the other hand, the Environmental Objectives (EO) show the highest overall variation (0.351), between (0.278), and within (0.216) variation. There are notable differences observed among firms when it comes to setting specific environmental objectives and targets. One reason for this may be the inclusion of both environmentally sensitive and less environmentally sensitive sectors, and therefore firms, in the study sample. The mean BSZ is 11.173 members, with a standard deviation of 2.437, indicating a moderate variation in board composition. The variation between firms (1.986) is higher than the within-firm variation (1.429), suggesting that board size tends to remain stable within firms over time but varies significantly across firms. This reflects diverse corporate governance practices. The mean NBM is 6.037 and the standard deviation is 2.622, with higher variation within firms (2.080) than between firms (1.606), indicating that the frequency of meetings can fluctuate significantly over time depending on strategic or operational needs. The mean BGD is 0.258, which means that, on average, about 25.8% of board members are women. The relatively low standard deviations overall (0.123), between (0.086), and within (0.089) suggest limited variability, both across and within firms, likely due to slow changes in board composition over time. BIN has a high average of 0.739, implying that approximately 74% of board members are independent on average. The standard deviations (overall: 0.096, between: 0.078, within: 0.055) are relatively low, indicating consistency in firms’ adoption of independent governance structures.
Finally, ACI shows a very high mean value of 0.919, suggesting that audit committees are composed almost entirely of independent directors in most firms. Variation is low (overall SD: 0.139), with slightly higher differences between firms (0.104) than within firms (0.093), reflecting stable governance practices.
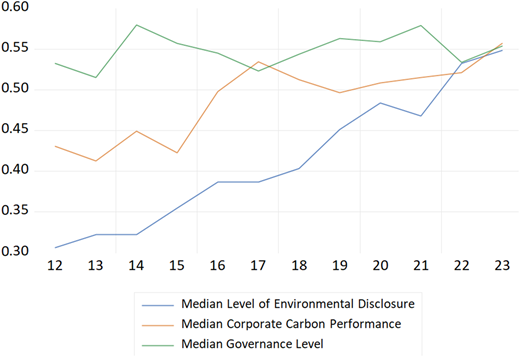
Figure 1 illustrates the patterns of EDL, CCP, and CG from 2012 to 2023. The EDL line graph illustrates a consistent upward trend from 2012 to 2023, suggesting a positive progression in the EDL over the years. One possible explanation for this could be the rise in regulatory requirements and the growing emphasis on sustainability reporting frameworks as discussed. The CCP line graph exhibits fluctuations, demonstrating a general upward trend. The variability in CCP indicates that there have been improvements, but these improvements do not remain consistent from year to year. This result confirms the findings of the descriptive statistics, which show high variability in CCP among various firms over time, suggesting that some firms put significant effort into adhering to regulations, which leads to improved performance. Finally, the CG line demonstrates stability in governance levels over time with a gradual improvement. The enhancements indicate a continuous effort to improve governance frameworks, specifically with the implementation of King III and King IV as discussed in the Introduction.
The mean CCP score is 0.476, with a standard deviation of 0.261. This indicates that, on average, firms demonstrate moderate effectiveness in reducing environmental emissions. The variation in carbon performance is greater between different firms (0.219) than within the same company over time (0.143). This suggests that there is more variability in carbon performance across firms compared to within a single company. On the other hand, the average CG score is 0.542, with a standard deviation of 0.207. This indicates that firms on average demonstrate a moderate level of commitment to CG principles. The variation in governance level between different firms is higher (0.164) compared to the variation within the same company over time (0.127). This suggests that there is more variation in governance practices across different firms than within a single company.
4.2 Correlation analysis
Table 5 displays the correlation coefficients of the study variables.
EDL is positively and significantly correlated to CCP, CG, LV, FP, CSZ, and CR, indicating that firms with a high level of governance, superior carbon performance, high leverage, high financial performance, large company size, and more liquid firms are more inclined towards environmental disclosures. Pearson correlation coefficients for all independent variables are less than 0.7, indicating the absence of a multicollinearity problem (Blumberg et al., 2014). Additionally, the variance inflation factor confirms that there is no issue of multicollinearity, as all the values were below the threshold of 4.95 (Shrestha, 2020).
4.3 Regression estimation results
To test the study hypothesis, Table 6 displays the regression results of models 1, 2, and 3 for the full sample. Regarding model 1, the results indicate an R2 of 0.778, indicating that the independent and control variables account for 77.8% of the variability in EDL.
The findings in model 1 show that CCP has a significant and positive effect on EDL (β1 = 0.507, p < 0.01). However, the findings indicate that the level of CG has no significant direct impact on EDL (β2 = −0.024, p > 0.01). The findings indicate that firms with high CCP are more likely to provide higher environmental disclosures, regardless of their CG levels. This suggests that firms exhibiting robust carbon performance are more inclined to participate in transparent environmental reporting, potentially motivated by the necessity to communicate their environmental accomplishments to stakeholders. On the other hand, CG exhibits an insignificant direct effect on EDL, which indicates that CG may not serve as a principal factor influencing environmental disclosure. These results provide support for studies that have used data from developed countries (Clarkson et al., 2008; Baalouch et al., 2019; Amin et al., 2024) by using data from a developing country.
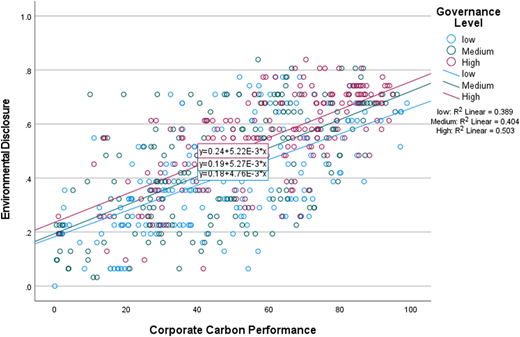
Model 2 builds on Model 1 by incorporating the interaction term (CCP*CG). The findings closely correspond to those obtained from Model 1. The results show an R2 value of 0.781, suggesting that the independent variables explain 78.1% of the variability in EDL. Additionally, the results show a significant and positive (β3 = 0.046, p < 0.01) coefficient for the interaction term (CCP*CG), indicating that CG moderates the relationship between CCP and EDL. This suggests that firms with superior governance structures may be more successful at employing their carbon performance to improve the level of their environmental disclosures. The dual effect, in which CCP independently influences EDL while CG enhances this relationship, highlights the significance of CG in facilitating effective communication of environmental efforts by firms with strong carbon performance. This led to the acceptance of the study hypothesis. To further aid our understanding of the moderation effect, the Johnson-Neyman technique supported by moderation graphs was applied and displayed in Figure 2, [5]. The results of this technique revealed that the moderating effect of CG varies across different levels of compliance. At lower levels of CG compliance, the relationship between CCP and EDL was weak, indicating that firms with less effective governance structures do not significantly improve their environmental disclosures based on carbon performance. Conversely, as CG compliance increased, the moderation effect intensified. This indicates that firms with higher governance levels are more inclined to align their environmental disclosure practices with their carbon performance, utilising governance mechanisms to facilitate more transparent and reliable reporting.
4.4 Robustness and endogeneity
To investigate the robustness of the results, we conducted several additional analyses, as displayed in Table 6 (model 4), VII (models 5–8), VIII and IX (models 9–15). First, the FEM was estimated after replacing CCP by an alternative (but inverse) measure, CO2E, which represents the natural logarithm of the total carbon emissions. The results displayed in Table 6 (Model 4) depicts the expected negative relationship between high carbon emissions and the EDL, as well as the expected moderating effect of CG.
Second, we estimated a REM to test whether the relationship between CCP and EDL could be explained by time-invariant factors. The results of the REM in Table 7 (Model 5) are consistent with the main study results (FEM in Table 6).
The FEM is frequently inefficient due to its failure to account for individual-level variation in the sample. Additionally, when dealing with panel data where the number of individuals (N) is large, the FEM can encounter the incidental parameter problem (Pesaran, 2015). As a result, the Hausman and Taylor (1981) estimation approach was employed as a robustness test (model 6) to address the bias in parameter estimates resulting from endogenous unobserved effects. This method also enables the estimation of time-invariant variables (such as sector) that would otherwise be excluded from the FEM (Greene, 2003). Unlike the FEM, this approach tackles concerns about endogeneity by using an instrumental variable technique to distinguish between endogenous and exogenous variables. Endogenous variables that are time-invariant are adjusted by subtracting their individual means, while endogenous variables that are time-variant are adjusted using both exogenous variables that are time-invariant and exogenous variables that are time-variant (Baltagi et al., 2003). Under The Hausman-Taylor approach, time-variant variables such as CCP and FP were treated as endogenous, and their deviations from their means served as instruments. Time-invariant variables, such as Sector and Reform, were treated as exogenous and were included directly in the model. The results of the Hausman-Taylor estimation (Model 6) were consistent with the main study results. To test the validity of the instruments, the Hansen-Sargan overidentification test was carried out. The results reveal that one cannot reject the null hypothesis (χ2 = 7.42, p-value = 0.1155). Thus, the instruments employed are valid. This suggests that the results are robust and hold consistent across fixed effects, random effects, and Hausman-Taylor estimations. In addition, the Hausman (1978) specification test shows that the main study variable CCP is exogenous (χ2 = 28.457, p-value <0.05).
Fourth, to address the survivorship bias, a thorough collection of data was undertaken, encompassing both firms that did not survive the specified period and those with incomplete data. The data set consists of 1,152 company-year observations collected from a total of 96 firms. The results of this analysis (Model 7) were consistent with the main results, which suggest that the relationships between CCP, EDL and CG are robust, providing evidence of the reliability of this study’s results. In addition, the real estate sector was excluded from the sample, and similar results were produced (untabulated).
Fifth, the bias corrected Anderson-Hsiao first differenced instrumental variable estimator was employed (Model 8). It is a first-differenced instrumental variable estimation address the issues of endogeneity, heteroskedasticity, and serial correlation simultaneously. It uses the second and third lags of the dependent variable either as differences or lagged levels to construct the instruments (Anderson and Hsiao, 1982). This method is particularly suitable for situations where the number of cross-sectional units (N) is large compared to the number of time periods (T), which is exactly the case in this study (Renato Soares Terra, 2011). It guarantees more reliable and unbiased estimations of parameters, thus enhancing the credibility of results derived from the FEM (Bun and Carree, 2006). The model utilises an FD2SLS estimator to effectively fit a panel-data model incorporating a lagged dependent variable. The analysis was performed in Stata using the xtlsdvc command. The findings align with the primary study results, except for the CSZ, which was found to have no significant impact.
Finally, the FEM was estimated after replacing CG by seven individual CG variables that are widely used in the literature (Giannarakis, 2014; Janggu et al., 2014; Hussain et al., 2018, 2025; Ali et al., 2024; Nuhu and Alam, 2024), namely: board size (BSZ), number of board meetings (NBM), board gender diversity (BGD), board independence (BIN), CSR Sustainability Committee (CSR), CEO-chairman duality (CEO), and audit committee independence (ACI). The seven CG variables were first individually introduced into the regression models in Table 8. The results displayed in Table 9 depicts the expected positive relationship between CCP and the ED. Moreover, the interaction terms in Table 9 show that some governance characteristics—particularly NBM and BGD—positively moderate the CCP–EDL relationship, reinforcing the role of active and diverse boards in enhancing environmental transparency.
5. Conclusions
To the authors’ best knowledge, this is the first study using data from JSE-listed firms to examine the impact of CCP on EDL and the moderating role of CG on this relationship. First, consistent with signaling theory predictions, we document a statistically significant positive relationship between CCP and EDL, which remained robust across additional analyses, including an alternative (but inverse) proxy for environmental performance (CO2 emissions). Second, our results demonstrate the moderating role of CG in strengthening the CCP-EDL relationship, supporting the agency theory prediction that establishing an argument that strong CG helps firms walk their talk. Third, the Johnson-Neyman analysis suggests that CG has an impact only when firms prioritise its implementation. Therefore, there are minimum CG compliance levels (or a “critical mass”) needed before CG exerts influence.
By disclosing their environmental management practices, firms with strong environmental performance can differentiate themselves from poor performers, leveraging the competitive advantage of being less likely to be mimicked by such firms. Extant research in this domain shows that when firms under-report, they miss this opportunity, and the financial market reacts negatively to such corporate actions (Hawn and Ioannou, 2016). Assuming an absence of or negative relationship between CCP and EDL could indicate symbolic legitimacy practices; the moderating role of CG reinforces the importance of CG in building and restoring trust between firms and stakeholders. Based on our results, we cautiously argue that the overall governance quality of a firm is a strong channel to achieve environmental transparency.
The findings of this study have important implications for both theory and practice. Theoretically, our work contributes to the environmental decoupling literature by demonstrating that corporate governance plays a moderating role in aligning environmental commitments with disclosure practices. This supports the notion that governance structures act as an important control mechanism that aligns disclosure policy with practice. Practically, the findings provide valuable insights for regulators, executives, and investors. For regulators, the findings highlight the need to strengthen governance rules that promote diversity, independence, and accountability on boards. For boards and business leaders, the data suggest that investing in strong governance systems can enhance the credibility of sustainability reporting. For investors and stakeholders, governance quality can be a useful indicator for assessing the reliability of environmental information.
This study, however, has limitations warranting future research. First, ownership variables (such as institutional shareholding) and different levels of stakeholder involvement (e.g. environmental activists) may impact disclosure practices. Second, this study assumes that ISO 14001 and the environmental management practice disclosures measured are equally applicable across all sample firms. Third, it does not attempt to measure the quality of environmental disclosures, nor does it include alternative environmental performance metrics, such as water usage and waste management. Fourth, we did not explore other potential motivations for firms to disclose (or withhold) environmental information, including “brownwashing” to reduce stakeholder attention. Future studies could examine the mediating or moderating roles such motivations may play in the performance-disclosure relationship.
Finally, the study focuses on JSE-listed firms, resulting in a relatively small sample size that limits statistical analyses, such as sub-sampling. Future studies could employ advanced econometric techniques, such as Difference-in-Differences, to explore the causal effects of CG reforms.
We thank the guest editor and anonymous reviewers for their guidance and insightful comments.
Appendix
Regression results – using EDL individual dimensions
| Dependent variable | Model 1 Y = EP | Model 2 Y = EO | Model 3 Y = EPR | Model 4 Y= OS | Model 5 Y = EM |
|---|---|---|---|---|---|
| Variables | Coefficients | ||||
| Intercept | −1.028 (0.741) | −2.394** (0.949) | −0.960 (0.689) | −0.670*** (0.190) | −2.649 (0.833) |
| CCP | 0.218*** (0.024) | 0.482*** (0.039) | 0.225*** (0.024) | 0.108*** (0.011) | 0.510*** (0.032) |
| CG | −0.029 (0.017) | −0.007 (0.028) | −0.018 (0.017) | 0.008 (0.004) | 0.033 (0.024) |
| CCP*CG | 0.102*** (0.010) | −0.003 (0.014) | 0.021** (0.011) | 0.149* (0.086) | 0.002 (0.010) |
| Reform | 0.374*** (0.020) | 0.178*** (0.040) | 0.344*** (0.019) | 0.007 (0.006) | 0.269*** (0.032) |
| LV | 0.461*** (0.118) | 0.106 (0.194) | 0.720*** (0.131) | 0.045 (0.030) | 0.615*** (0.164) |
| Zscore | −0.021 (0.031) | −0.105* (0.060) | −0.097*** (0.032) | 0.021*** (0.008) | −0.149*** (0.051) |
| FP | −0.107*** (0.017) | 0.040 (0.028) | −0.054*** (0.018) | −0.030*** (0.007) | −0.072*** (0.022) |
| CSZ | 0.045 (0.080) | 0.228** (0.100) | 0.043 (0.073) | 0.072*** (0.020) | 0.252*** (0.089) |
| CR | 0.038** (0.016) | 0.092*** (0.027) | 0.024 (0.016) | 0.002 (0.003) | −0.008 (0.023) |
| Hausman test χ2 | 32.296*** | 12.343 | 27.651*** | 32.935*** | 12.069 |
| likelihood ratio F-test | 10.970*** | 13.270*** | 19.957*** | 23.856*** | 19.166*** |
| Breusch-Pagan LM | 847.971*** | 1240.803*** | 1650.424*** | 1783.518*** | 1769.590*** |
| Model | Fixed effects model | Random effects model | Fixed effects model | Fixed effects model | Random effects model |
| Observations | 960 | 960 | 960 | 960 | 960 |
| R2 | 0.704 | 0.340 | 0.763 | 0.764 | 0.434 |
Note(s): ***p < 0.01, **p < 0.05, *p < 0.1 and robust SE between parentheses
Notes
For this study, good governance can be viewed as “having a good head” and implementing effective environmental management practices as “having a good heart”.
Responsibility, Accountability, Fairness and Transparency.
We have also provided results related to individual governance elements in the additional analysis.
Panel-corrected standard error regression (PCSE).
The Johnson-Neyman output that displays the conditional effects of CCP based on the CG levels are available from the corresponding author upon request.
Supplementary material is available upon request.