Surprisingly little is known of the various methods of security analysis used by financial analysts with industry-specific knowledge. Financial analysts’ industry knowledge is a favored and appreciated attribute by fund managers and institutional investors. Understanding analysts’ use of industry-specific valuation models, which are the main value drivers within different industries, will enhance our understanding of important aspects of value creation in these industries. This paper contributes to the broader understanding of how financial analysts in various industries approach valuation, offering insights that can be beneficial to a wide range of stakeholders in the financial market.
This paper systematically reviews existing research to consolidate the current understanding of analysts’ use of valuation models and factors. It aims to demystify what can often be seen as a “black box”, shedding light on the valuation tools employed by financial analysts across diverse industries.
The use of industry-specific valuation models and factors by analysts is a subject of considerable interest to both academics and investors. The predominant model in several industries is P/E, with some exceptions. Notably, EV/EBITDA is favored in the telecom, energy and materials sectors, while the capital goods industry primarily relies on P/CF. In the REITs sector, P/AFFO is the most commonly employed model. In specific sectors like pharmaceuticals, energy and telecom, DCF is utilized. However, theoretical models like RIM and AEG find limited use among analysts.
This is the first paper systematically reviewing the research on analyst’s use of industry-specific stock valuation methods. It serves as a foundation for future research in this field and is likely to be of interest to academics, analysts, fund managers and investors.
1. Introduction
A billion-dollar question in accounting and finance is if price equals value on the stock market. The theoretical value of an asset is the present value of its infinitely expected cash flow. The equality of price and value can be expressed in the form:
where is the price at time t = 0, is the fundamental value at time t = 0, CF is the cash flow (dividends or free cash flow) and r is the discount rate.
If price equals value, the underlying assumption is that there is an efficient market where investors cannot systematically use potential mispricing to achieve risk-adjusted abnormal returns. Fama (1970) refers to this assumption as the “efficient market hypothesis” and suggests that the price of a stock incorporates all available information. However, empirical tests of market efficiency do not test the equivalence of price – and value. Instead, they focus on the predictability of returns.
The calculation of value is a matter of forecasting cash flow and discounting cash flow to a present value. Financial analysts (referred to henceforth as “analysts”) are the main users of valuation models and play an important role in international stock markets (Brown et al., 2015).
According to Ivkovic and Jegadeesh (2004, p. 434) analysts.
… possess the ability to gather a wide variety of information not readily available to investors and to efficiently process that information.
Thus, analysts act as intermediaries in stock markets by bridging the gaps in the information held by firms and investors; they also contribute to the stock market through interactions with underwriters, brokers, investors, management, and the media. Analysts are some of the primary users of financial statement information, and their reports – which include earnings forecast, stock recommendations and target prices – provide valuable information to several market participants.
1.1 Analysts’ use of valuation models
Unsurprisingly, analyst’s behavior has caught the attention of many academic studies. It is widely recognized that the stock market reacts to analysts’ revisions of earnings forecasts (Givoly and Lakonishok, 1979; Stickel, 1991, 1992; Gleason and Lee, 2003; Hilary and Hsu, 2013), analysts’ stock recommendations (Womack, 1996; Loh and Stulz, 2011; Bradley et al., 2014; Kudryavtsev, 2019; Berkman and Yang, 2019) and target prices (Bilinski et al., 2013; Bradshaw et al., 2013, 2019; Da et al., 2016). It is also documented that analysts’ forecasts are superior to time-series models (Fried and Givoly, 1982; Brown et al., 1987a; Givoly et al., 2009; Bradshaw et al., 2012) and analysts’ forecasts are often used as a proxy for market expectations in capital markets research (Fried and Givoly, 1982; Brown et al., 1987b; Hughes et al., 2008; So, 2013; Ashton and Trinh, 2018; Kim, 2018).
The important role analysts play of analyzing companies in the stock market has increased academic interest in analysts’ use of valuation models. In the second half of the 1900s the valuation models used by analysts were influenced by earnings multiples and were only slightly affected by more theoretically correct models (Arnold and Moizer, 1984; Olbert, 1994).
After the burst of the Internet bubble in 2000, things changed and sophisticated models (e.g. DCF, RIM, etc.) came into greater use. Rutterford (2004, p. 141) summarizes this shift:
… the share valuations of the late 1990s could not be explained by ratios. New sectors such as the internet spawned companies with no balance sheets or earnings to speak of. Analysts were forced to turn to forecasting cash flows, and to assume high growth rates, to be able to determine values close to market prices.
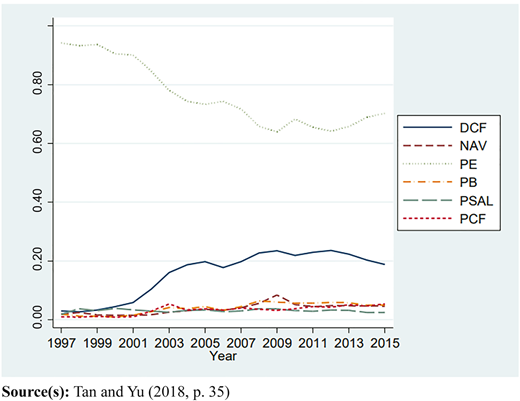
The increased use of sophisticated models at the beginning of the 21st century is well documented (Flöstrand, 2006; Imam et al., 2008, 2013; Bancel and Mittoo, 2014; Markou and Taylor, 2014; Demirakos et al., 2004; Brown et al., 2015; Hand et al., 2017; Pinto et al., 2019). Hand et al. (2017) found that residual income models where rarely used by financial analysts and 97% of the users of residual income models where analysts from Morgan Stanley. Tan and Yu (2018) have examined the changes in analysts’ use of different valuation models during 1997–2015, as shown in Figure 1. The use of price/earnings (P/E) decreased during this period, and the shift in the use of different valuation models started around the year 2000; however, the use of discounted cash flow (DCF) was still less than the use of P/E.
There are at least four reasons for this shift in the use of valuation techniques. First, a greater emphasis on multi-period models was driven by the post-2000 stock market collapse and by heavy criticism of research quality by analysts focusing on short-term valuation using multiples (Rutterford, 2004). The second reason was the development of textbooks in the 1980s and 90s that placed greater emphasis on DCF-models (e.g. Rappaport, 1986; Copeland et al., 1990; Damodaran, 1994; Penman, 1997), which had a delayed effect on the valuation models used by financial analysts. The third reason was increased demand from institutional investors for more detailed information on valuation preferences, which could not be provided through multiples (Brown et al., 2016). The fourth reason was that analysts were mandated to disclose their valuation methods and provide a reasonable basis to justify their target price forecasts, according to NASD rule 2,711 titled “Research analysts and research reports”, which was approved in 2002 by the Securities and Exchange Commission (SEC) [1].
1.2 Analysts’ industry knowledge
It is well documented that analysts’ industry knowledge is the attribute appreciated the most by fund managers and institutional investors (Bagnoli et al., 2008; Kadan et al., 2012; Brown et al., 2015) and that analysts with prior industry experience have better forecast accuracy, Bradley et al. (2017a, b).
However, researchers studying analysts’ valuation models have suggested that the focus of research should be on the context within which analysts make their decisions (Ramnath et al., 2008; Bradshaw, 2011; Brown et al., 2015). This currently unknown context is often referred to as the analysts’ “black box”. Opening the black box of analysts’ decision processes is important to both academic researchers and professional investors in order to examine the industry-specific valuation methods analysts employ to produce earnings estimates, target prices, and stock recommendations.
Analysts’ use of valuation models is a well-documented field. Nevertheless, surprisingly little is known of the various methods of security analysis used by analysts with industry-specific knowledge (Quirin et al., 2000). The variables and factors that influence the value of companies can vary widely from one industry to another. Understanding the variables that are the main value drivers within different industries increases the knowledge of important aspects of value creation and enables an improved pricing of stocks within each industry.
Snyder (2019, p. 339) claims that a literature review can pinpoint research gaps if there is certainty that the research is accurate. By reviewing what has already been studied, researchers can identify areas where more research is needed. The purpose of the present literature review is to examine what valuation models and valuation factors are used by analysts in different industries. The goal is to shed light on how analysts assess the value of companies in various sectors and what models and factors they rely on.
1.3 Literature search
We have reviewed research journals in accounting and finance that are related to security analysis and financial statement analysis. Our initial selection of journals included important international accounting journals, in search for articles with an emphasis on analysts’ use of industry-specific valuation models and valuation factors (i.e. Journal of Accounting Research, Accounting Review, Accounting and Business Research, International Journal of Accounting, Financial Analysts Journal, Review of Accounting Studies, European Accounting Review, Journal of Investing, Journal of Accounting and Economics, Contemporary Accounting Research, Journal of Financial Reporting). Later, the selection of journals was expanded as references in papers from these pre-selected journals. We have also searched for research articles using Google Scholar based on the following keywords: financial analyst, valuation models, industry, DDM, DCF, RIM, multiples, real estate, health care, pharmaceutical, biotechnology, industrial, technology, utility, banks, insurance.
2. Valuation models and target price accuracy
2.1 Valuation models
When analysts attempt to bridge the gap between price and value, they utilize a variety of valuation models and metrics. Their utilization of valuation models can be categorized into two primary categories: theoretical models, and multiples.
2.1.1 Theoretical models
Analysts typically employ a theoretical model that revolves around forecasting cash flows and then discounting them to their present value. In essence, this valuation model centers on predicting future cash flows, dividends, or earnings and determining appropriate discount rates. Two widely recognized theoretical valuation models, the dividend discount model (DDM) and the discounted cash flow model (DCF), fall into the category of value distribution models. These models focus on how a company’s value is allocated among various stakeholders.
In contrast to the value distributing models, a value creating model starts with an anchored value and calculates the value that is created infinitely from that starting point. A well-known value creating model is the residual income model (RIM), which was popularized by Ohlson (1990, 1995) and Feltham and Ohlson (1995). It originates historically from Preinreich (1938, p. 240), who stated that “capital value equals the book value, plus the discounted excess profits”. RIM relies on accounting data to determine a company’s fundamental value. It´s based on the company´s book value and the discounted value of all future residual earnings, following the principle of clean surplus accounting, which equates book value at to book value at plus earnings at minus dividends at : .
The residual income model is expressed as:
were is the price of the stock at t = 0, is the book value at t = 0, is the net income at t = 1 and r is the cost of equity capital.
The residual income can also be expressed using a ratio, ROE, which means that the residual income becomes (, where ROE = . It follows that the value is only affected by the residual income if ROE ≠ r.
An extension of the RIM was proposed by Ohlson (2005) and Ohlson and Juettner-Nauroth (2005). Instead of anchoring the model on book value they used capitalized next-period earnings as a replacement. They called the model Abnormal Earnings Growth (AEG) and it is based on the capitalized earning at time plus the perpetual value of the abnormal earnings growth. The AEG is defined as
were NI is the net income and D is the dividend and r is the cost of equity capital. The AEG is the change in NI minus the retained earnings on NI that was not distributed to shareholders as dividends.
The AEG model is not depending on clean surplus accounting as it is relying on forecasted earnings and is also not affected in per-share valuations by share issuance or repurchase of shares. These characteristics make the AEG model a versatile and flexible tool for valuing companies, particularly in situations where earnings growth is a central driver of value. The model is expressed as
were is the price of the stock at t = 0, is the forecasted earnings at t = 1, is the abnormal earnings growth and r is the cost of equity capital.
2.1.2 Multiples
When utilizing multiples, the price is based on a selection of comparable firms operating within the same industry, exhibiting similar size, growth and risk characteristics (Alford, 1992; Bhojraj and Lee, 2002). This practice is underpinned by the efficient market hypothesis, which posits that the average of the multiples of comparable firms determines the firms’ price since that price reflects its value. The most commonly used multiples are the earnings multiples (price/earnings and EV/EBITDA), book value multiples (price/book), and revenue multiples (price/sales and EV/sales).
2.1.3 Hybrid models
Economic Value Added (EVA) is a valuation model used to assess a company’s ability to generate profits in excess of its cost of capital.
It’s anchored on capital, defined by Stewart (1991) as a company’s net assets (total assets less non-interest-bearing current liabilities and marketable securities). The present value of future EVA is subsequently added to capital. It is then calculated after deducting the market value of outstanding debt, denoted as D.
Real option valuation refers to specific projects that incorporate valuing tangible assets or projects in the context of uncertainty and flexibility. Unlike DCF methods, real option valuation considers the various options and strategic decisions that can be made during the life of an investment or project. It is the potentially added value of an option to expand outside the company’s ongoing business. When a value of a real option is decided, the value of the firm is the sum of the two components: DCF plus the option value to expand. Another way of using real option is considering the value of an ongoing project and the value of abandon projects if the project turns unprofitable or if market conditions deteriorate. Real option valuation involves simulations and complex mathematical models to calculate the added value to an original valuation.
2.1.4 Accuracy of theoretical models
Using an average of analysts' forecasts as a base in valuation models is a common approach in academic research. Researchers often use this method to evaluate the performance of different valuation models or to assess the accuracy of stock price forecasts. Francis et al. (2000) conducted a comparative analysis of the accuracy of DDM, DCF, and RIM, revealing that RIM exhibited significantly superior performance compared to DDM and DCF. They based their research on annual forecasts from Value Line spanning 1989 to 1993. Their assessment included accuracy and explainability, gauging cross-sectional variation. Their explanation for RIM’s superiority hinged on the premise that distortions in book values resulting from accounting procedures and choices were less severe than the forecast errors and measurement errors in discount rates and growth rates witnessed in DDM and DCF. Notably, the proportion of value estimates represented by the book value of equity within RIM was 72%. In contrast, DDM and DCF heavily relied on terminal values, with estimates representing as high as 65% and 82%, respectively, in comparison to the 28% excess residual income contribution in RIM. Their conclusion underscored that RIM’s potency lies in a more substantial reliance on book value to elucidate intrinsic value, thereby enhancing accuracy and explainability.
Penman and Sougiannis (1998) utilized finite-horizon forecasts across durations of one, two, five, and eight years, paired with actual realized dividends, free cash flows, and earnings. Their investigation demonstrated that RIM yielded lower valuation errors against stock prices compared to DCF and DDM. They contended that one reason for RIM’s superiority over DCF was that DCF subtracts capital investments from operating cash flows to estimate free cash flows, potentially leading to negative free cash flows for extended periods. Bernard (1995) conducted a test comparing RIM and DDM across a sizable sample of firms from 1978 to 1993. The results showed that the RIM approach explained 68% of the stock price variation, whereas the corresponding figure for DDM was a mere 29%.
None of the reported studies had compared AEG to other theoretical models. However, Ohlson (2005, p. 325) claimed that AEG worked better than RIM when estimating values in the near future. He meant that AEG captured the idea “that the expected earnings capitalized generally approximates the expected market value closer than the expected book value”. Ho et al. (2017) compared the reliability of DDM, RIM and AEG on the US market using analysts’ one- or two years forecast. They found that the AEG valuation estimates were more reliable than the other models when they measured the means of absolute pricing errors. On the other hand, Jorgensen et al. (2011) found that RIM outperformed AEG when the forecasting period was extended, and they also found that AEG tended to overvalue stocks. Similar results were found in the Scandinavian markets by Anesten et al. (2020), who concluded that AEG performed surprisingly weak compared to DDM and RIM.
2.1.5 Target price accuracy
Analysts can use sophisticated and unsophisticated models together or separately (Imam et al., 2008; Demirakos et al., 2010; Cavezzali et al., 2019). They use valuation models as a tool to produce earnings estimates, stock recommendations, and target prices. Target prices are the most important valuation metric for analysts, as they are informative beyond earnings forecasts and stock recommendations (Brav and Lehavy, 2003; Asquith et al., 2005). Therefore, it is important to explore what valuation models leads to the best target price accuracy.
Demirakos et al. (2010) found that analysts used DCF models significantly more frequently than P/E when estimating target prices. Overall, DCF models were used more frequently for companies at high risk, companies in distress, small firms and industries with a limited number of peers.
Huang et al. (2023) reported that market reactions to target price changes were more pronounced for companies with lower earnings quality and higher risk when using a DCF model for calculations. This suggests that the DCF model is particularly valuable to analysts when assessing companies with greater levels of uncertainty. Similar results were reported by Gleason et al. (2013), who found that the RIM was superior for estimating companies’ fundamental value and for producing accurate target prices, compared with a PEG valuation model. They commented:
… the investment value of analysts’ price target opinions is reduced substantially when those price targets are seemingly derived from a valuation heuristic using inferior earnings forecasts, (Gleason et al., 2013, p. 112).
3. Analysts’ industry knowledge and valuation factors
Kadan et al. (2012) reported that institutional investors value analysts’ industry knowledge, based on a yearly ranking in Institutional Investor Magazine during 1998–2010 in which industry knowledge was ranked as the most important research attribute each year. Bagnoli et al. (2008, p. 301) similarly referred to the high ranking of industry knowledge during the magazine’s yearly ranking in 1998–2003 and other studies have shown similar results (Groysberg et al., 2011, 2012; Wong and Cheung, 1999; Huikku and Pöyhiä, 2020). Industry knowledge is also important for analysts in producing earnings forecasts, target prices and recommendations (Boni and Womack, 2006; Merkley et al., 2017; Bradley et al., 2017a, b). Brown et al. (2016) confirmed that buy-side analysts most appreciated input for stock recommendations from sell-side analyst was their industry knowledge. Brown et al. (2015) discovered that industry knowledge was more useful for analysts in determining earnings forecasts than private communications with management, earnings conference calls and management’s earnings guidance. They concluded,
… industry knowledge is the single most useful input to analysts´ earnings forecasts and stock recommendations (Brown et al., 2015, p. 3).
According to Brown et al. (2015) analysts also considered their industry knowledge to be more important for their compensation than, for instance, their analyst ranking or their written reports and stock recommendations. Thus, industry knowledge is an important component for analysts in stock valuation and it also improves their forecast accuracy.
3.1 The valuation approach
The first step when examining data categorized by industry is to define which industry or sector a company belongs to. The decision on how to classify companies is key for differentiating what valuation method and information sources analysts use among – and within – industries when valuing stocks. Although industries can be somewhat loosely defined, the Global Industry Classification Standards (GICS) [2] is a well-known and often used categorization.
The Global Industry Classification Standards (GICS) is the most widely used industry classification system by investment banks and has been adopted by many stock markets around the world. GICS has four classification levels, encompassing 11 sectors, 25 industry groups, 74 industries, and 163 sub-industries. Bhojraj et al. (2003) compared SIC (Standard Industry Classification), FF (Fama and French, 1997), NAICS (North American Industry Classification System) and GICS. They found that the GICS classifications better explained stock return comovements, cross-sectional variations in valuation multiples, forecasted growth rates, R & D-expenditures, and various financial ratios. Hrazdil and Zhang (2012) confirmed that concentration ratios, the Herfindale-Hirshmann (HHI), and the C4-index, based on the GICS, better captured industry concentration within the manufacturing industry than SIC. Kadan et al. (2012) showed that GICS closely align with how brokers define their industries, in comparison to SIC, FF and IBES internal classification. According to Boni and Womack (2006), 81% of the analysts at the 20 largest brokerages covered companies within one GICS industry. Hradzil et al. (2014) concluded that the GICS system offers advantages over both SIC and NAICS, while Chung et al. (2017) suggested that GICS should be utilized in research designs as the primary industry classification system.
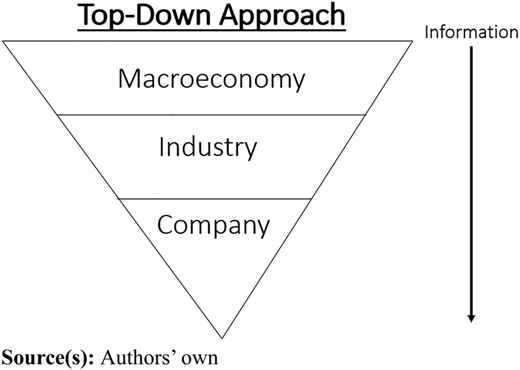
Sell-side analysts usually specialize on a particular industry and issue equity reports reflecting their understanding of a company’s industry, strategy and quality of management as well as the analysts’ knowledge of company valuation and investor sentiment. Analysts who are industry experts usually follow a top-down approach when valuing stocks, as described in Figure 2. They start with the macroeconomic trends and forecasts (i.e. the GDP, interest rate, currency) and how these affect industries’ performance. The analysts then determine the outlook of the industry and decide which companies fit that outlook best. The final step is to value the stocks, provide a recommendation (i.e. buy-hold-sell) and determine a target price. Imam and Spence (2016, p. 227) noted that the sell-side analysts’ main role is to ‘provide rich contextual information on companies and industries.
3.2 Factors in industry valuation
According to Quirin et al. (2000) surprisingly little is known of the differential methods of security analysis used by analysts with industry-specific knowledge. They stated,
Very little prior research has contributed to the contextual needs of researchers and investors by identifying valuation fundamentals useful to a specific industry. (Quirin et al., 2000, p. 816)
Defining the factors that are the main value drivers in different industries will improve our understanding of value creation in these industries. In most industries, some form of earnings construct is considered to be the primary value driver (Nissim, 2013, p. 326). Hand et al. (2017) noted that the selection of valuation model was strongly related to the firm’s industry; they found that, of the analysts who only used RIM, 76% followed companies within the financial sector.
Ramnath et al. (2008) concludes:
Opening the black box containing the process by which analysts convert earnings forecasts into price forecasts could provide interesting insights into the valuation models that are most relevant to investors and into the allocation of scarce resources in capital markets. (p. 52)
What is currently known about analysts’ use of industry-specific valuation models?
In a recent study by Olbert (2023) on the US market, he found that P/E was the preferred valuation models in 20 of the 25 industry groups from GICS. EV/EBITDA was the preferred model within telecom, energy, and materials. Price/cashflow (P/CF) was the number one in capital goods, indicating that cash flow metrics, particularly cash flow from operations, are significant in this industry. Finally, price/adjusted funds from operation (P/AFFO) were utilized most within the real estate investment trust (REITs) sector.
Table 1 summarizes the preferred models within the 25 industry groups. Price/book (P/B) is frequently used within the financial sectors, including banks, diversified financials, and insurance. DCF is frequently used within the pharmaceutical, biotechnology and life sciences sectors, as well as within real estate management and development, and REITs. Apart from being the preferred model within capital goods, P/CF is also used in the energy and IT hardware sectors. Price/sales (P/S) is used significantly more within media and entertainment, auto and components and energy sectors. The energy sector exhibits a wide variety of valuation models, suggesting the difficulty of establishing which value drivers are important within this sector. Notably, theoretical models like RIM and AEG are not utilized by analysts. Additionally, the DDM is mentioned only insignificantly.
Below, we synthesize the findings from studies based on surveys or content analyses, focusing on a limited number of industries that differs from the mainstream industries where P/E is the preferred model. These findings emphasize that the choice of valuation model can significantly vary depending on the industry’s unique characteristics, financial priorities, and the factors that are most relevant for assessing a company’s value.
3.3 Energy
Quirin et al. (2000) sent a questionnaire to analysts and asked them to rank nine fundamental signals they considered to be important in the oil and gas industry. The most important signals were discretionary cash flow/outstanding shares, EV/EBITDA, reserve replacement efficiency, reserve replacement ratio, and margin per barrels of oil equivalent (BOE). Huikku and Pöyhiä (2020) interviewed nine analysts covering the Finnish listed energy company, Neste. Findings from the interviews revealed that five analysts’ used EV/EBITDA or EV/EBIT as their preferred model, indicating a strong emphasis on enterprise value and earnings metrics. Three analysts combined EV/EBITDA with other metrics, such as P/E, DCF or P/B. One analyst specifically used the DCF model for valuation. All analysts pointed out that industry-specific and company-specific reasons were the main factors influencing the primary valuation model choice. Chlomou and Demirakos (2020) studied the valuation models used by analysts together with a sum of the parts (SOTP). They found that DCF was used more often in the oil and gas-sector. The findings from Olbert (2023) showed that EV/EBITDA was the preferred model among US analysts, followed by P/CF, DCF and P/S. These results emphasize the significance of specific financial metrics related to enterprise value, cash flow, and reserve replacement efficiency that underscores the industry’s unique characteristics and financial priorities.
3.4 Telecom
Glaum and Friedrich (2006) examined the telecommunication industry and interviewed 25 industry analysts. The industry-specific measures considered to be most important were average revenue per user (ARPU), number of customers/subscribers, customer churn rate and customer retention cost. Most of the analysts used DCF as their primary valuation model, and only used multiples to validate their DCF valuation. The variables with the highest relevance for analysts were sales and sales growth, EBITDA, free cash flow and operating cash flow. Earnings-based performance variables were of less importance. Block (2010) discovered that EV/EBITDA was the primary multiple used in telecommunication services. Imam et al. (2013) found from eight analysts equity reports that most of the analysts used two or more valuation models and that P/E and DCF were the preferred models. The findings from Olbert (2023) supports the earlier results from Glaum and Friedrich (2006), where EV/EBITDA is the preferred model, followed by other cash metrics like DCF and P/CF. The use of a combination of models, as observed in these studies, reflects the diverse and dynamic nature of the telecommunications industry.
3.4.1 Financial sectors
Damodaran (2013) argues that when valuing financial service firms, cash flow is not easily measured. Instead, he favors P/B and P/E as the primary choice in this sector. P/B was the preferred choice in the financial sector, followed by P/E in the results from a questionnaire by Block (2010). Nissim (2013) studied insurance companies and found that P/B was the predominant valuation multiple included in analysts’ reports. He also found that P/B conditioned on ROE were often used both in the insurance and banking industries but where rarely used in the nonfinancial sectors. Gianfrate and Vincenzi (2014) found that the DCF-model increased the target price accuracy, compared to multiples, for Italian bank analysts. Olbert (2023) noted that P/B was frequently used within the financial sectors, including banks, diversified financials, and insurance, although P/E was the preferred model in all sectors. These preferences reflect the specific financial and accounting characteristics of the financial services sector, where traditional valuation metrics like P/B and P/E are highly informative.
3.4.2 Real estate
In the real estate sector, most of the studies concentrate on valuation of REIT (Real Estate Investment Trust). Graham and Knight (2000) examined whether fund from operations (FFO), a key financial metric for REITs, is a better measure than accrual earnings for valuing these entities. The results supported the notion that cash flow, represented by FFO, is more important than accrual-based earnings in valuing REITs. Sahin (2009) found that metrics like P/AFFO and P/B produced valuation errors that were less than those associated with P/E and EV/EBITDA. She defined the valuation error for each multiple as ln of estimated value divided by market value. However, Vincent’s (1999) study provided a different perspective. It did not find support for FFO relative to earnings in the context of stock returns. In fact, earnings had a stronger association with stock returns than FFO, EBITDA and cash from operations (CFO). Regardless of the reported studies, Olbert (2023) found that P/AFFO is the most valuable valuation model when analysts are determining target prices.
3.4.3 Pharmaceuticals and biotechnology
The pharmaceutical and biotechnology industries may rely on a combination of models, due to the long-term nature of product development and the importance of future cash flows. Papadopoulou (2012) found that out of 66 analysts equity reports, 35 used DCF as their preferred valuation model, followed by earnings multiples (29) and sales multiples (10). Olbert’s (2023) study reinforced the prominence of DCF as a frequently used valuation model within the pharmaceutical, biotechnology and life science industries, only P/E was utilized more by the analysts.
The studies outlined here were carried out both before and after the turn of the millennium which may have affected the results, because the increased use of DCF did not occur until the 21st century. Some studies asked the analysts how they ranked different valuation models, while other studies used content analysis to examine what valuation model analysts used. The choice of research method can affect the outcome depending on the researcher’s interpretation of what the analysts say they do (questionnaire) and what they actually do (content analysis). However, the results from Olbert (2023) are an up-to-date understanding of analysts' valuation model preferences within specific industry characteristics and confirms what valuation models’ analysts prefer within 25 industry sectors using the GICS industry characteristics. The use of standardized industry classifications like GICS helps ensure consistency and comparability across sectors and underscores the importance of considering the context and timeframe when interpreting research results.
4. Conclusions
Surprisingly little is known of the various methods of security analysis used by analysts with industry-specific knowledge. It is clear that analysts’ industry knowledge is greatly appreciated by fund managers and other institutional investors (Bagnoli et al., 2008; Kadan et al., 2012; Brown et al., 2015). However, little attention has been paid to developing an awareness and understanding of financial analyst’s use of industry-specific valuation models and valuation factors. This literature review examined the valuation models and valuation factors analysts use in different industries and found that there is a gap that must be filled in order to enhance current knowledge of industry-specific valuation models.
After the turn of the millennium, more sophisticated – and theoretically sound – valuation models began to be used by analysts, such as the DCF model (Demirakos et al., 2004; Imam et al., 2008; Brown et al., 2015; Pinto et al., 2019). Notably, theoretical models like RIM and AEG are not utilized by analysts at all (Olbert, 2023). Nevertheless, P/E remains the preferred model in several industries. Olbert (2023) found that P/E was the preferred valuation models in 20 of the 25 industry groups from GICS. The exceptions being EV/EBITDA within telecom, energy, and materials, P/CF was the number one in capital goods, and finally P/AFFO were utilized most within the REITs sector.
The energy sector exhibits a wide variety of valuation models used by analysts (EV/EBITDA, P/DF, DCF, P/S), suggesting the difficulty of establishing which value drivers are important within this sector. Telecom is another sector with a great variety among analyst’s utilization of valuation models (EV/EBITDA, DCF, P/E, P/CF). These findings emphasize that the choice of valuation model can significantly vary depending on the industry’s unique characteristics, financial priorities, and the factors that are most relevant for assessing a company’s value. The financial sectors (banks, diversified financials, and insurance) differ from other sectors where P/E and P/B are the valuation tools commonly used by analysts. The pharmaceutical and biotechnology sectors are predominantly used with P/E and DCF. The emphasis on DCF, is due to the long-term nature of drug development and the importance of future cash flows. Finally, it is worth noting that within the REITs sector is the predominant model by analysts, although Vincent (1999) found that earnings had a stronger association with stock returns.
These insights emphasize the importance of industry-specific knowledge when selecting the appropriate valuation model. Different sectors have unique financial structures and characteristics that make certain models more suitable than others. This paper contributes to the broader understanding of how analysts in various industries approach valuation, offering insights that can be beneficial to a wide range of stakeholders in the financial market. It serves as a foundation for future research in this field and is likely to be of interest to academics, analysts, fund managers, and investors. The paper focuses exclusively on industry specific valuation models used by analysts. It does not provide information on specific measures used by analysts, such as discount rates, terminal values, risk-free rates, or growth forecasts. We leave these aspects for future research.
Notes
In 2015, the SEC approved FINRA rule 2,241 to adopt the content in NASD 2711 with some modifications.
The GICS contains 11 sectors: Energy, Materials, Industrials, Utilities, Healthcare, Financials, Consumer Discretionary, Consumer Staples, Information Technology, Communication Services and Real Estate.