


The objective of this study is to mitigate the risks of a blood shortage. The authors designed two simulation studies to identify the superior methodology that can decrease the impact of a massive national donor shortage.
The simulation designs are triggered by the COVID-19 pandemic. The first simulation examines the company’s choice of strategic partners (regionally and nationally), and the second inspects creating a national coordinated effort to organize a pooled blood inventory that would require blood centers to contribute a small percentage of their monthly donations to become a member.
The results indicate that both methods can significantly manage the risk of stockouts regardless of the availability of safety inventory in a blood center; however, although more effective in reducing the number of shortages per month, creating a national blood pool causes the shortages to be recognized earlier than desired.
The authors contribute to the literature by focusing on the potential risk of blood shortage because it directly impacts healthcare, hospitals’ costs and their ability to provide care. Though a handful of researchers have targeted the study of the blood supply chain, there is not any article that is similar to this study.
1. Introduction
During the past several years, there has been an increase in scholarly work targeting healthcare, and considerable emphasis has been placed on improving healthcare operations to reduce costs (Dai & Tayur, 2019; Cho & Zhao, 2018). At the same time, the risks associated with the healthcare industry remain to be fully addressed even though the industry is facing an increasing array of daily risks. According to Privett and Gonsalvez (2014), some of the risks are uncertainty in demand, inventory, order management, product life cycle and access to limited resources. We contribute to the literature by focusing on blood product stockouts because the pandemic demonstrated it is a significant risk as it directly impacts healthcare, in particular hospitals’ costs and ability to provide care. For example, in September 2020, during a Think-Tank meeting hosted by the Commonwealth Transfusion Foundation (CTF), the CEO of a large hospital in Kentucky, United States, explained that during mid-pandemic many surgeries were canceled due to a lack of blood availability rather than a shortage of staff and personal protective equipment. He mentioned that blood transfusions increased by 16% in his hospital, while other operations, such as emergency visits, decreased by 3% to 17%. While the nation’s blood centers are mostly equipped to manage repetitive crises like hurricanes, the sudden shortage of donors that happened during the pandemic turned out to be very difficult to handle, stressing that more research must focus on potential stockout risks and their mitigation.
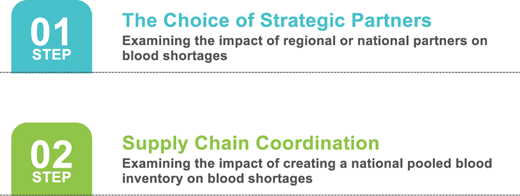
This study investigates and compares two methods to determine which one can better manage blood shortages. First, we examine the organization’s choice of strategic partnerships for decreasing blood shortages. Second, we test a coordinated effort to create a national pooled blood inventory for which the blood centers are required to contribute 5% of their current inventory weekly to become a member. Figure 1 demonstrates our two approaches. The goal of our study is to examine whether a nationally coordinated effort is required to decrease the risk of blood shortages or can blood centers rely on their own choices for a strategic partnership.
Although we target blood shortages, we believe that our investigation can be applied to a diverse group of perishable products. Though several researchers have targeted the study of the blood supply chain, we are not aware of any published research that is similar to this study. For example, several researchers have utilized modeling to examine the effect of natural disasters on inventory management but have not focused on supply risks (blood availability). Similarly, Patil, Ray and Saha (2018) have used mathematical modeling to overcome the challenges of over and understocking blood during the regular operation due to seasonal variation, while others have used mathematical modeling, stochastic programming and linear programming to ensure an adequate inventory of blood during and after natural disasters (Abbasi & Hosseinifard, 2014; Duan & Liao, 2014; Dillon, Oliverira, & Abbasi, 2017; Zahiri & Pishvaee, 2017; Samani, Torabi, & Hosseini-Motlagh, 2018; Habibi-Kouchaksaraei, Paydar, & Asadi-Gangraj, 2018; Samani & Hosseini-Motlagh, 2019; Hosseinifard, Abbasi, Fadaki, & Clay, 2020). The blood supply chain literature points to other studies targeting stockout risks, but they primarily focus on the distribution of blood and demand uncertainty. For example, Rahamani (2019) suggests a p-criterion technique to protect against the risks associated with distribution, and Fortsch and Khapalova (2016) and Rajendran and Ravindran (2019) target demand uncertainty and demand forecasting techniques. Hence, there is room to study the potential risk and mitigation of blood shortages that can negatively impact the hospitals’ profitability and the care for the patients.
The rest of the paper is organized as follows. In Section 2, we discuss the literature and the blood supply chain. Section 3 explains the research design for the two simulations and the goal of our study. Section 4 discusses the simulation results followed by conclusions and limitations of the study in Sections 5 and 6, respectively.
2. Literature and blood supply chain
2.1 Understanding the blood supply chain
Blood operations must be economical because most of the nation’s blood centers are nonprofit organizations. Therefore, they are vulnerable to costs and complexities (RAND, 2016). Osorio, Brailsford and Smith (2015) define the blood supply chain as “the processes of collecting, testing, processing, and distributing blood and blood products from donor to recipient”. The above statement, however, does not reveal that blood is a multi-billion-dollar industry that directly impacts the nation’s hospitals’ profit margin. On a side note, there is slight disagreement among the blood executives about whether blood should be called a gift of life, a public good, a commodity, or a natural resource. The argument about labeling blood correctly is that an appropriate label can make administrators more sensitive to operational effectiveness and opportunities. For example, calling blood a natural resource would send a message to blood managers suggesting that although blood saves lives, it is still a business and must be operated effectively and efficiently.
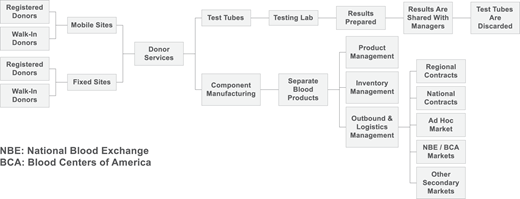
Aside from blood availability, blood centers face challenges like demand uncertainty (Nagurney & Dutta, 2019; Fortsch & Khapalova, 2016), inventory management, limited available resources (Privett & Gonsalvez, 2014) and random distribution of the donor arrivals (Fortsch & Perera, 2018). To make blood operations easier to comprehend, we created a simplified process flow diagram depicting a series of activities required for this industry. Figure 2 presents this general process flow diagram where blood is donated, tested, packaged, inventoried and distributed to the customers.
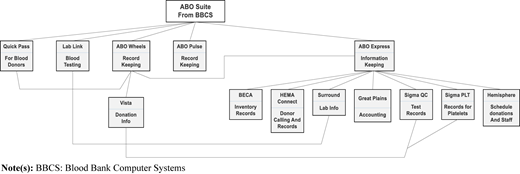
Throughout the blood operation, the staff members communicate extensively using sophisticated and up-to-date technology shown in Figure 3 called BBCS. BBCS stands for “Blood Bank Computer Systems”, and the main platform uses the term “ABO” to reference different blood types (Duan & Liao, 2014). BBCS has various software modules that allow various applications, also shown in Figure 3. These modules include ABO Quick Pass – an electronic questionnaire process for donors that replaces the traditional paperwork. ABO LabLink records the results of blood testing and makes them available to authorized staff. ABO Wheels is an online registration, screening, and collection application for fixed and mobile sites to ensure the accuracy of the collection process. ABO Pulse keeps track of key metrics related to donors and generates automatic reports. ABO Express is a centralized software system that keeps track of collections, inventory, donor testing, transfusion services, shipping and billing activities. ABO Market allows the hospital ordering and fulfillment to be recorded (not shown in the diagram); most blood centers we visited did not use the ABO Market section of the system, and finally, ABO Recruit, which is used for donor scheduling (not shown in the diagram). All visited blood centers used the BBCS software, which included information about donor scheduling, donor arrival times, collected units, test results, inventory units and management and customer orders. Interested readers can visit the following website for more information: http://www.bbcsinc.com/products/abo-suite/.
As with other products, the supply and demand of blood usually do not match locally. For example, in one region, the demand for blood can be higher, equal to, or lower than the nationwide average, while the blood supply may not follow the same pattern across regions. To some extent, the peaks and valleys of supply and demand are caused by large hospitals and densely populated zones. However, as we will see shortly, the regional supply–demand mismatch is helpful for our investigation because they do not all share the same risks at the same time. Figure 4 presents the four regions in the United States, an estimate of the population per region, a “rough” estimate of the number of blood centers (based on our investigation), and blood centers per million residents for each region.
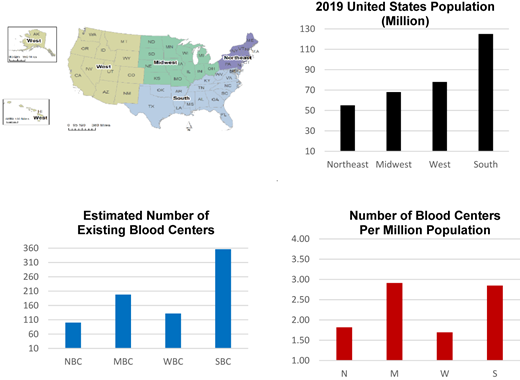
Four regions of the US, population per region, a rough estimate of the number of blood centers in each region (RAND, 2016) and the number of blood centers per million residents for each region
Four regions of the US, population per region, a rough estimate of the number of blood centers in each region (RAND, 2016) and the number of blood centers per million residents for each region
Approximately 50+ independent community blood centers are selling blood locally and through the Blood Centers of America (BCA). While BCA does not collect any blood, it is one of the nation’s largest networks of blood suppliers and distributors that makes it possible for blood centers to move blood across the country and allow hospitals to collaborate across the nation. BCA provides 5.4+ million units of blood products annually to healthcare and scientific clients, including some pharmaceutical companies (interested readers are encouraged to use the following link for more information about BCA, https://bca.coop/about-us/). On the other hand, it is worth noting that not all blood centers are members of the BCA. To the best of our knowledge, BCA does not require blood centers to donate a percentage of their weekly blood inventory to a national pooled blood inventory to be a member of the BCA. But our study will consider the impact on blood shortages if there was a national pooled blood inventory that member blood centers would be required to donate to.
It is not clear how many blood packages are collected nationwide because multiple players are engaged in the operation, the federal government does not preserve data for blood collection or usage, and the nation’s hospitals do not share their historical data for blood usage nationally. However, it is estimated that the total collected units are in millions annually (RAND, 2020). Note that community blood centers are not the only suppliers of blood; other suppliers include hospital blood banks, America’s Blood Centers, the American Red Cross and the Armed Services Blood Program.
While hospitals participate in a national collaboration to obtain blood, exchange blood inventory, and decrease operational costs, most blood centers do not collaborate as such. Our visits to five blood centers show that the community blood centers are independent and have strong incentives to create alliances with local partners to reduce the cost of resources, logistics, and blood testing. While it is undoubtedly true that regional partners could help reduce costs, in this paper, we focus on how national partnerships can offer protection against the risk of blood shortage.
2.2 Literature and the disruption in blood supply
Supply chain disruptions have long been a topic of interest to academia and practitioners (Craighead, Blackhurst, Rungtusanatham, & Handfield, 2007). Disruption is defined as “an interruption of normal operation that is caused by an unforeseen incident” (Simpson & Hancock, 2017). The researchers took a fresh look at this supply chain phenomenon during the pandemic. Craighead, Ketchen and Darby (2020) introduced an agenda for supply chain management research based on their understanding of the critical well-known and emergent theories. The authors discovered several approaches for handling supply chain disruptions caused by the pandemic, including resource dependence theory, institutional theory, resource orchestration theory, structural inertia, game theory, legal options theory, event systems awareness-motivation-capability framework, prospect theory and tournament theory. Craighead et al. (2020) refer to Pfeffer and Salancik’s (1978) discovery that external entities constrain a firm’s ability to manage abrupt shifts in supply and demand. Therefore, a firm’s dependence on outside actors, such as suppliers, can potentially reduce its ability to deal with shortages and other unexpected changes in demand or supply during a pandemic. Structural inertia theory posits that environmental conditions are the primary driver of a firm’s survival; hence, it reinforces the fact that blood centers are firmly motivated to collaborate regionally but not nationally.
2.3 Connecting with blood executives for our empirical study
Before and during the COVID-19 pandemic, we visited five community blood centers in the United States. Before the pandemic, we visited one blood center in Michigan and another one in Iowa, and we stayed in each facility for one week to monitor the details of the blood operation. After the pandemic, we visited two blood centers in the state of New York and one in Indiana via Zoom. The names of these blood centers are not disclosed due to the proprietary nature of the operations. Moreover, in September 2020, one of the authors was invited to a Think-Tank meeting hosted by the CTF. This meeting assembled several US blood executives and administrators from various hospitals, blood centers, the American Association of Blood Banks (AABB), the BCA and researchers to discuss the pandemic-related challenges facing the nation’s blood industry. Notes from this productive Think-Tank meeting and our visits to the blood centers and hospitals were used to design our simulations and help us conclude at the end. According to some of the presenters, at the beginning of the pandemic, blood demand declined by 40% nationwide due to canceled surgeries. Later in the pandemic, when hospitals resumed surgeries, blood demand sharply increased. However, during this surge in demand, blood centers suffered a major blood shortage as many donors stayed home or did not donate blood. Research indicated that the blood shortage was not just a problem in the US; for example, Gehrie, Frank and Goobie (2020) and RAND (2020) indicate that the COVID-19 pandemic created blood shortages worldwide.
Osorio et al. (2015) broke down the decisions in the blood supply chain by hierarchy level: strategical – tactical – operational. After careful analysis of our notes, we noticed that the challenges facing the nation’s blood centers are mostly strategic. We discovered that although the uncertainty associated with donor availability should have been the primary concern, it was the operational costs that were the main target and the reason behind strategic decisions to line up partnerships.
3. Research design
The literature indicates that there are two significant concerns for blood centers, one is the uncertainty about supply – having a sufficient number of blood donors, and the other is the uncertainty about demand. Both can contribute to the risk of blood shortages. However, they do not both present the same level of risk. The blood literature indicates that sophisticated forecasting methods or coordination with hospitals can be used to manage demand uncertainty. For example, Fortsch and Khapalova (2016) discussed that demand uncertainty can be significantly reduced by using the Box–Jenkins forecasting method. Stochastic models (Fahimnia, Jabbarzadeh, Ghavamifar, & Bell, 2017; Dillon et al., 2017) and mathematical programming models (Zahiri & Pishvaee, 2017) can also be used to reduce demand uncertainty. On the other hand, the uncertainty about supply, specifically donor shortages, is difficult to overcome because blood cannot be manufactured at a time of need. Donor shortages can be caused by many things (such as changes in a donor’s medical status or medications, disease outbreaks, vacation seasons and, of course, a pandemic outbreak) and are among the potential risks that could impact the nation’s blood supply. Some of these challenges occur infrequently, but the problem of donor uncertainty continues to be significant worldwide and must be addressed.
As discussed in the Introduction section, and shown in Figure 1, this study incorporates two simulation designs and compares the results to discover which method works better to reduce the risk of blood shortages. The first design examines the organization’s strategic choice of partnerships and the second tests the idea of creating a national pooled blood inventory that would require blood centers to contribute 5% of their current blood inventory weekly to maintain memberships. The two simulation designs help us achieve our goal to examine whether a nationally coordinated effort is required to decrease the risk of blood shortages or whether the blood centers can rely on their own choices of a strategic partnership, as well as what factors can influence the outcomes if any.
3.1 Simulation 1: the strategic partnership to manage the risk of blood shortages
For the first approach, we test the choice of having a partner to decrease the risk of blood shortages. This is because we discovered that although the risk of donor shortages must drive blood centers’ alliances, it was the operational cost that was the actual motivating factor. While local partnerships can help reduce costs by sharing activities and blood testing, such alliances might not protect the blood centers from the risk associated with the availability of donors, without which the blood centers cannot survive. Thus, we first designed a simulation study to examine the differences between regional and national alliances in managing donor shortages. In addition, we also wished to see if the amount of variation in supply and mismatches in regional supply and demand would make a significant difference.
3.1.1 Simulation design 1
This model’s intended purpose is to observe the effects of donor shortages in a blood management system under different scenarios and conditions. To keep it simple, we divided the nation into four sections consistent with the four regions of the United States to investigate the differences between regional and national alliances to mitigate the risk of donor shortages. The regions are presented in Figure 4. We chose Region 1 to represent the South, 2 to represent the Midwest, 3 to represent the Northeast and 4 to represent the West part of the United States. As shown in Figure 4, the South and Midwest have a ratio of blood centers per million population above 2, while the Northeast and West ratios are below 2. This indicates that donor availability is not equal for all regions. Region 1 was set up as the region vulnerable to shortages with average weekly demand greater than the average weekly supply, while Region 3 was set up as the region with a surplus inventory of blood with average weekly demand smaller than the average weekly supply. The other two regions, for the sake of simplicity, were set to have matching average supply and demand, but they are still vulnerable to mismatches in supply and demand due to variability (Table 1).
Simulation details for step 1
| Regions | Based on a total of 12.6 M units annually * | Standard deviation of supply (4 variations) | A blood donor shortage imposed Three main scenarios: A, B and C |
|---|---|---|---|
| Region 1 | D1 = 30% (Dt) S1 = 25% (St) | 5% 7.5% 10% 12.5% | Scenario A: No shortage Scenario B: No shortage Scenario C: 50% of blood donors are eliminated for 4 weeks |
| Region 2 | D2 = 25% (Dt) S2 = 25% (St) | 5% 7.5% 10% 12.5% | Scenario A: No shortage Scenario B: No shortage Scenario C: No shortage |
| Region 3 | D3 = 20% (Dt) S3 = 25% (St) | 5% 7.5% 10% 12.5% | Scenario A: No shortage Scenario B: 50% of blood donors are eliminated for 4 weeks Scenario C: No shortage |
| Region 4 | D4 = 25% (Dt) S4 = 25% (St) | 5% 7.5% 10% 12.5% | Scenario A: No shortage Scenario B: No shortage Scenario C: No shortage |
Note(s): * Demand is normally distributed. The unit of annual demands is recorded from the American Red Cross (www.Redcross.Org) and BCA websites. Units of supply are assumed to match the annual demand. Total demand (Dt) = D1 + D2 + D3 + D4 and total supply (St) = S1 + S2 + S3 + S4
We ran three scenarios: Scenario A where there were no shortages (our baseline), Scenario B where we initiated a 50% shortage of blood in Region 3 for the duration of 4 weeks while keeping other regions’ blood supply untouched, and Scenario C where we initiated a 50% shortage of blood in Region 1 for the duration of 4 weeks while keeping other regions’ blood supply untouched. Scenarios B and C can be thought of as one region suddenly experiencing a donor problem (like New York at the beginning of the pandemic). We simulated one year (52 weeks), with shortages occurring in weeks 1, 2, 3 and 4. Based on prior empirical research (Fortsch & Khapalova, 2016) and the BCA website (which indicates the annual blood transfusion from the community blood centers is above 12.6 million units in the United States), we set the total national annual demand and supply to equal 12.6 million units each.
We assumed that demand is normally distributed and relatively stable as observed in (Fortsch & Khapalova, 2016), and thus set up the standard deviation of weekly demand to be 2% of the average weekly demand. On the other hand, we assumed that supply, reliant on human donors, is more variable, and normally distributed and wished to see if the amount of variation in supply would make a significant difference. Thus, for each of the three main scenarios (A, B and C) we consider four variations where the weekly supply standard deviation for each of the four regions is set to 5%, 7.5%, 10% and 12.5% of average weekly supply (see Table 1), for a total of scenarios. Thus, from 12.6 million total national annual demand and supply, we get 242,308 average weekly total demand and supply, which then is split region by region. For example, Region 1 would see weekly supply (25% of the total) set to 60,577 units per week on average, with weekly demand (30% of the total) set to 72,692 units per week on average. Standard deviations are set as a percentage of the weekly mean (Table 1).
To start the simulation process, we first determined the starting inventory for the main simulation set (this is our burn-in simulation). Each scenario ran for 52 consecutive weeks (i.e. 52 iterations) under normal conditions as it took roughly a year to stabilize and was repeated 10,000 times. For the burn-in simulation, the starting inventory position was set to zero, at which point the first week’s new supply came in, demand was met, or shortage was recorded, and any excess inventory was stored. This was repeated each week of the burn-in simulation. To meet demand, the system followed the first-in-fist-out (FIFO) strategy (using the oldest blood first, 3 week old, 2 week old, 1 week old and lastly, the new donations in that order); 4 week old blood was discarded and recorded as waste. At the end of the 52 weeks, the final inventory state was recorded and averaged out over the 10,000 simulation results. These averages (average inventories of 1 week old blood, 2 week old blood and 3 week old blood at the end of the 52 weeks) were then used as the starting point inventory position for the main set of simulation scenarios used in simulation 1.
Once this was done, all the 12 simulation scenarios from Table 1 were then run for 52 consecutive weeks (52 iterations) using the starting inventory positions, determined earlier and were repeated 50,000 times. The same FIFO strategy was used. For each scenario, weekly inventory states and shortage values were recorded and then averaged out over the 50,000 simulation results.
As per Sargent (2013), conceptual model validity relies on the underlying theories and assumptions to be correct and the model itself to be sufficient in its representation of the problem for the intended purpose. The intended purpose of the model is to observe the effects of donor shortages in a blood management system under different scenarios and conditions. We chose to have the simulation reflect some of the actual conditions observed in the US – based on the available information during the COVID-19 pandemic and prior empirical research (Fortsch & Khapalova, 2016). We used elements of the above to keep our model grounded in reality, but it was not meant to be an actual model of the US blood management system. We consider this conceptual model to be sufficient for its purpose. In addition, we did a burn-in step (described above), where we determined the starting inventory for the main simulation set by running the system under normal conditions for 52 weeks starting at zero. Thus, the main set of simulation scenarios starts at year 2 of operations which we consider a reasonable starting point. Since we wish to compare the results across all scenarios, the length of all simulation scenarios was set to 52 consecutive weeks (starting in year 2 of operations). In most of the scenarios we have a shock to the system at the beginning of the year (year 2 of operations) and we are looking to see the effects of that shock over that year when no significant changes to strategy and management are expected to occur. The resulting information can then be used for managerial decision-making –one year being a typical planning horizon. In addition, due to larger variability in supply and a mismatch in demand and supply in certain regions, the system would need to be adjusted by management regularly or it will get out of control and result in significant waste. Our simulation does not include managerial adjustment – we accept all donors that come in regardless of current inventory status. We also must keep in mind that blood is a perishable product. Thus, we believe 52 weeks is a good time horizon to study the effect of a supply shock. Consequently, we are not aiming to simulate until the system reaches equilibrium or gets out of control, it is strictly short-term (52 weeks). Due to variability in the system, we chose to repeat each simulation scenario 50,000 times and average the results. Going above 50,000 repetitions did not result in significant differences (given our goals) when we trialed several scenarios. Table 1 summarizes the design of our first experiment.
3.2 Simulation 2: coordinated effort nationally to create a pooled blood to manage blood shortages
It is common knowledge that a centralized inventory can help mitigate the ups and downs of demand and supply allowing the companies to operate successfully with lower safety stock. This is a popular method in supply chain management. For example, a third-party logistics company often holds the inventory of electronics for Walmart, Best Buy and others. This practice allows each company to decrease the safety inventory needed while operating with the same customer service levels. Therefore, with Simulation 2, we tested whether a coordinated effort nationally to create a pooled blood inventory can help manage the risk of donor shortages. To this end, we designed a simulation that allowed half of the nation’s blood centers to participate in this coordinated national effort by contributing 5% of their current blood inventory every week to the pool and then sending their “excess” customers (shortages) to the pool to meet their demand. The other half of the nation’s blood centers did not participate in this coordinated effort and were used for comparison. We introduced several shortage scenarios and examined the results.
We would like to note that while Simulation 1 was done early in the COVID-19 pandemic, Simulation 2 was done later and it considered some of the results from the first simulation. As a result, we increased the duration of the shortages to one year and introduced variation in demand and various safety stock amounts for supply.
3.2.1 Simulation design 2
The intended purpose of this simulation is to observe the effects of year-long donor shortages in a blood management system with a collaborative pooled inventory under different scenarios and conditions. We start with four regions to match the number of US regions. All regions had normally distributed demand with a weekly mean of 55,000 units and a standard deviation set to 5% and 20% of the weekly mean. The supply for each region followed the uniform distribution and included safety inventory. We choose two levels of available safety inventories (low: 5% of average weekly demand and high: 20% of average weekly demand) resulting in the following supply distributions Uniform (57750, 58750) and Uniform (66000, 67000). We considered the following six shortage scenarios: one where supply decreases by 10% in one region, two regions or three regions, and one where supply decreases by 30% in one region, two regions or three regions. We allowed half of the nation’s blood centers to become members of the national collaborative pooled inventory while the other half stayed independent.
We ran each scenario for 104 weeks to burn-in as it took roughly two years to stabilize, then we set shortages to occur in year three. Thus each simulation scenario ran for 156 consecutive weeks (i.e. 156 iterations; 104 weeks burn-in plus 52 weeks with a shortage) and was repeated 50,000 times; we only used the last year (52 weeks) for analysis. There were a total of 24 scenarios (2 demand variabilities × 2 supply safety stock options × 6 shortage scenarios) for the blood centers participating in the coordinated national effort. And the equivalent for the blood centers that did not participate.
As in the first simulation, the starting inventory position was set to zero when the first week’s new supply came in, demand was met (or shortage was recorded) and the excess inventory was stored. The addition to the coordinated national effort scenarios was that after each blood center collected that week’s blood, and they would send 5% of their total current blood inventory to the central pool before meeting their own demand. The 5% would be made up of the oldest blood first, then the next oldest, and so on (similar to FIFO). When meeting demand each of the blood centers would send their “excess” customers (shortage) to the central pool. This central pool was in essence acting as a 5th blood center whose supply came from weekly blood center donations and whose demand consisted of the “excess” customers (shortage) coming from four blood centers.
This scenario was repeated every week, for 156 weeks. To meet the demand, we allowed the inventory system to follow the FIFO strategy (using the oldest blood first, 3 week old, 2 week old, 1 week old and lastly, the new donations in that order). Due to the perishability of blood, the 4 week old blood was discarded and recorded as wastage. Same as the first simulation, we imposed the shortage of donors at the beginning of the year (year three in this case), where the effects were observed over the same year (the six shortage scenarios described above). Under normal conditions, the system would need to be adjusted by management regularly, typically on an annual basis. Our simulation does not include managerial adjustment – we accept all donors that come in regardless of current inventory status. Consequently, we are not aiming to run the shortage simulation until it reaches equilibrium or gets out of control, as it is strictly short-term (52 weeks of shortage). After 52 weeks we would expect management to adjust and that is beyond the scope of this simulation.
4. Simulation results
In agreement with conventional wisdom, the results of our first simulation (see Section 3.1: Simulation 1) indicated that the strategic choice of partnerships significantly impacts the availability of blood depending on the partner. As we anticipated, a national partnership resulted in three times fewer blood stockouts and shortage variability than local partnerships. This is because the donor availability was random and blood centers that reached out to the national partners were able to take advantage of the random variability of donor arrival across the nation. On the other hand, regional partners had the same supply distribution as that of the organization in question and it made them less able to help one another. The impact was significant as the regional partnerships resulted in three times higher blood shortages and more significant stockout variability. For example, the vulnerable blood centers (with the donor shortage) using a national partnership had a monthly blood shortage of 875 units, while the blood centers in the same region that had local partners had a monthly blood stockout of 12,114 units (given the initial values we used for the simulation).
What we did find interesting is that varying supply standard deviation and shortage locations (shortages being experienced in regions with average demand greater than supply vs. in regions with supply greater than demand) did not make a significant impact on our overall conclusion. Figure 5 shows the results of the shortages while Table 2 shows the stockout variability graphically regardless of demand standard deviation. Table 1 presents the various supply scenarios (with standard deviations of 5, 7.5, 10 and 12.5% of the mean) which were compared to discover the differences (if any) in blood shortages. In Table 2, the top figures represent the blood centers with national alliances while the bottom figures represent the blood centers with regional partnerships. We can see that not only do the national alliances help to decrease blood stockouts (Y-axis) but they also significantly reduce the shortage variability as compared to that of the regional partnerships. Table 2 shows that regardless of the standard deviation of supply (5, 7.5, 10 or 12.5% of the mean), the result is the same. The results, thus, indicate that national partnerships can protect against stockouts much better than regional partnerships or no partnerships at all unless there is a nationwide blood shortage.
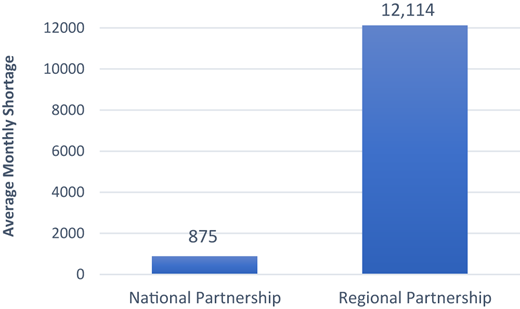
Simulation shorted 50% blood donations in one region for four consecutive weeks
Simulation shorted 50% blood donations in one region for four consecutive weeks

However, our visits demonstrated that even during the pandemic not all blood centers across the nation had donor problems at the same time, thus we can argue that a national partnership can be useful even in extreme situations.
The second simulation was designed to investigate whether having a national pool inventory as a result of blood centers’ 5% weekly contributions can help manage the risk of blood shortage. As discussed in detail in Section 3.2, two safety inventories (low and high) were tested along with two standard deviations of demand (5% and 20% of the mean). We, then, allowed half of the nation’s blood centers to participate in the national pooled inventory while the other half did not. For this simulation study, we did not allow blood centers to have national or regional alliances, hence the only protection they had was the pooled national inventory. The results revealed that regardless of the level of supply safety inventory and the demand variability, blood centers that participated in the coordinated effort significantly benefitted from their efforts. When a 10% or 30% supply shortage was imposed in one of the regions (like the first simulation), the blood centers that were members of the national pool recognized fewer blood stockouts, while the ones that were not members had larger stockouts. The results of both simulations are not surprising, though it is interesting that varying shortages, safety stock and demand standard deviation variations did not change the final conclusion. But can we determine which method can better protect against blood shortages? We will discuss the answer in the conclusion section.
Meanwhile, in Table 3, on the top left, the term “Total-np-5dstd-ss5p” is for the total of all blood centers not participating in the national pooled inventory, the standard deviation of demand is 5, and the safety stock is 5% of demand average. Similarly, on the top right, the term “Total-p-20dstd-ss5p” is for the total of all blood centers participating in the national pooled inventory, the standard deviation of demand is 20% of the mean, and the safety stock is 5% of demand average. We discover that while the participating blood centers had lower monthly stockouts, because the membership required the blood centers to continue their contributions during the imposed donor shortage, members recognized stockouts a few periods sooner than the nonmembers. For example, as Table 3 indicates, in the top left corner graph (safety stock is 5% of demand and the demand standard deviation is 5%) we see that the nonmembers have a higher average monthly blood stockout (580 units/week) compared to the blood centers that are members of the national blood pool (395 units/week). However, the members recognized that there is a blood shortage in the first period while the nonmembers save stockouts in the tenth period. The delay in realizing that there was a blood shortage (stockouts) was between 5 to 20 periods depending on the demand standard deviation and the level of safety stock. Table 3 demonstrates each of the scenarios. Nevertheless, after all blood centers recognized the shortages, the nonmembers showed nearly twice as many blood stockouts for a longer duration (Table 3). Note that the simulation numbers reflect the simulation setup (we tried to keep our model grounded in reality, but it was not meant to be an actual model of the US blood management system).

5. Conclusions
The motivation for this research was the COVID-19 pandemic outbreak that caused high shortages of products across the world. Such a problem with product unavailability suggested that product shortage is still a critical area of research. We designed two simulation studies to discover the superior method for protecting against national blood shortages and whether any variables could significantly influence the results for each model such as the demand and supply variability, safety inventory levels and the quantity of the shortages. We discovered some of the above variables impacted our conclusions. The most important finding was that the nation’s blood centers must have one or two national partners, but, although effective in reducing blood shortages, a coordinated effort nationally to create a pooled blood inventory does not appear to be necessary as it made the shortages to be realized quicker than no coordination.
We carried out our simulation by first allowing the blood centers to choose regional or national strategic partners, and second by creating a nationally coordinated pooled blood inventory which required blood centers to contribute 5% of their current inventory weekly to become a member. The results indicated that technically the nationally coordinated effort is slightly superior in protecting blood centers against the stockouts resulting in a slightly lower average weekly shortage (for example, 395 units compared to the organization’s choice of a strategic alliance of 825 units). The results indicated that, first, local partners cannot protect blood centers against donor shortages as well as national partners do. Second, while having a national pooled blood inventory decreases the average weekly shortages (which are desirable), the coordinated members recognize stockouts 5 to 20 periods earlier than the nonmembers (which is not desirable). This is, of course, due to the obligation to contribute to the national pool even during donor shortages. The only exception was when the company would have high levels of safety inventory and the demand is unpredictable for which both members and nonmembers of the national pool recognize the shortages simultaneously (Table 3, bottom right graph).
6. Limitations and acknowledgment
This study focuses on comparing the two methodologies discussed to mitigate blood shortages, however, we recognize that other methodologies such as coordination with hospitals and demand forecasting can be useful to decrease shortages. Hence, we encourage other researchers to study other methods that can impact the nation’s blood availability. In this study, we are limited to our simulation design, the selected demand variabilities, and the randomness of supply. As with all simulations, some of the results are based on the design of the experiment. However, we believe that due to visiting five of the nation’s blood centers and two hospitals, we designed our research experience to be grounded in reality in the best way we could.
Furthermore, the authors would like to thank the CTF for their generous donation in supporting this research and for inviting one of the authors to their productive Think-Tank meeting. We also would like to extend our gratitude to the representatives of the five blood centers and two hospitals that spent many hours answering our questions and helping us understand their operations. Finally, we thank the anonymous reviewers without whom we cannot communicate our findings.

