Most of the major Islamic countries’ stock exchanges have not been able to perform at the same pace with the major emerging countries’ stock exchanges since the mid of 1990s. The purpose of this paper is to examine the implications of stock market liberalization on cost of capital as one of the crucial driver to stock market development and physical investment growth in emerging Islamic countries.
This study employs static panel data techniques on the sample of seven emerging Islamic countries over the years 1989-2008.
The findings of this study suggest that stock market liberalization significantly reduces cost of capital in the stock markets of sample Islamic countries, which carries policy-oriented implications. Reduction in the cost of capital increases the number of exchange-traded companies, profitability of projects and aggregate investment level; therefore, the study findings are highly concerned by the economic policymakers, corporations and investors alike.
In the literature, different proxies are employed to measure stock market liberalization and cost of capital as well. Due to data limitations, this study could not employ different proxies for both, especially for stock market liberalization, for robustness purpose. That limitation further restricted the coverage of Islamic stock markets and time period. Therefore, generalization of the study results for overall Islamic stock markets can be slightly drawn.
The paper provides further understanding regarding the effects of SML on cost of capital, thereby indirectly on the stock market development, in the context of EIC.
1. Introduction
1.1 Context and background
Financial liberalization became an essential economic policy in order to transform the economic structure of developing countries into a state where both private sector and developed financial markets are the main drivers of the economic growth since the 1980s (Bekaert et al., 2005). Stock market liberalization (SML) is a country’s decision to provide foreign investors the opportunity to invest in the domestic equity securities and domestic investors the right to transact in the foreign equity securities, is a component of the financial liberalization and a specific element of the capital account liberalization as it removes restrictions on the capital inflows and outflows, i.e. repatriation of dividends, investment returns, etc. (Henry, 2000a). The proponents of SML have advocated that it has positive implications on the economic growth, i.e. an increase in the GDP growth and private investment growth (Henry, 2000a, b; Bekaert et al., 2003, 2005); stock market development, i.e. an increase in the market capitalization and liquidity (Fuchs-Schündeln and Funke, 2001; and cost of capital, i.e. an increase in the stock markets’ prices/returns, or a decrease in the dividend yields; and finally stock market volatility, i.e. a decrease in the stock market volatility (Bekaert and Harvey, 2000a, b; Henry, 2000a; Kim and Singal, 2000). On the other hand, it is heavily criticized in the literature that the very nature of pro-cyclical and irrational international financial capital, and incomplete capital markets with weak institutional and regulatory framework caused many crises in the emerging markets since 1980s (Singh, 1993; Krugman, 1998; Granger and Huang, 1999; Stiglitz, 1999; Prasad et al., 2003; Stiglitz et al., 2006; among others).
1.2 Motivation and research question
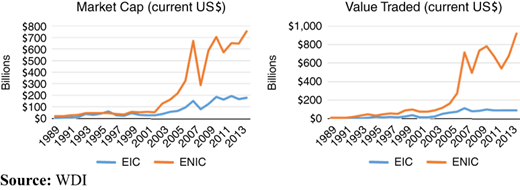
The divergence regarding the performance of stock market development among emerging markets has appeared since the mid of 1990s. More specifically, while some emerging non-Islamic countries (ENIC)[1] on average have positively diverged from emerging countries, most of the emerging Islamic countries (EIC)[2] have not been able to perform at the same pace with regard to stock market development. The charts in Figure 1 illustrate the trends of stock market size and stock value traded (average values in US$) of EIC and ENIC, which are selected literally based on data availability. These charts briefly indicate that the gap with regard to stock market development between EIC and ENIC has been increasing so far.
The academic studies, such as Dewandaru et al. (2014) and Rizvi et al. (2014), draw attentions to the literature which argues that even though the growing trend has occurred in the stock markets of emerging countries, those in Islamic countries, located in MENA and Asia, are still infantile. The stated common characteristics of these markets are small size, less liquidity, less efficiency, carrying higher risk premium, i.e. high cost of capital and volatility, and having poor quality of legal environment and governance. Even though the proponents of financial liberalization advocates that the fundamental problems that EIC have should be solved through the liberalization of domestic capital markets, the limited number of studies which partially covers the stock markets of EIC illustrate mixed results. For example, Achy (2005) examines the effect of domestic financial liberalization, i.e. the liberalization of interest rate, in the MENA countries (including Egypt, Jordan, Morocco, Tunisia and Turkey) over 1970–1998, and the results suggest that the private investment and economic growth are affected negatively. Also, Gentzoglanis (2007) claims that the relationship between the degree of financial openness and economic growth is weak, if not absent, in the MENA countries comparing to the developed countries over 1996–2002. Nevertheless, Naceur et al. (2007) find the results suggesting that while SML has a negative impact on the stock market development in the short run, it turns to be positive in the long run for 11 MENA countries over 1979–2005.
Therefore, considering the preceding inconclusive theoretical and empirical literature and shown divergence on the stock market development trends between EIC and ENIC, this study is motivated to ask the following research question:
Does SML decrease the cost of capital, as one of the vital factor for stock market development, in the stock markets of EIC?
Even though quite number of studies have been conducted with regard to the effect of SML on the stock market development, the empirical studies specifically focusing on EIC as the study sample is missing.
This study contributes to the current literature as follows: first, it provides further understanding regarding the effects of SML on cost of capital, thereby indirectly on the stock market development, in the context of EIC. This is obtained by estimating the relationship between SML variable and cost of capital indicator, i.e. dividend yield, in seven EIC over 1989–2008. Second, for robustness purpose, the variables, namely, crude oil price, interest and exchange rates are controlled in the same model. In addition, since the post-test results suggest that the estimates suffer from heteroscedasticity, we apply random effects (RE) estimators on the static models with “robust” standard errors option to mitigate the respective problem as suggested (White, 1980) in every regression model. At last, since the effects of SML are highly concerned by economic policymakers, corporate managers and investors, the study results carry policy-oriented implications. For instance, a change in the cost of capital affects the number of public listed companies which can access to cheaper funds. Furthermore, a change in the cost of capital has a direct implication on the firms’ ability of undertaking high-return projects, and in turn on the growth opportunities for companies. In addition, it has implications on the companies’ budgeting since the cost of finance is one of the main expenses in the budgeting. Finally, it affects the valuation of companies. In a nutshell, a change in the cost of capital has fundamental consequences on the capital accumulation, investment, stock market development and economic growth.
Overall, the empirical findings of the study suggest that SML is a highly significant explanatory variable in explaining the reduction on cost of capital, represented by dividend yield, in the stock markets of EIC.
The remainder of the paper is organized as follows. In Section 2, theoretical background and literature review and the proxy selection for SML will be provided. In Section 3, the description of sample data and variables, the explanation of methodology used in the empirical analysis and the illustration of SML proxy construction will be provided. Section 4 outlines the main results accompanied with policy implications and Section 5 concludes the study.
2. Theoretical background and literature review
Relying on capital asset pricing model (CAPM) and information asymmetry channel models, the proponents of liberalization claim that SML decreases the cost of capital via its implications on both domestic market risk premium and pricing of information asymmetry[3].
2.1 Capital asset pricing model (CAPM)
In a world where all local capital markets are completely segmented from each other, the local investors must bear all risks of the economic activities of that country. Country risk would be incorporated in the expected rate of return, i.e. price of security, which is termed as market risk premium by investors. Under the assumption that investors consider only expected return of their investment, the variance of that return, i.e. risk of the investment, will be measured by the variance of domestic market portfolio’s return, i.e. . Hence, as the return volatility of a country’s market portfolio increases, the risk premium of the market portfolio increases as well, as illustrated in the following third equation. As a result, based on the assumption that all investors have same risk aversion, i.e. βrisk aversion, the variance of return on domestic market portfolio determines the risk premium, as illustrated in the second equation:
When investors evaluate the risk of a risky security, they do not consider the risk of that security alone. Instead, they consider how this security contributes to the risk of their portfolio. The contribution of a risky security to the overall portfolio risk is the security’s β coefficient, i.e. βsecurity. The β coefficient of security is equal to the ratio of covariance of that security return with the market portfolio return divided by the variance of market portfolio return as illustrated in the following equation:
Therefore, the β of a portfolio is equal to the weighted average of βs within. A security that adds more to market portfolio risk has a higher β. Since that security is riskier, it should have a higher risk premium. With CAPM, expected return required by the market on a risky security is equal to the risk-free rate plus security risk premium which is equal to β coefficient of that security times domestic market’s risk premium as illustrated in the following equations:
Through SML, that country’s equity market becomes a part of the global equity market. The risk premium on the world market portfolio, i.e. World market risk premium, equals to the expected return of the world market portfolio, i.e. expected return world market, minus Risk-free rate, as illustrated in the following equation:
Applying CAPM for the global equity market, the risk premium on a risky asset now depends on its β coefficient with respect to the world market portfolio as illustrated in the following equations:
In case all countries open their capital markets, investors who consider only the expected return and the return variance of their portfolio tend to hold the global market portfolio to maximize diversification benefits (Bekaert and Harvey, 2000a). The reason is that the portfolio’s return variance drops with an increase in the number of countries invested in. Therefore, investors can hold portfolios with a higher expected return for the same variance or with the same expected return for a lower variance. As the segmented markets open, investors will hold internationally diversified portfolios and the risk of a risky security would be assessed according to what extent that risky security adds on the internationally diversified portfolio’s return variance. Therefore, due to the integration with world capital markets, SML decreases the domestic market risk premium under the following circumstances:
with the condition that the correlation between the volatility of domestic market portfolio and world market portfolio is positive and the latter does not exceed the former significantly, and
with the condition that the volatility of world market portfolio is lower than the volatility of domestic market portfolio, irrespective of the correlation coefficient sign.
The discount rate, i.e. cost of capital, for a security price is calculated using Equation (11). The security risk premium (βsecurity) depends on its covariance with a market risk premium, as shown in Equation (12). Hence, as SML reduces market risk premium, it will reduce the discount rate for that security as well. Therefore, SML will reduce the cost of capital and increase the price for that security based on the formula exhibited as follows:
P0 represents the asset price today (t=0), It represents cash flow at time t, rt represents discount rate at time t:
2.2 Information asymmetry channel models
There are three models suggesting that a reduction in the pricing of information asymmetry decreases the cost of capital due to various reasons, which are competition channel model (CCM), agency channel model (ACM) and financing constraint channel model (FCC).
Albeit it is suggested that the degree of information asymmetry has no separate effect on the cost of capital in the economies with perfect competition (Lambert et al., 2012), imperfect competition and asymmetric information are the common features of market microstructure models[4]. These models suggest that when the number of investors is finite in an economy, each investor pushes the price upward or downward when he or she performs buying or selling transactions. Therefore, there exists an upwardly sloping price curve in demand, which reduces the investors’ willingness to trade, and in turn increases the cost of capital. In addition, the existence of information asymmetry causes adverse selection that further increases the upward slope in the price curve because when an individual investor trades a firm’s shares, other investors will presume that the respective investor has superior power, thereby leading to an additional upward slope in the price curve.
The CCM suggests that SML leads to a higher reduction in the pricing of information asymmetry with the condition that the number of uninformed investors is more than the number of informed investors in the imperfectly competitive economies where the financial markets regulated and supervised by opaque and poor-quality institutions. The model suggests that while an increase in the number of uninformed investors increases risk-bearing capacity via greater sharing of the adverse-selection risk, thereby reducing the pricing of information asymmetry; an increase in the number of informed investors increases the adverse-selection risk, hence causing an increase in the pricing of information asymmetry. Bae et al. (2008) suggest that local analysts have a greater information advantage over foreign analysts in the countries with greater opacity. This could be justified based on the argument that new foreign investors rely primarily on arms-length hard information. Hence, they are more likely to be uninformed relative to the domestic investors in the countries with opaque and poor-quality institutions.
Contrary to the expectation of the CCM, the ACM argues that the decrease in the pricing of information asymmetry should be greater in the countries with high-quality institutions (Balakrishnan et al., 2019). The model elaborates the underlying rationale in a way that the informed foreign investors can rely on arms-length information of a domestic market only in the case the respective country has high quality and transparent institutions. Otherwise, it would not be possible for foreign investors to monitor firms effectively.
Furthermore, as demonstrated by Myers and Majluf (1984) and Stiglitz and Weiss (1981), the cost of external fund is higher than that of the internal fund because of the existing information asymmetry between borrowers and lenders. The wedge between the cost of internal and external fund causes firms to face constraints in the financial markets. Love (2003) argues that while financing constraints can increase firms’ cost of capital, SML reduces it. The reason to that is financing constraints distort the inter-temporal substitution between investment today and investment tomorrow, hence forcing firms to postpone investment to future periods. Nevertheless, SML brings external financing sources to the domestic market, providing options to investors to materialize investment without further delay. According to the FCCM, SML may reduce the pricing of information asymmetry by reducing firms’ financing constraints since it increases the capital availability in the domestic markets.
2.3 Critiques toward mainstream stance
Nevertheless, the criticism against financial liberalization draws attentions to the point that the inefficient allocation of capital due to the speculative international capital flows may lead to distortions in the cost of capital. Economists, such as Bhagwati (1998), Rodrik (1998) and Stiglitz (1999, 2002) among others, argue that SML may generate speculative capital flows, which are not related to the fundamentals of companies or capital markets toward which they flow. The principal reason behind this argument is that investors make decisions based on animal spirits, hence blindly follow the crowd rather than acting rationally, especially in the periods of massive capital flows. Financing economic growth via such portfolio investments renders economies sensitive to sudden inflows and outflows. These sudden and irrational capital flows cause destructions in the capital markets, and force countries to make dramatic macroeconomic adjustments, e.g. a sharp increase in the interest rate or devaluation of local currencies. Consequently, SML may destabilize the overall economy. Therefore, SML does not always lower the cost of capital and facilitate capital flow to the firms and countries which have the best investment opportunities, i.e. inefficient allocation of resource. This means the financial liberalization promotes neither investment nor economic growth.
2.4 Proxy for stock market liberalization
It is generally accepted that SML is not a one-shot event, but a process; and not identical for all emerging countries. This is because they exhibit differences in the level of macroeconomic variables, development of financial infrastructure, and in prioritization the steps in liberalizing domestic capital markets. The oldest approach in measuring SML is to treat it as a one-shot event, which assumes that the domestic capital markets were completely segmented before and became perfectly liberalized after the official liberalization announcement date[5], [6]. Nevertheless, measuring SML based on this method could be problematic due to several reasons. First, the foreign investors might have had the ability to access the domestic capital markets through other means such as country funds and depository receipts[7]. Therefore, the domestic capital markets might have been integrated to a certain extent earlier. Second, foreign investors may not believe that the official reformation of liberalization would be long lasting, or the presence of market imperfections may stop foreign investors to tap into the domestic capital markets. Consequently, the official reformation of liberalization might have minor or even no effect on the domestic stock markets. Third, according to Bekaert and Harvey (1995) and Stulz (2005), the reformation of liberalization is often implemented gradually over time, and the speed of the process is determined by peculiar situations in each individual country. Fourth, several emerging countries have undergone liberalization reversals particularly following currency crises that they experienced. Hence, later, it was suggested to consider the different intensities and time variations in the level of SML. As a result, it is suggested to employ a proxy which is considering the different intensities and time variations in the level of SML.
First proposed by Edison and Warnock (2001), then became widely preferred in measuring SML, the preferred proxy by this study is calculated based on the two indices which are computed by Standard and Poor’s/International Finance Corporation (SP/IFC). These are a global index (IFCG), which is designed to represent the market value of the domestic exchange; and an investable index (IFCI), which is designed to represent the subset of the market value of the domestic exchange available to the foreign investors. This measure is calculated by the market capitalization of the IFCI over that of the IFCG. Hence it provides a Continuous ratio which varies from 0 to 1. While 0 represents a totally segmented, 1 represents a totally liberalized capital market. Therefore, this calculation provides different intensities and time variations in the level of market liberalization. In addition, Huang (2006, 2008) incorporates the ratio which is calculated by the number of equities of the IFCI over that of the IFCG, into the ratio proposed by Edison and Warnock (2001) by using principal component analysis method (PCA).
2.5 Determinants of cost of capital
Following Auzairy et al. (2011), we incorporate three control variables which are exchange rate, interest rate and oil price in the model of cost of capital.
2.5.1 Exchange rate
On the international side, the advent of flexible exchange rate system and growing internationalization of domestic economies have introduced the exchange rate as a potential determinant of stock returns. This is because the emerging countries undergo significant changes with regard to the foreign exchange restrictions, e.g. adoption of more flexible exchange rate arrangements. Hence, volatility of exchange rates has created a substantial risk in the investment decision and portfolio diversification[8]. For example, Nieh and Lee (2001) argue that expectations regarding the value of currency affect domestic and foreign interest rates. These changes, in return, affect the present value of a firm’s assets, especially for internationally held financial assets, in an open economy.
There are two main theories explaining the interaction between foreign exchange markets and stock markets, which are the flow-approach models[9] and the stock-approach models[10]. The flow-approach models propose that exchange rate is mainly determined by trade flows. Changes in the exchange rates are affected by trade balance, and there will be reflections of real macroeconomic variables, such as real income and output. According to the present value theory, the stock price is equal to the present value of future cash flows of firms. Therefore, stock prices should effectively reflect the economic outlook. In other words, variations in exchange rates ultimately affect the value of a firm’s equity. Domestic currency depreciation renders local firms more competitive, which, in turn, raises their stock prices. Consequently, the flow-approach model suggests a positive relationship between exchange rate depreciation and the stock prices. The stock-approach models, on the other hand, assume that exchange rate is determined by demand and supply of the financial assets, e.g. equities and bonds. According to these models, individuals hold domestic and foreign assets, including currencies, in their portfolios. Exchange rates play a role in balancing demand and supply of assets. An increase in the domestic stock prices leads individuals to demand more domestic assets. Local investors sell foreign assets to buy more domestic assets, which causes the local currency to appreciate. Consequently, the relationship between stock price and the exchange rate is negative.
2.5.2 Interest rate
The interest rate is used to represent the risk in the mature stock markets. Unanticipated changes in the riskless interest rate, i.e. risk-free rate, will influence the pricing and returns via their influence on the time value of future cash flows. Since returns and costs of companies are highly dependent on interest rates, it is important for the valuation of common stocks. The relationship is assumed to be generally unidirectional, which is from interest rate to stock returns. In theory, interest rate and stock price have a negative correlation. This is because a rise in interest rate reduces the net present value of future cash flows, which, in turn, should depress the stock prices. In contrast, a reduction in the interest rates provides cheaper cost of borrowing, which would increase prices. This stimulates investments and economic activities. Therefore, investment theory suggests that the lower the interest rate, i.e. the cost of capital, the higher the investment returns. However, if an increase in the interest rate is followed by an increase in the money supply which is backed by foreign reserves, the domestic investment and consumption would increase, hence it generates better stock market return performance.
2.5.3 Crude oil price
The financial markets are one of the channels through which higher oil prices may affect the global economy. While most researches have focused on the mechanisms of oil price shocks on either products or labor markets, re-allocative effects of it on the capital markets did not attract many so far. The existent literature is limited mainly to a few industrialized countries, e.g. Huang et al. (2005), Jones and Kaul (1996), Lee (1992) and Sadorsky (1999). As Jones et al. (2004) suggest that since stock values reflect markets’ best estimate for future profitability of firms, the effect of oil price shocks on the stock markets is important. In theory, an increase in the oil price is expected to depress an oil-importing economy, as it increases trade deficit of the subject country. Meanwhile, changes in the oil price level can affect the cash flows to emerging countries by changing the investment strategies of oil-exporting countries. The oil-exporting countries may raise the amount of investment in the emerging countries, depending on the increase in the oil prices. However, if the higher oil price is believed to be temporary, savings from the oil revenues is expected to create a cushion to protect the oil-exporting country against future economic shocks. Hence, no additional amount would be directed as an investment to the emerging countries. Consequently, there is no complete consensus in the theoretical debate regarding the effect of oil prices on stock market valuations.
3. Sample, variables and model specification
3.1 Sample and variables
The study sample covers seven EIC[11]. The data are on monthly basis and spanning from 1989 to 2008. The data employed here are not available for a uniform period and are unbalanced.
The literature varies in measuring the cost of capital. There are three different methods in the calculation of the cost of capital. As the first and oldest approach, future returns could be forecasted by using past returns. However, this approach does not seem appropriate for the markets that have already undergone SML. This is because past returns are appropriate for segmented markets. Yet, these markets no longer exist following SML. Past average returns for those markets are high mainly due to two reasons. First, since segmented markets are highly volatile, domestic investors can hold only volatile domestic equities. Therefore, these markets carry a higher risk premium. Second, SML is expected to increase equity valuations as the cost of capital falls. Therefore, measuring average returns which most probably increases after SML may yield paradoxical results. This is because expected cash flows of equity will be discounted at a lower rate. Furthermore, since the liberalization process is gradual, other factors could be confounded in the measurement of the cost of capital. In such kind of environment, it is difficult to use average returns to measure changes in the cost of capital.
Korajczyk (1996) asserted that a change in the cost of capital should have a discrete effect on the price level of stock. Therefore, it is likely that a technique exploiting information in price levels may be more powerful. Bekaert and Harvey (1997), first, proposed the use of dividend yield to investigate the impact of SML on the cost of capital. The authors argue that the ratio of dividend to share price is a good proxy for the cost of capital for several reasons. First, shocks to prices most probably dominate its variation over time. Therefore, the cost of capital which is measured based on excessive return might be misleading. Second, the dividend yield is linked to the cost of capital in asset pricing models, e.g. Gordon growth model (GGM). Third, the dividend yield is directly measurable, that is, it need not be pre-estimated. To understand this approach, suppose GGM holds, so that value of a firm is:
where d1 is the dividend payment at the end of the period, r the cost of capital and π the growth rate of dividends. The dividend yield is the ratio of the dividend to the equity capitalization. Consequently, if the GGM holds, the dividend yield is d/[d/(r–π)], or (r–π). If GGM holds and expected rate of dividend growth is constant as SML takes place, then the change in dividend yield following SML corresponds exactly to the change in cost of capital.
Third method utilizes CAPM to estimate the change in the cost of capital. The measure of systematic risk of a security for a well-diversified portfolio is the degree to which it moves with the world market portfolio. According to this model, the cost of capital is equal to risk-free interest rate plus the systematic risk of the security times risk premium of the world market portfolio. Though CAPM fits well when a study examines country portfolios, it is less proper when a study focuses on pricing portfolios of stocks within countries as well as across countries. This means that anomalies that are inconsistent with CAPM within one country, such as size effect and book-to-market effect are present across countries. For instance, Korajczyk and Viallet (1989) show that a world CAPM understates expected returns of small firms across countries and tends to overstate required return from large firms. Therefore, since our data are cross-sectional, it does not seem that it is proper to follow this method to measure costs of capital.
We thus use dividend yield to measure the cost of capital. In fact, IFC provides monthly dividend yield for each IFCG price index which belongs to each stock market of sample countries. Even though there are other dividend yield indices provided by other sources, there are limitations which force us to prefer the IFCG dividend yield index. Due to SML proxy we employ in this study, we can cover seven EIC, from January 1989 to October 2008. Considering the limitations regarding the countries and time range, IFCG dividend yield indices are the only available source which covers these EIC and the time range with sufficient and consistent data. Therefore, we are forced to rely on IFCG dividend yield index of the stock markets to measure the cost of capital.
Following the study held by Auzairy et al. (2011), the control variables of interest rate, foreign exchange rate and spot crude oil price are being incorporated into the model. Table I provides the list of variables with definitions, references and sources.
3.2 Construction of SML proxy
The procedure for the construction of sml proxy is as follows:
S&P/IFCG=represents the total domestic market, S&P/IFCI=represents the domestic market which is legally available to foreign investors, MC=market capitalization at the time of the considered two indices for each emerging market, NE=number of equities at the time of the considered two indices for each market.
PCA is undertaken in the cases a sufficient correlation among the original variables exists to warrant the component representation. Values approximately above 0.5 are considered satisfactory for PCA to be employed. Table II shows that correlation between market capitalization ratio and a number of equities ratio is 0.52, which satisfies the condition to employ the PCA.
The information on the two groups of ratios is summarized as two different numbers of principal components that are mutually independent. Formally, this is defined by a vector of weights α=(α1, α2, …, αN) on the indicators X=(X1, X2, …, XN) such that αX has the maximum variance for any possible combination of weights, subject to the constraints that αα=1. The Kaiser’s rule recommends retaining only components with eigenvalues exceeding unity, i.e. more than 1. Table III illustrates the eigenvalues of the first component, i.e. 1.52, and a second component, i.e. 0.478, respectively. Therefore, we pick the first principal component of two individual indicators as SML indicator. In order to score the first principal component, all individual measures need to be available which is provided in the data employed. When performing PCA for only two variables, the first principal component is the average of the two variables after being standardized.
Besides, eigenvectors of the first principal component are also reported in Table IV, which are the weights on individual standardized measures when scoring the first principal component. The sign and magnitude of eigenvector which is positive and close to 1, i.e. 0.7071, further convince us of the existence of strong positive relationships between ratios. The table shows that first component is able to explain 70.71 percent of the variation in both ratios.
3.3 Empirical model specification
Following previous empirical studies of Hail and Leuz (2003) and Huang (2008), static panel data estimators are employed to capture both i cross-section and t time series variations/dimension of the data to examine the effect of SML on the cost of capital. The general form of the regression models employed in this study is as follows:
where Xit is the vector of control variables, α is the constant term, µit the individual error term and ɛit reflect the error component disturbances. After replacing the vector Xit with control variables, the static regression model becomes as follows:
where coc is the cost of capital country i in year t, with country-specific determinants such as sml, interest (3-month interest rate), forex (foreign exchange rate) and oil (crude oil price). The µit denotes the time-invariant unobservable country-specific fixed effects (FE). The disturbance term which is denoted as ɛit is assumed to be mean equal to 0, uncorrelated with itself, uncorrelated with other control variables, uncorrelated with time-invariant unobservable country-specific FE and homoscedastic, i.e. ɛi ≈ i.i.d.N(0, σ2).
We use panel data estimation which combines time series and cross-sectional information. In general, it is assumed that panel data estimators are asymptotically normal. Nevertheless, since the sample size is quite small, the standard errors will be overly optimistic, which causes to overconfidence in the results (Beck and Katz, 1995). As a result, countermeasures for the existence of heteroscedasticity (i.e. errors differ systematically across countries) and autocorrelation (i.e. errors are correlated over time within countries) have also been utilized[12]. The model above have a static nature and we utilized common static panel techniques, such OLS, FE and RE to test the hypothesis formulated above. However, the problem of choosing between the static estimators remains. With the help of post-estimation tests such as Breusch and Pagan Langrange Multiplier to detect the presence of an unobserved effect and Hausman to help choice between RE and FE, the use of efficient and consistent estimators can be assured.
4. Results and discussion
4.1 Descriptive statistics
The descriptive statistics and the pairwise correlations of the dependent and independent variables appear in Table V. At first glance, SML variable has the average value of 0.76 indicating that stock markets in EIC still has a way to reach a fully liberalized market state (1.00 represents fully liberalized stock markets). Also, as the focus variable of the study, sml variable has a negative correlation coefficient with dividend yield (−0.007), suggesting that there is a negative relationship between SML and cost of capital. Furthermore, dividend yield has negative correlations with all explanatory variables; this indicates that an increase in the rate of interest, foreign exchange rate and crude oil price may reduce the cost of capital in the stock markets of EIC. One of the main reasons behind these negative relationships could be the fact that the average economic development level of EIC was low to medium specifically during the study time period. This level of economies is always in dire need of production factors such as fund and energy, which contributes to the acceleration of economic growth. To this end, an increase in interest rate could signal growth in investment and an increase in the value of local currency could signal foreign investors’ demand for local currency. Therefore, the negative correlations stated above could signal an increase in the availability of fund and foreign direct/portfolio investment, factors contributing to investment and economic growth.
4.2 Results of the models
The following sub-section exhibits the empirical findings and all regression results corresponding to the regression Model (15). We examine the effect of SML on dividend yield.
As suggested by the post-estimation tests results, the RE estimator is employed to estimate the Model (15). The regression results for each year over the period 1990–2008 are reported in Table VI, where the sml variable is accompanied with the control variables. The results exhibit that SML is significant with negative coefficient at 1 percent during the early 1990s, yet it loses its significance in the late 1990s. However, the significant negative coefficients of sml variable at very high level, i.e. 1 percent, were hold during the 2000s. These results suggest that SML became a significant factor which consistently reduced the cost of capital in the stock markets of EIC during 2000s compared to 1990s.
4.3 Elaborations on the significance of SML in the stock markets of emerging Islamic countries
SML is believed to play a catalyzer role in introducing, adapting and developing the necessary rules and regulations, standards, institutions and overall financial infrastructure in the domestic financial markets. Simply opening the conduits to foreign investors to invest in the domestic markets without providing relatively sound, stable, transparent, up to date and competitive market conditions would not attract steady international capital inflow, which was on average the case in the early stages of liberalization in EIC as suggested by the relevant literature[13]. Supporting these studies, OECD (2005) elaborates on the fact that many countries in the MENA even did not have institutions which are in charge of capital market supervision. Moreover, incompetency in enforcing prudential rules and adequate supervision, limited availability of data and lack of transparency were the reasons attributed to Malaysia and Indonesia as the ones hardly hit by 1997–1998 East Asia financial crisis (IMF, 1998) (available at: www.imf.org/external/pubs/ft/fandd/1998/12/mathies.htm). Even though EIC had been liberalizing their domestic stock markets gradually, these reports provide evidence suggesting that they were facing fatal deficiencies in the financial infrastructure, i.e. institutional and regulatory framework.
On the other hand, it is generally argued that financial liberalization can help to improve financial infrastructure (Beck and Demirguc-Kunt, 2009). Integration with international markets forces domestic financial markets to transform the financial infrastructure by taking actions such as adaptation of international accounting standards, amending and improving security law, strengthening the protection for small and foreign investors, improving legal framework to govern financial institutions and establishing and strengthening the role of regulatory and supervisory institutions. OECD report (2005) continues stating that the institutions which oversee capital market supervision have been established and efforts have been exerted to enact and enforce necessary laws and regulations during the late 1990s and early 2000s. These improvements in the domestic capital markets are expected to bring closer monitoring, which, in turn, increases transparency and reliability. Closer monitoring, higher transparency and reliability are expected to increase the confidence level and risk appetite of international investors, i.e. attracting foreign capital inflow, toward domestic markets of EIC. These developments, in turn, are expected to increase information efficiency, decrease cost of capital, increase market size and liquidity. In this regard, conducting a comparative empirical study regarding the stock market efficiency between EIC and developed countries Rizvi et al. (2014) find that Turkey, Jordan, Egypt, Pakistan and Malaysia are ranked as high efficient stock markets among both EIC and developed countries during 2001–2011. Besides, Malaysia, Indonesia and Turkey are constantly ranked highly efficient, which is in line with the fact that these countries have relatively more stable pattern of integration level among EIC.
In the economies where the domestic savings are literally low and current account deficit carries a potential risk factor, which is the case in most of the EIC, except Malaysia, an increase in the availability of international capital decreases the cost of fund to be invested. Therefore, by examining the issue on annual basis, we expected to see the positive implications of these efforts, e.g. liberalization and enhancement of financial infrastructure, in the reduction of cost of capital around that time frame. Indeed, the results suggest that SML reduces the cost of capital significantly in EIC starting around 2000 onwards.
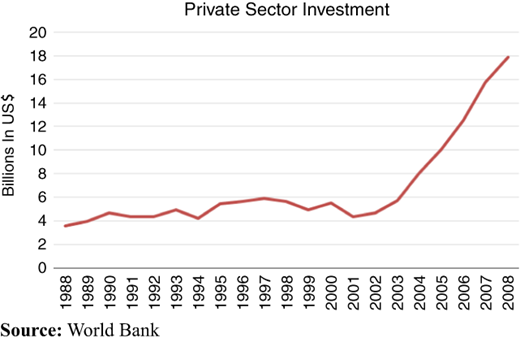
A reduction in the cost of capital makes the projects profitable which were not before, and thus increases aggregate investment rate, i.e. capital accumulation, and economic growth. Accordingly, the progress occurred in the capital markets is expected to increase the private investment, which, in turn, contributes to economic growth. In line with this expectation, private investment had a steady increasing momentum during the 1990s and boosted afterwards in EIC. Since the cost of capital is essential in investment decision, the trend seen in the performance of private investment is in line with the results stated earlier which suggest that SML reduces the cost of capital significantly in EIC starting around 2000 onwards (Figure 2).
In this regard, for example, public sector borrowings from the capital market have been declining since 1990, because of the strategy to downsize the operations of the public sector and the increasing emphasis on the role of private sector in the economy of Malaysia. Privatization policy generally goes hand in hand with liberalization policy. Accordingly, the capital markets expand to meet this demand. Privatization in the late 1980s and 1990s resulted in increased financing needs among private sector firms in Malaysia. Also, according to the report of Capital Markets Board of Turkey (2006), the contribution of the capital market in the development of the private sector has reached to the highest positive level in the mid of 2000 in Turkey. The report further states that investment funds in Turkey grew rapidly in the same period. In 2005, for instance, the extent of the investment funds had increased from $18bn to $23bn. In addition, the yields obtained from stock exchange instruments, i.e. 47.9 percent in a real basis, have been high in comparison to other investment alternatives in 2005. Similarly, according to the report prepared by Reserve Bank of Australia (2011), growth performance of industrial investment was rapid during 1990s in Indonesia. This is because a range of economic reforms including devaluation of local currency and liberalization of the financial sector helped foreign investment to flow into Indonesia during 1990s. Even though, investment fell to 11 percent of nominal GDP in the wake of the 1997–1998 East Asia financial crisis, it has expanded by around 7 percent annually and its share of nominal GDP has moved back up 32 percent. Though government spending and state-owned enterprises still play a significant role in Indonesian economy, around 80 percent of the economy has been controlled by private Indonesians and foreign companies since 1980s (http://surabaya.tribunnews.com/2015/03/03/80-persen-industri-indonesia-disebut-dikuasai-swasta). Moreover, as stated by the study of Wild and Lebdaoui (2014), the International Monetary Fund suggests that economic growth over the period 1980–2010 has been mainly driven by capital accumulation on the supply side in Morocco, which underlines the importance of the stock market as the primary source for capital accumulation for economic growth. Also, the study held by Saadi-Sedik and Petri (2006) suggests that Jordanian stock market significantly contributed to economic growth during the 2000s through channeling and intermediating capital, which is mainly sourced from foreign funds. This is because the Jordanian authorities had exerted long-standing efforts to boost domestic stock market. Jordanian Department of Statistics (2013) provides the data showing that the contribution ratio of the private sector in capital formation reached to 56.4 percent in 2000 and increased to 86.4 percent in 2012. In general, Jordan has witnessed an expansion in the gross domestic product, stock market liquidity, private investment and credit to private sector accompanied with a high degree of domestic market openness. Furthermore, according to the report of the African Development Bank (2009), the liberalized and stabilized foreign exchange regime, the privatization of public corporations, bank and insurance companies, the open policy toward private investments in the infrastructure, among others, are the important factors which contributed to private sector investment in Egypt. Many private sector companies have been able to obtain financing for their expansion through the Egypt capital market and this to some extent resulted in privatizations. While the figure for private investment was around 47 percent of total investments in 2003–2004, it reached to 65 percent in 2007–2008. The report further states that in addition to foreign multinationals, there are a number of large and efficient Egyptian firms in all sectors of the economy registered on the exchange.
In addition, we believe that the CCM is a better fit to explain the results, which suggests that SML significantly decreases the cost of capital in EIC. Dewandaru et al. (2014) argue that poor quality of information flow, high trading costs, disintermediation and less competition due to international investment barriers could be the main reasons which render the stock markets in Islamic countries to perform poorly in comparison to the developed countries. These diagnostics suggest that the capital markets of EIC are opaque. According to the CCM, SML reduces the cost of capital if it raises competition level by increasing the number of uninformed investors more than the number of informed investors in the opaque domestic capital markets. This is because higher participation of uninformed foreign investors would decrease the adverse-selection risk in the capital markets where imperfect competition is widespread and the supervisory and regulatory institutions are not able to fulfill their duties well.
The studies that examine the effect of SML on the cost of capital generally find significant small impact, as this paper results suggest. The reasons could be as follows: first, the anticipation of SML may lead to the realization of benefits before. Second, finding a big reduction in the cost of capital due to SML is only possible for a short term such as immediately before, during or immediately after SML. This is because as time passes, the arbitrage occurred in price would minimize. Third, some studies show that even though returns on national equity portfolios suggest substantial benefits from international diversification perspective, yet individuals and institutions in most countries hold modest amounts of foreign equity, i.e. there is a home bias, e.g. French and Poterba (1991), Cooper and Kaplanis (1994), Tesar and Werner (1995) and Ahearne et al. (2004). Fourth, many capital markets in the emerging countries are dominated by public firms that are inefficient and where the corporate governance is weak. As SML increases the availability of financial resources, reduces the cost of borrowing and provides diversification benefit for all firms, directed lending to these public firms decreases. Therefore, the cost of capital would be higher than that these public firms used to pay. Consequently, due to their size, an increase in the cost of capital that these public firms bear would affect the average cost of capital in the market negatively.
5. Conclusion
This study aims at analyzing the possible effects of SML on cost of capital, as one of the crucial economic policy for stock market development and economic growth, in the stock markets of EIC. We applied RE estimator on our static regression model with dividend yield provided by Standard and Poor’s IFCG index for each emerging market, as the dependent variable to represent cost of capital with three control variables which are exchange rate, interest rate and crude oil price, respectively. First proposed by Edison and Warnock (2001), then became widely preferred in measuring SML, the preferred proxy by this study is calculated based on the two indices which are computed by SP/IFC. The results of the regression models suggest that SML significantly reduces cost of capital in the stock markets of EIC. This finding is consistent with the literature including Bekaert and Harvey (2000a), Henry (2000a), Kim and Singal (2000), Huang (2008) and Hillier and Loncan (2019). Furthermore, the literature generally defines the stock markets of EIC as such; poor-quality of information flow, high trading costs, disintermediation and less competition. Therefore, we strongly suggest that the CCM is a better fit to explain the results, suggesting that SML reduces the cost of capital as it raises competition level by increasing the number of uninformed investors more than the number of informed investors in the opaque domestic capital markets. Due to the following reasons, the implication of SML on cost of capital is highly concerned by the economic policymakers, corporations and investors. First, a reduction in the cost of capital would highly likely attract more companies to be a part of exchange in order to benefit from low-cost fund raising opportunities, leading to bigger market size. Second, it renders the projects profitable which were not before, and thus increases aggregate investment rate. These developments certainly affect the decision-making behavior of the stakeholders in the worlds of both finance and economy. Finally, we consider that our analysis could be expanded by further scoping down from country level to industry level. Thus, the similarities and differences among industries with regard to the effect of SML would be analyzed. Furthermore, by narrowing down the scope from industry to company level, the effect of SML can be examined on the Shariah-compliant companies.
Notes
This group consists of 17 countries. To see the constituents of ENIC, please refer to Table AI.
This group consists of seven countries. To see the constituents of EIC, please refer to Table AI.
A firm’s cost of capital significantly depends on its cost of debt. The cost of debt, too, significantly depends on how a firm is taxed. We avoid dealing with taxation issues.
See, for example, Kyle (1989) and Glosten and Milgrom (1985).
The official liberalization announcement date refers to the time of formal policy change after which foreign investors officially have the opportunity to invest in the domestic capital markets.
The timing of the empirical studies, which held this approach, was around the late 1990s and early 2000s. Therefore, by employing dummy variable as the proxy for SML, they examined the effect of SML before, during and after the official liberalization announcement date.
A country fund is an investment company that invests in a portfolio of assets in the stock markets of emerging countries and issues shares domestically. Each fund provides two distinct market-determined prices: the country-fund’s share price on the foreign and domestic market. Besides, an American Depository Receipt (ADR) issued by a US bank, grants the right to foreign shares that trade on a US Exchange or over the counter. ADR’s overcome many indirect investment restrictions associated with investing in foreign securities. Trading on the US exchange overcomes information barriers and transaction costs associated with trading in in the stock markets of emerging countries, even though foreign firms must meet US market listing requirements (see Bekaert and Harvey, 1997).
Here, exchange rate is defined as the price of one unit of foreign currency in local terms. Thus, currency depreciation means increase in exchange rate.
Mainly represented by Dornbusch and Fisher (1980).
Mainly represented by Branson (1983) and Frankel (1983).
To see the list of countries with the time coverage, please refer to Table AI.
In order to take heteroskedasticity into account, the option “robust” (Stata command vce (cluster code)) has been added in every regression to which was applicable. With the robust option, the White (1980) heteroskedasticity robust standard errors, that are asymptotically valid in the presence of any kind heteroskedasticity, are used.
For results and explanations of the limited literature, please refer to Motivation and Research Question section under Introduction.