This study examines the dynamic connectedness and volatility spillovers between Indian Environmental, Social and Governance (ESG) indices, clean energy indices, sectoral indices and broad-based market benchmarks. It seeks to understand how systemic shocks transmit across these assets during normal and crisis periods, with implications for portfolio management and sustainable finance in emerging markets.
The analysis employs the Time-Varying Parameter Vector Autoregressive (TVP-VAR) extended joint connectedness (EJC) framework to capture directional spillovers, complemented by the Dynamic Conditional Correlation–Generalized AutoRegressive Conditional Heteroskedasticity (DCC-GARCH) model for bilateral hedge ratios. Robustness is assessed through Quantile VAR (QVAR) using the Hannan–Quinn criterion. Finally, portfolio allocation strategies are evaluated using the Minimum Connectedness Portfolio (MCoP), benchmarked against the Minimum Variance Portfolio (MVP) and Minimum Correlation Portfolio (MCP).
Results indicate that ESG 100, BSE ESG, CARBONEX and GREENEX act as consistent net transmitters of volatility, while sectoral indices such as FMCG, DIGITAL and REALTY serve as diversifiers with low connectedness. Spillover intensity rises markedly during the COVID-19 pandemic and the Russia–Ukraine conflict, underscoring the vulnerability of ESG-linked assets to crises. MCoP consistently outperforms MVP and MCP in minimizing systemic risk. Robustness checks confirm similar patterns but reveal quantile-dependent asymmetries in spillover behavior.
For investors, the findings highlight the need for dynamic portfolio strategies that balance ESG integration with diversification through sectoral assets in emerging markets. For regulators, the results emphasize the importance of strengthening ESG disclosure and oversight to reduce systemic vulnerabilities.
This is one of the first studies to systematically investigate ESG–market connectedness in India, a high-growth emerging economy. By integrating connectedness measures with portfolio optimization, the study provides novel insights into how sustainable finance interacts with systemic risk, offering guidance for investors, regulators and academics alike.
1. Introduction
Environmental, Social and Governance (ESG) investing has experienced substantial global growth in recent times, and this trend has also extended to the Indian investment landscape. As the importance of investors harmonizing their financial objectives with sustainable development advances, ESG investing has surfaced as an effective tool for yielding positive impact in addition to monetary gains. The Securities and Exchange Board of India (SEBI) has played a key role in promoting ESG investing by introducing mandatory ESG disclosures. The Business Responsibility and Sustainable Reporting (BRSR) now mandates ESG disclosures across nine ESG attributes. Thus, growing societal awareness among investors and an increasingly stringent regulatory environment (D'Amato et al., 2021; Chen and Xie, 2022) have led to the ESG growth story, and it has now moved from a vague concept to a business and investing priority.
Asset managers globally are increasing their ESG-related assets under management (AUM), which is expected to cross US$ 33.9 Tn by 2026, constituting more than 20% of the total global AUM (PwC's Asset and Wealth Management Revolution 2022 report). This depicts a dramatic and continuing shift in the asset and wealth under-management industry owing to increased investor inclination towards ESG investing due to two reasons. First, a focus on ESG investments actively promotes ethical investment practices (Broadstock et al., 2021). Second, ESG investments are increasingly recognized as improving the performance of managed portfolios, reducing portfolio risk and increasing returns (Albuquerque et al., 2020). ESG ratings are now widely being adopted as a crucial component of investment decisions, as these effectively and objectively provide investors and regulators with comparable and comprehensive information to address asymmetries (Cappucci, 2018), improve the environmental awareness of managers, and promote the quality and quantity of green innovations (Tan and Zhu, 2022). The companies with the highest ESG ratings in a particular sector are included in the ESG indices (MSCI, 2019). Inclusion in such an index confirms a “green” label for the company, which favorably impacts its stock price returns (Tang and Zhang, 2020).
Financial markets are interconnected, and ESG stocks are no exception to that. The domino effect has found its relevance in the ESG realm as well. Numerous studies have documented the role of international turmoil in accelerating the spillover of information and risks from one ESG market to another (Ren et al., 2022). The accelerated global integration has offered opportunities for investors to invest in superior ESG companies worldwide (Gao et al., 2022). While it offers amplification of synergies and resonance between ESG markets, it also increases the interconnectedness of the ESG market (Wan et al., 2024). The dynamic connectedness of cross-markets has implications for portfolio management concerning portfolio rebalancing and hedging strategies (Umar et al., 2023). Thus, investigating the interconnectedness among ESG global indices can provide important insights for investors and portfolio managers.
Extensive research has examined the dynamic interrelationships among various ESG indices, as well as those between ESG indices and broader capital market indices (Wan et al., 2024; Babu et al., 2022; Zhang et al., 2022; Lu et al., 2023; Sahoo and Kumar, 2022; Cagli et al., 2023; Jain et al., 2019). A considerable body of literature has also explored the relationship between connectedness and risk assessment, as well as implications for portfolio management (Azmi et al., 2023; Umar et al., 2023; Jiang et al., 2023). Moreover, the dynamics of contagion and resilience in response to market disruptions have gained attention (Barro et al., 2020; Ramelli and Wagner, 2020). However, existing studies on the interplay between ESG indices and broader capital market indices remain largely concentrated in developed or global contexts, with minimal focus on emerging economies like India.
India presents a particularly compelling case for examining ESG integration and connectedness dynamics. As one of the fastest-growing major economies, India has witnessed a notable surge in investor interest toward sustainable assets, evidenced by the sharp rise in ESG-focused AUM. Regulatory developments have further reinforced this momentum—most notably the SEBI’s introduction of the Business Responsibility and Sustainability Reporting (BRSR) framework, one of the most comprehensive ESG disclosure mandates globally. Moreover, the structure of India's capital markets—characterized by a dominant retail investor base, sectoral concentration, and acute responsiveness to regulatory and geopolitical shifts—creates a distinctive context for analyzing return and volatility spillovers. Despite India’s growing prominence in global sustainable investing, empirical evidence on ESG connectedness within its financial ecosystem remains limited.
Addressing this gap, our study offers novel insights into the interconnectedness between ESG and traditional asset classes in an under-researched emerging market context. Specifically, we examine the return and volatility spillovers among four key ESG indices (Nifty ESG 100, BSE ESG, CARBONEX, GREENEX), major sectoral indices and broad market benchmarks of the Indian capital markets. Methodologically, the study leverages the extended joint connectedness (EJC) approach based on the time-varying parameter vector autoregression (TVP-VAR) framework proposed by Balcilar et al. (2021), allowing for a nuanced analysis of evolving interdependencies. Complementing this, we adopt the portfolio strategy framework developed by Broadstock et al. (2022) to derive hedge ratios and optimal portfolio weights, thereby offering practical insights for portfolio rebalancing and risk mitigation.
Our contributions to the literature are threefold. First, we advance the understanding of ESG-financial market interactions in emerging economies, providing evidence that complements the more extensively studied developed markets. Second, we examine both return and volatility connectedness across a comprehensive set of ESG, sectoral and broad-based indices, highlighting asymmetries in their spillover patterns. Third, by integrating network analysis within the TVP-VAR framework, we offer a deeper exploration of the temporal evolution and intensity of interconnectedness, contributing to both the connectedness and portfolio optimization literature. Collectively, our findings hold relevance for global investors, portfolio managers, regulators and policymakers seeking to navigate the complex and evolving ESG-finance landscape in emerging markets.
The study’s following sections are organized as follows: The review of recent and previous literature on the subject is discussed in Section 2 of this article. The paper’s data and methodology are presented in Section 3. Results and discussions are shown in Section 4. Section 5 concludes the study with some limitations and policy implications.
2. Review of literature
The emergence of sustainable investments has prompted extensive research into their intersections with diverse financial markets, focusing on disengagement from conventional markets and providing portfolio diversification advantages. The phenomenon of contagion and connectedness among diverse indices has been extensively documented in the existing literature (Bajaj et al., 2022; Chang et al., 2023; Asl et al., 2023; Kwilinski et al., 2023; Liu et al., 2023; Papathanasiou et al., 2022; Tsang et al., 2023). The pertinent literature is categorized into two realms: investigating spillover effects within sustainability-related products and examining the dynamics among equity investment, commodities and ESG indices.
ESG indices, despite their relatively brief historical trajectory, exhibit distinctive patterns of return and volatility spillovers and connectivity within sustainable indices (Malhotra, 2024). Accordingly, Chen and Lin (2022) focus on examining the spillover effects within the equity markets of global ESG leaders utilizing the quantile-based VAR approach. Building upon this, Shaik and Rehman (2023) delve into the dynamic volatility connectivity of significant ESG stock indexes globally, revealing distinct patterns. Moreover, Wan et al. (2024) employ the TVP-VAR time and frequency connectedness approach to analyze the return and volatility dynamics across worldwide ESG stock indices, incorporating the impact of significant events, such as global crisis and the COVID-19 pandemic. Gao et al. (2022) construct a risk linkage network to further explore the risk contagion mechanism. However, Sahoo and Kumar’s (2022) findings show a lack of co-integration among ESG stock indices, with short-run bidirectional causality observed across the four ESG indices within BRICS nations. Zhang et al. (2022) study employs a Dynamic Conditional Correlation and Generalized AutoRegressive Conditional Heteroskedasticity (DCC-GARCH)-based dynamic connectedness approach to analyze the dynamic connectivity among sustainability-related financial indexes, identifying carbon emission futures as volatility transmitters and green bonds as volatility receivers. Additionally, another study by Akhtaruzzaman et al. (2022), Lu et al. (2023), Uddin et al. (2022) and Umar et al. (2020) contributes to the expanding body of literature in the field.
Another strand of literature explores the intricate relationship among or between conventional, sustainable and commodity indices. Kilic et al. (2022) investigated the interdependencies between the conventional stock market and ESG stocks across developed and developing nations, revealing noteworthy co-movement patterns using periods of financial turbulence. A study by Cepni et al. (2023) delved into the impact of climate uncertainty on spillover effects within European conventional and ESG financial markets. Lucey and Ren (2023) contribute insights into the tail risk spillovers among sustainability-related products, energy futures and energy equities, while Cagli et al. (2023) examine the interactions between commodity and equity investments, with a specific focus on ESG markets. Umar et al. (2023) navigates the dynamic relationship between fossil fuels and digital ESG assets (green cryptocurrencies). Azmi et al. (2023) explore the aftermath of Silicon Valley Bank’s failure on global assets. Hanif et al. (2023) employ wavelet coherence to analyze the time-frequency dependence between oil shocks and green stocks, and El Khoury et al. (2023) investigate the connectedness of FinTech, ESG, renewable energy, gold and Morgan Stanley Capital International (MSCI) indices in developed and emerging countries. Jiang et al. (2023) explore the impact of the Russia–Ukraine conflict on returns spillovers among traditional/new energy, green finance and ESG. Asl et al. (2023) integrate stock markets, ESG factors and Shariah compliance within a unified framework. The authors utilize the multivariate factor stochastic volatility (mvFSV) framework to discern the volatility across various sectoral indices. The empirical findings of Papathanasiou et al. (2022) elucidate that value stocks serve as effective hedging instruments against the risk arising from the volatility of other investment instruments. In a separate study, Lei et al. (2023) directed attention to the role of precious metals as a sanctuary for global ESG indices, particularly during the challenging period of the COVID-19 crisis. Shahzad et al. (2023) explore the relationship between blockchain-based platforms and global ESG-based indexes (S&P Global 1200 ESG Index (ESG) and its shariah-screened counterpart (SESG)). Jain et al. (2019) conducted a comparative study on the integration of sustainable and conventional indices, revealing the flow of information between these investment avenues. Together, these studies contribute a nuanced understanding of the complex dynamics within contemporary financial markets, transcending traditional boundaries and enriching the academic discourse.
In conclusion, the predominant focus of extant research within the ESG market domain lies on global indices, particularly those of developed ESG stocks. Notably, scant attention has been devoted to investigating the characteristics of ESG market indices in emerging markets. Ling et al.’s (2023) study took the initiative in the China context, where they constructed six indices to gauge tail risk spillover from the banking system to firms. In the Indian, context, Babu et al. (2022) examine the dynamics of volatility spillover between energy and environmental, social and sustainable indices by employing Generalized AutoRegressive Conditional Heteroskedasticity (GARCH) models such as ARCH, GARCH and GARCH-M to determine conditional volatility.
3. Data and methodology
3.1 Data
Our dataset consists of daily dividend-unadjusted closing price data of prominent Indian capital market indices and ESG and clean energy indices. The specific series are the closing price data for Clean energy – CARBONEX (S&P BSE Carbonex), GREENEX (S&P BSE Greenex), Sustainability Indices: ESG 100 (Nifty ESG 100), BSE ESG, sector-specific indices: AUTO (Nifty Auto), BANK (Nifty Bank), Commodities (Nifty Commodities), CONS (Nifty India Consumption), DIGITAL (Nifty India Digital Index), IT (Nifty IT), Metals (Nifty Metal), MNC (Pharma (Nifty Pharma), Realty (Nifty Realty), Non-renewable energy: ONG (Nifty Oil & Gas Index), broader indices: SENSEX, NIFTY50 and NIFTYUSD and, NIFTY MNC mapping the volatility in Indian Capital Markets. We directly obtain the closing price data points from the Reuters Eikon database. The study period spans from January 01, 2017, to Mar 31, 2024, and the standard data availability of the time series under the sample dictates it.
According to Dungey et al. (2005) and Vo et al. (2022), the analysis of connectedness and spillovers of volatility is generally sensitive to the definition of a crisis period and often relies on anecdotal evidence. Considering this, the study’s period is subdivided into During COVID-19 (February 03, 2020–February 23, 2022), the Russia–Ukraine War (February 24, 2022–January 31, 2024) and Overall period (January 01, 2017–March 31, 2024). Although the initial case of COVID-19 was documented in late December 2020, the period between February 3, 2020, and February 3, 2021, is considered a period of heightened crisis since the World Health Organisation (WHO) became aware of a cluster of pneumonia cases of unknown etiology during this period. As a result, global financial markets experienced substantial disruptions during this period. The announcement of the Russian military invasion of Ukraine occurred on February 24, 2022. Consequently, the period from that announcement until the present represents a period of geopolitical risk, given the profound repercussions the conflict had on global economies, specifically the energy and food sectors, which experienced unprecedented price increases and supply constraints.
The unit root statistics (Elliott et al., 1992) suggest using the natural log differences series, which can be interpreted as a percentage change in the price points of these non-stationary variables. This strengthens the case for modeling the dataset’s volatility with time-varying conditional correlation.
The descriptive statistics for these series are displayed in Table 1. We use the natural log of the weekly returns of all variables. Comparing the first three moments between sub-periods reveals that, on average, returns were greater during the COVID-19 crisis combined with the higher kurtosis values. As a risk metric, the standard deviation increased significantly during the crisis. In Panel I, METAL followed by AUTO and ONG has the highest standard deviation. In Panel II, REALTY and METAL, with the highest standard deviation, outnumber ONG and AUTO during the COVID crisis period. IT, backed by the adoption of cloud and work-from-home solutions during the COVID crisis, offered high mean returns. The negative mean returns for NIFTY USD demonstrate the impact of war on the INR/USD exchange rate. Curiously, we find that all series are significantly leptokurtic, which means that the distributions have fatter tails than a normal distribution. This supports the findings of the Jarque and Bera (1980) normality test; all assets are significantly non-normally distributed. The kurtosis values for sustainability-oriented indices BSE ESG, ESG 100, CARBONEX and GREENEX (36.97, 21.95, 23.65 and 17.31) over the full sample period are substantially greater and only comparable to broader indices, indicating the extreme fluctuations in returns. At a significance level of 5%, the Augmented Dickey–Fuller (ADF) and Phillips–Perron (PP) test values are significant, indicating the presence of a unit root.
3.2 Methodological issues
The complex nature of financial market spillovers makes it challenging to identify a single indicator of shock transmission. Earlier studies employed network analysis to explore contagion and interconnectedness in financial systems (Diebold and Yılmaz, 2008; 2010; Ballester et al., 2016; Dungey et al., 2019; 2020). Among recent approaches, the connectedness framework by Diebold and Mody (2015) has gained prominence, utilizing Impulse Response Functions (IRF) and Forecast Error Variance Decomposition (FEVD) to map the transmission of shocks across variables. While this model offers valuable insights into feedback mechanisms, its reliance on arbitrarily chosen rolling-window sizes introduces estimation bias. To overcome this limitation, Antonakakis et al. (2020) propose a Time-Varying Parameter VAR (TVP-VAR) model, which adapts dynamically to evolving relationships. Supporting this, Koop and Korobilis (2013) demonstrate the TVP-VAR model's robustness to outliers. Additionally, Lastrapes and Wiesen (2021) introduce a joint spillover index grounded in the goodness-of-fit, offering a more intuitive interpretation of network connectedness.
In line with these methodological advancements, we adopt the TVP-VAR EJC approach proposed by Balcilar et al. (2021), combining the frameworks of Antonakakis et al. (2020) and Lastrapes and Wiesen (2021). This model is particularly suited to the Indian financial context, characterized by frequent structural shifts due to policy reforms, geopolitical tensions (e.g., COVID-19, Russia–Ukraine war) and evolving ESG regulations. Unlike static models such as Dynamic Conditional Correlation–GARCH (DCC-GARCH) or conventional VAR, the TVP-VAR framework captures both gradual and abrupt changes in connectedness, making it ideal for emerging markets where investor responses may be nonlinear and regime-dependent.
To further enhance contextual relevance, we divide the sample into theoretically and empirically motivated subsamples based on key regulatory (e.g., SEBI's BRSR mandate), macroeconomic and geopolitical events. This allows us to explore temporal heterogeneity in spillover patterns, which may be masked in full-sample estimations. Overall, this methodology enables a robust and nuanced analysis of dynamic connectedness and spillovers exerted by sustainability indices on the sector-specific as well as broader indices representing the Indian capital markets in the context of recent geo-political crisis such as COVID-19 and the Russian–Ukraine war.
3.2.1 Time-varying parameter vector auto regression (TVP-VAR)
Antonakakis et al.’s (2020) TVP-VAR method incorporates the work of Diebold and Mody (2015) and Koop and Korobilis (2013), both of which assume a time-varying variance-covariance structure. This framework allows for the flexible and comprehensive capture of potential changes in the underlying data structure. In this model, neither the rolling-window size nor the number of observations is lost during the calculation of the dynamic measures of connectedness. In this investigation, the TVP-VAR model is estimated using Bayesian Information Criteria (BIC), as suggested by Balcilar et al. (2021):
where , and are M x 1 dimensional vector and and M x M dimensional matrices. v() and vt are x 1 dimensional vectors, whereas is a x dimensional matrix. The model permits all parameters ( and hence the relationship across series to may fluctuate over time. Another assumption of the model is that variance-covariance matrices, and also vary overt time.
The framework recommended by Balcilar et al. (2021) follows Pesaran and Shin's (1998) Z-step ahead generalized forecast error variance decomposition (GFEVD). The GFEVD, , represents the spillover transmission, the impact of a shock stemming from variable x on variable y, and it can be written as follows:
where denotes a M x 1 zero selection vector that has a unity on its xth position and , (Z) represents a proportional reduction in the variance of prediction error of variable x conditional on the future shocks in variable y.
≠ 1 normalized to unity leads to the value of generalized Spillover Transmission, . The spillover transmission from and to for variable x can be expressed as:
From a granular perspective, the approach also provides a metric for measuring bilateral interconnectedness between two variables, net the pairwise directional spillover:
If > 0 (, variable x has a greater impact on variable y than vice versa, implying the dominance of variable x on variable y.
3.2.2 Extended joint connectedness approach
The joint connectedness approach links the derivations of the original connectedness approach to the goodness-of-fit measure. The main goal of the EJC approach is to arrive at the equivalent of , namely if below conditions are fulfilled:
Lastrapes and Wiesen’s (2021) study is followed to generalize the scaling approach, in which the scaling factor differs by each row. This is programmed as follows:
Finally, the net total and pairwise directional connectedness measures as follows:
As a result, the joint connectedness approach of Balcilar et al. (2021) permits greater flexibility and the computation of net pairwise directional connectedness measures that illustrate bilateral strength of variables. The PCI (net pairwise connectedness) measure thus extracted from the model will be utilized in the study to compute the Minimum Connectedness Portfolio (MCoP) as well as the bivariate hedge ratios.
3.2.3 Minimum connectedness portfolio allocation method (MCoP)
The pairwise connectedness index (PCI) calculated above is utilized as a measure of interactions between two assets and may be accepted as an optimization criterion for portfolio allocation. Thus, variables (investment assets), which do not influence others and are not influenced by others will be given higher weightage. In this study, we adopt the MCoP suggested in Broadstock et al. (2021, 2022). As a result, the proposed MCoP approach can be stated as follows:
where denotes the pairwise directional connectedness matrix obtained from TVP-VAR model.
3.2.4 Portfolio evaluation approach
After the various allocations of assets under the portfolio, we evaluate the performance of the portfolio. Initially, the hedge ratio according to Kroner and Sultan (1993) is used to calculate the minimal conditional hedge ratio, . The implied downward bias in the conventional hedge estimate and the implicit supposition that the risk in the spot and futures markets remains constant over time are addressed by this measure. Since the spot and future price distributions are time-varying, the payoff, the payoff, at time t for purchasing one unit of spot and going short in units of future at some time in the past can be expressed as:
The investor selects his optimal one-period futures holdings at each time t by maximizing the expected utility function, where risk is now measured by conditional variances calculated based on the information available at time t. At time t, the utility maximizing hedge-ratio gauges the degree of hedging of a long (short) position in asset x by a short (long) position in asset y:
Secondly, we analyze portfolio of assets x and y with a risk-minimizing approach, without reducing the return expected. The portfolio weights are computed following Kroner and Ng (1998), where is the weight of asset x in one-unit of a portfolio of asset x and asset y at t.
We utilize the time-varying cumulative portfolio returns to gauge the profitability of the MCoP over time.
4. Findings and discussion
This section describes the empirical findings of the research with full sample statistics, including periods of stability and crisis. The empirical discoveries are presented panel-wise across three-time windows in order to examine the time-varying pattern of connectivity between sampled variables for the three highlighted asset classes (Indian sustainability indices, sectoral and broader capital market indices). Additionally, the findings shed light on the impact of economic shocks that occurred during the coverage period, namely the COVID-19 pandemic and the Russo-Ukrainian War. Coverage of the first sub-period: during COVID (February 3, 2020 to February 23, 2022) and the second sub-period: from February 24, 2022, to March 31, 2024. The overall duration is from January 1, 2017, to March 31, 2024.
4.1 Time-varying total dynamic connectedness results
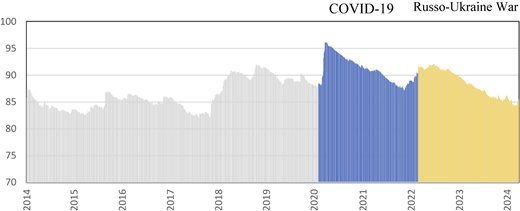
Figure 1 displays the findings of an analysis of the average total time-varying spillovers between the sampled variables belonging to the distinct asset classes: sustainability indices, sector-specific indices and broader indices. The graph displays the time-varying volatility from January 1, 2017, to March 31, 2024. The level of return volatility approached 97% in March 2020 as a consequence of the COVID-19 pandemic. The WHO officially designated the novel coronavirus COVID-19 as a global pandemic on March 11, 2020 (Kumar et al., 2021). Following an extended phase, this volatility reached a plateau in 2021 before ultimately declining to 87%. Nevertheless, the return spillover was significantly intensified by the Russian invasion of Ukraine, surpassing 92%. A clear illustration of the effects of two discrete categories of crises on the sample markets can be observed in Figure 1. This assertion has been corroborated by a number of studies (Papathanasiou et al., 2022; Sharma et al., 2022; Cepni et al., 2023; Hanif et al., 2023; Lucey and Ren, 2023; Cagli et al., 2023; Jiang et al., 2023). ESG and green equities exhibit a comparable degree of sensitivity to unforeseen occurrences as capital markets, emerging as net transmitters in the propagation mechanism and offering restricted opportunities for portfolio diversification (Lucey and Ren, 2023; Cagli et al., 2023; Lu et al., 2023; El Khoury et al., 2023).
4.2 Average return spillover connectedness
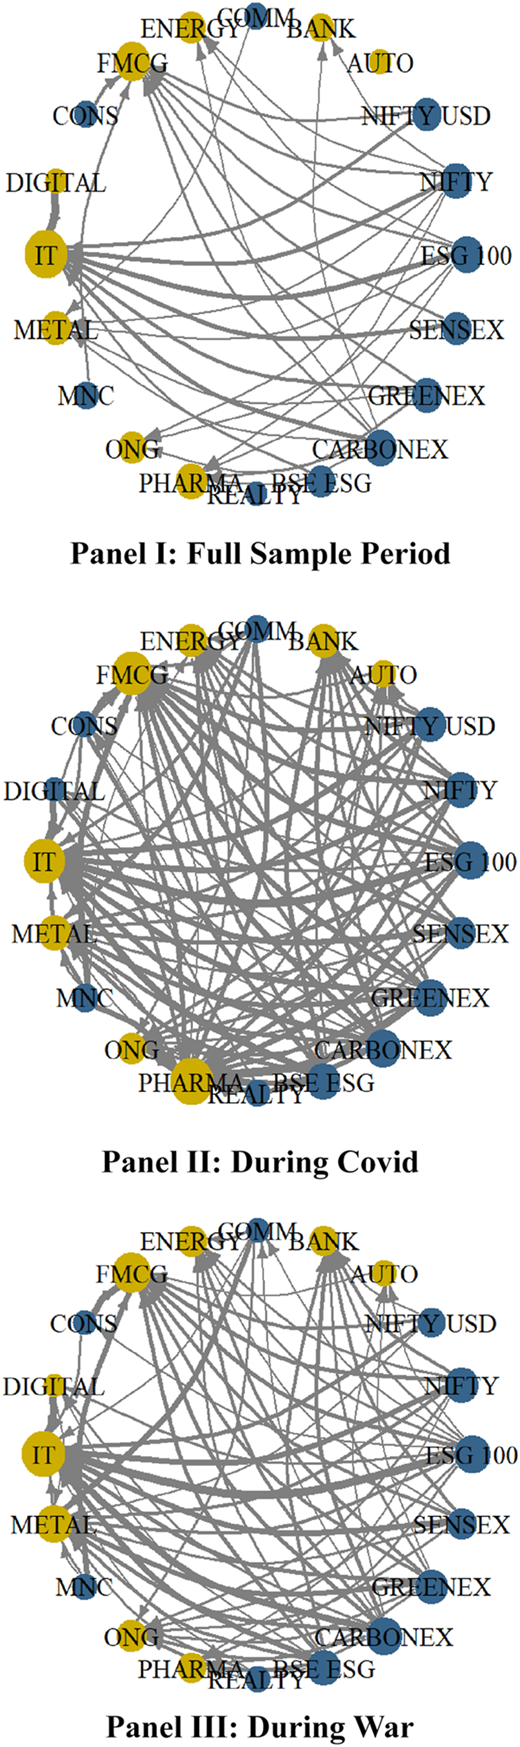
This section displays the average spillover connectedness results, as illustrated in Figure 2. Panel I delineates the connectedness of the entire sample period, where ESG 100 and BSE ESG from the sustainability indices, as well as NIFTY, NIFTY USD and SENSEX from the broader benchmark indices, along with CARBONEX and GREENEX from the clean energy indices, emerge as prominent net transmitters of spillover, while the rest absorb the shocks generated by the system. The intensity of connectedness is moderate, with DIGITAL (IT) standing out as the largest net transmitter (receiver) towards IT (DIGITAL). Interestingly, DIGITAL and IT share interlinkages during the full sample period.
Further, during COVID-19, connections amongst the sample assets are presented in panel II. Here, PHARMA, ONG, METAL, IT, FMCG, ENERGY, BANK and AUTO are the net recipients of spillover, and the remaining assets are transmitting the shocks towards the system. The intensity of connectedness is comparatively higher than the overall time frame. At the same time, CONS (FMCG) emerged as the largest transmitter (receiver) during the COVID-19 crisis, transferring (receiving) spillover towards (from) FMCG (CONS). Similar to the full sample, DIGITAL is a net transmitter to IT. It is important to note that COMM evolved as a prominent transmitter during the COVID-19 crisis, as the pandemic outbreak gave a major boost to remote workplaces and the work-from-home requirement (Federici et al., 2022; Chawla et al., 2022). Also, as evident from the interlinked web of spillovers, the spillover mechanism gains strength during the pandemic period (Sharma et al., 2022; Papathanasiou et al., 2022; Hanif et al., 2023, Shahzad et al., 2023; Sahoo and Kumar, 2022; Iqbal et al., 2024). ENERGY, FMCG, DIGITAL, METAL, IT, ONG and REALTY (receiver to the transmitter) changed their status during the COVID crisis compared with full sample data. From the policy perspective, CONS, COMM, DIGITAL and MNC confirm a low degree of linkages, which creates a massive space for portfolio diversification and hedging during stressful times (Kumar et al., 2024; Naeem et al., 2022).
Additionally, panel III depicts the interconnection among the sample assets during the Russia–Ukraine geopolitical conflict (GPC). The picture is similar to the COVID-19 subsample analysis, as ESG 100, BSE ESG, NIFTY USD, NIFTY, SENSEX, GREENEX & CARBONEX are the net risk spreaders. At the same time, the remaining indices are net absorbers. Interestingly, during GPC, ESG 100, CARBONEX, followed by BSE ESG and GREENEX, turned out to be the biggest volatility generators in the system (El Khoury et al., 2023; Singh et al., 2022; Lu et al., 2023). It is also worth mentioning that connectedness and spillovers from ESG and clean energy indices to ONG intensified during the crisis periods (Lucey and Ren, 2023; Jiang et al., 2023). This is in line with the increasing global consciousness and action around environment and sustainability.
In summary, ESG 100, BSE ESG, CARBONEX and GREENEX are the key players in spillover behavior in Indian capital markets, in addition to the much-anticipated broader benchmarks. This even becomes critical during crises. On the other hand, CONS and DIGITAL exhibit the least linkage during critical periods and could serve as haven assets, which aligns with the findings of Chen et al. (2023).
4.3 Robustness check
To ensure the robustness of these findings, we re-ran the investigation and conducted additional checks by applying the Quantile VAR (QVAR) model using the lag length selected via the Hannan–Quinn information criterion (HQIC) in place of our original selection method. We also varied the FEVD horizon to 10-day windows alongside the baseline 20-day setting. The results from both the TVP-VAR (20-day window) and QVAR models reveal a broadly similar transmission structure (refer to Appendix I). In both specifications, ESG 100, BSE ESG, CARBONEX and GREENEX consistently emerge as dominant net transmitters across the full sample and during crisis phases, reinforcing their role as systemic volatility drivers in the Indian capital markets. Likewise, NIFTY, SENSEX and NIFTY USD remain key benchmark transmitters, while CONS (FMCG) and DIGITAL exhibit persistently low connectivity, indicating potential safe-haven and diversification benefits. Both models also confirm that market-wide connectedness intensifies sharply during the COVID-19 pandemic and the Russia–Ukraine conflict.
However, model differences become evident in sector-specific spillover dynamics and the conditional nature of transmission. First, TVP-VAR captures sharper temporal peaks in connectedness, with COMM (Commodities) emerging as a significant transmitter during COVID-19, likely reflecting supply chain and infrastructure demand shocks, whereas QVAR assigns relatively lower systemic importance to COMM but highlights ONG and METAL as stronger transmitters in extreme market conditions (upper quantiles). Second, in TVP-VAR, the DIGITAL–IT pair maintains a stable reciprocal linkage across all phases, while QVAR shows this relationship weakening in lower quantiles, suggesting that the interdependence is stronger in bullish or neutral regimes than in stressed downside markets. Third, during the war period, both models identify intensified spillovers from ESG and clean energy indices to ONG, but QVAR further indicates a more pronounced bidirectional feedback from ONG at the upper quantile, implying stronger mutual volatility reinforcement under extreme market stress.
Overall, the robustness check confirms that while the broad network architecture and core transmitters are stable across methodologies, the QVAR model enriches the analysis by revealing quantile-dependent spillover asymmetries, whereas the TVP-VAR highlights the temporal evolution and episodic surges in sectoral connectedness. Together, these results provide a more nuanced understanding of the systemic role of ESG assets in emerging market contexts and offer complementary insights for both policy design and portfolio strategy formulation.
4.4 Minimum connectedness portfolio and portfolio rebalancing
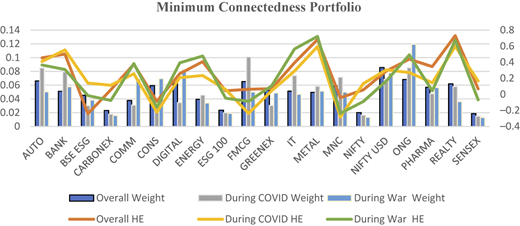
In this section, we examine the implications for risk management and portfolio diversification by constructing the portfolio weights and returns delivered by the MCoP strategy. Broadstock et al. (2022) proposed minimum portfolio weights based on the pairwise spillover connectedness index of the TVP-VAR model. It offers a framework of interconnectedness between variables more resistant to network disturbances (Lu et al., 2023). A greater portfolio weight indicates that the portfolio has less influence on others. NIFTY USD is given the most weight (8.57%) in the MCoP for the overall period (refer to Figure 3). During the COVID-19 period, the minimum connectedness strategy assigns the highest allocation to FMCG (10.1%), followed by ONG (8.54%). The outbreak of Russo–Ukraine war led to the emergence of a geo-political risk and a sharp increase in commodity markets due to supply chain disruptions (Izzeldin et al., 2023). The weightage assigned in the MCoP thus also underwent transition, with ONG receiving the maximum weightage (11.93%), followed by DIGITAL (8.25%).
The graph above also sheds light on the HE of each of the sampled assets based on the optimal hedge ratio. HE measures the extent to which change in the fair value of the hedging instrument offsets changes in the fair value of the hedged asset. Figure 3 illustrates that on average, REALTY (66.79%), followed by METAL (66.67%), commands the highest HE amongst all the sampled assets. The MCoP strategy allocation indicates that if on average 6.2% is allocated to REALTY and 4.96% to METAL, then the proportion of the volatilities in the portfolio will be statistically significantly lowered by 141%, and this holds even during times of crisis, HE being 119% during the pandemic and 139% during the war. It is worth highlighting that the sustainability indices, ESG 100, BSE ESG, GREENEX and CARBONEX, emerged as persistent net transmitters to the network across all the phases. The volatility-transmitting character of these sampled assets is also apparent in their low average HE ratio: BSE ESG (−3.91%), ESG 100 (1.91%), CARBONEX (3.18%) and GREENEX (7.25%). During the war period, these assets BSE ESG -1.63%), CARBONEX (−7.54%) and ESG 100 (−4.73%) command negative HE, which sheds light on the inability of these assets to reduce the risk of the MCoP during times of geo-political crisis.
4.5 Cumulative portfolio returns
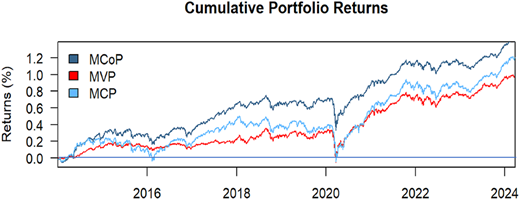
Next, we discuss the returns delivered by the portfolio constructed using the minimum connectedness approach proposed by Broadstock et al. (2022). Figure 4 presents the cumulative return of each of the three portfolio strategies: MCoP, Minimum Variance Portfolio weights (MVP) and Minimum Correlation Portfolio (MCP). As is evident, all three portfolio strategies exhibit a discernible degree of equivalence, with comparable dynamics that experienced a noticeable decrease during the pandemic’s outbreak in March 2020, followed by continued growth through the end of the sample. It’s essential to notice that the return values are near zero because they are daily returns. MCoP is presented to be preferential, as the returns are positive, with an increasing trend throughout the study period. In contrast, the MCP portfolio saw its lowest returns and even turned negative during the COVID-19 pandemic, while the MVP portfolio generated near-zero returns. Following the inception of the Russo-Ukrainian War on March 22, the returns on the MVP and MCP portfolios are comparatively lower. The MCoP strategy’s superior return generation is demonstrated by the fact that the portfolio returns consistently outperform the returns generated by the MVP and MCP strategies throughout the sample period.
4.6 Portfolio rebalancing and risk management
This section delves into the risk management and portfolio rebalancing strategies for a portfolio comprising the sampled assets. The optimal hedge ratios are constructed using a conditional variance-covariance matrix on the underlying assumption that investors take a long (short) position in one of the following indices when the future volatility is expected to be higher (lower) compared to the current volatility level. Investors might hedge their long or short positions. Table 2 below details the basic statistics of bilateral hedge ratios between the first and second assets over three-time windows: Overall, During COVID and During War. The optimal hedge ratio depicts that a one-dollar-long position for ESG100/CARBONEX/GREENEX may be offset with the average value of the hedge ratio (expressed as per cent) of a short position in the second asset (respective index). For instance, a ₹1 position in ESG100 can be hedged for ₹1.7856 investment in the NIFTY when the hedge ratio for ESG100/NIFTY is ₹1.7856. The bilateral hedge ratios reveal that they are event-dependent and fluctuate within a time-varying framework. The average hedge ratio for ESG 100 and the respective index ranges from 0.3391 to 1.7856 (Overall), 0.3453 to 1.957 (During COVID) and 0.2231 to 1.9232 (During War). A similar pattern is noticed for CARBONEX and GREENEX, with the highest ratios observed during the COVID period (0.3453–1.957 and 0.3839 to 1.558), respectively. This further implies that it is most expensive to hedge volatility in sustainability indices by taking opposite positions in the respective indices during the COVID period. The results shared in Table 2 also reveal that compared to remaining assets in the sample, across the phases, PHARMA and REALTY provide the opportunities for hedging the volatility in sustainability indices at the least possible cost, with average HR being 0.32 for PHARMA and 0.38 for REALTY. The HE statistics shared in Figure 3 above indicate that both the indices command a high HE of 67%, albeit at a lower cost. The international investment diversification, investors, hedgers and diversifiers from around the world must capitalize on these findings, as also suggested by Adekoya et al. (2022), Berner et al. (2022), Fahmy (2022) and Lu et al. (2023).
5. Conclusion
This study provides novel evidence on the dynamic return and volatility connectedness between ESG, clean energy, sectoral and broad-based Indian capital market indices, an area where empirical research remains scarce for emerging economies. Using the TVP-VAR EJC framework, complemented by a QVAR (HQ criterion) robustness check, we reveal that ESG and clean energy indices, particularly ESG 100, BSE ESG, CARBONEX and GREENEX, are persistent net transmitters of volatility. Spillover intensity peaks during systemic crises such as the COVID-19 pandemic and the Russia–Ukraine conflict, underscoring the systemic relevance of sustainable assets in a fast-growing emerging market.
For investors and portfolio managers in emerging markets, the findings demonstrate the necessity of dynamic, connectedness-aware portfolio strategies. The superior performance of the MCoP over traditional MVP and MCP strategies shows the value of accounting for systemic linkages when constructing ESG-integrated portfolios. The identification of REALTY and PHARMA as consistently cost-effective hedging instruments offers a practical pathway for mitigating ESG-related risks, while the low-linkage characteristics of sectors like FMCG and DIGITAL highlight diversification opportunities that can be particularly valuable in volatile emerging markets.
For regulators and policymakers, the results underscore the importance of strengthening ESG market infrastructure in emerging economies. India's regulatory leadership through SEBI's BRSR framework demonstrates that credible disclosure regimes can enhance market integrity, but the systemic transmission patterns identified here suggest a need for greater standardization, independent verification of ESG metrics and crisis-responsive oversight mechanisms. Such measures would not only reduce systemic vulnerabilities but also bolster global investor confidence in emerging market ESG assets.
For the academic community, this study fills a critical gap by providing high-frequency, market-level evidence of ESG connectedness in an emerging economy setting. By combining connectedness measures with portfolio optimization frameworks, it offers a methodological blueprint that can be replicated across other developing markets, enabling comparative insights into how ESG assets behave under different market structures and regulatory regimes. Future research can extend this approach to cross-market linkages, firm-level ESG metrics and the role of international capital flows in shaping spillover patterns.
By situating India's experience within the broader emerging market narrative, this research not only enhances our understanding of ESG dynamics in high-growth economies but also provides actionable insights for managing systemic risk, shaping policy and advancing the global discourse on sustainable finance.
The supplementary material for this article can be found online.