The recommendation of the analyst report is not only limited to a small number of ratings, but also biased toward a buy opinion with the absence of sell opinion. As an alternative to this, this paper aims to extract analysts' textual opinions embedded in the report body through text analysis and examine the profitability of investment strategies. Analyst opinion about a firm is measured by calculating the frequency of positive and negative words in the report text through the Korean sentiment lexicon for finance (KOSELF). To verify the usefulness of textual opinions, the author constructs a calendar-time based portfolios by the analysts' textual opinion variable of each stock. When opinion level is used, investment strategy has no significant hedged portfolio return. However, hedged portfolio constructed by opinion change shows significant return of 0.117% per day (2.57% per month). In addition, the hedged return increases to 0.163% per day (3.59% per month) when the opening price is used instead of closing price. This study show that the analysts’ opinion extracted from text analysis contains more detailed spectrum than recommendation and investment strategies using them give significant returns.
1. Introduction
Analyst reports produce information about companies, which is mainly delivered through recommendations, target prices and earnings forecasts. They are expected to serve as important investment information to investors. In practice, however, investors often ignore these metrics because they think there is no particular information in analyst reports. There are several reasons. First, the recommendation of the analyst report is limited to a small number of ratings. Second, recommendations are extremely biased to buy opinion with almost no sell opinion. Most of the target prices are set higher than the current stock prices. Moreover, there are hardly change in recommendation and target price. As a result, it is not easy for investors to obtain meaningful information from analyst reports.
This paper pays attention to the text of analyst report, which accounts for the largest portion in analyst report in terms of volume. With the recent development of text mining technique, more detailed information can be extracted from the text. Moreover, the literature shows that text analysis is more effective in detecting negative opinions than positive ones. This characteristic of textual analysis is suitable for finding analysts' negative views in their reports because analysts can write their negative opinions in the text of analyst report that could not be even reflected in the recommendations. I attempt to capture analysts' negative opinions in more detailed beyond recommendation.
The main goal of this study is to verify the economic usefulness of these analyst report texts in terms of investment strategy. After extracting text from analyst report and measuring analyst opinion, the performance of investment strategy using this information is examined. Therefore, this paper consists of two parts: the process of obtaining analysts' opinions from the text of their reports, and the process of verifying the profitability of investment strategy using them. These two processes are specifically as follows.
Analyst opinion in the report text is obtained using positive and negative sentiment lexicons. The opinion variable (OPN) is the frequency of positive words minus the frequency of negative words standardized by the sum of the two frequencies. The accuracy of measuring the textual opinions using positive and negative word list depends on the dictionary quality. Loughran and McDonald (2011) point out the problems of using a general-purpose sentiment dictionary for financial analysis. They propose a new financial-specific sentiment dictionary to supplement this problem. Based on their argument, I calculate the textual opinion using the Korean sentiment lexicon for finance (KOSELF) developed by Cho et al. (2021, 2022).
To verify the profitability of text opinions, calendar-time-based portfolios are constructed according to the method proposed by Barber et al. (2001). They originally construct their portfolios using analyst recommendations. However, in the case of Korea, it is difficult to construct the portfolios by recommendations because there is almost no sell opinion. Even the long-short hedge portfolio cannot be verified due to the lack of firms to be included in the short portfolio. In this study, analyst opinions extracted from texts have various spectra and thus short portfolio composition is possible. Specifically, the portfolios are constructed as follows. Each day the textual opinion consensus of a stock is calculated and five portfolios are constructed based on this. The portfolios are rebalanced daily as text opinion changes. Three-year investment period from 2016 to 2018 is adopted to examine the difference between the returns of these five portfolios. If the text information of an analyst report is valuable, the more positive opinion portfolio, the higher the return should be. In addition, significant hedged return should be found and maintained even after considering various benchmarks such as market return and factor loadings.
Analyst report data for empirical analysis are obtained from the Hankyung consensus (http://consensus.hankyung.com/) provided by the Korea Economic Daily. In particular, it provides analyst reports free of charge for general users. They are updated in real time every day. Therefore, the data have an advantage that investors can use the analyst report directly for their investment.
The main results of the paper are as follows. First, the analysts' textual opinion is measured by applying lexicon approach using KOSELF that classify words into positive and negative category (Cho et al., 2021, 2022). To check the informational power of analyst textual opinion, its relationship with the cumulative abnormal return (CAR) around the disclosure of analyst reports is examined. The difference of CARs between the highest and the lowest opinion quartiles is positive and statically significant. When CARs excluding the announcement date are used, the difference is also positive and statically significant. This result indicates the textual information implied in the analyst report contains economically significant value.
Following the Barber et al. (2001), investment portfolios are constructed by sorting stocks by analysts' textual opinion (OPN) of the previous day. Each portfolio is rebalanced every day. Overall, stocks with positive analyst opinions tend to have higher returns. However, it does not have statistical significance. The result shows that the significance of the investment strategy return is not guaranteed when opinion level (OPN) is used.
Next, I use the opinion change (ΔOPN) rather than level variable(OPN) to construct the portfolios, and these give significant hedged portfolio return of 0.117% per day (2.57% per month). In addition, some modifications of portfolio rebalancing such as trading at opening price, double-sorted portfolio, using alternative opinion measures and value-weighted return are considered. A higher performance could be achieved when assuming that the portfolio rebalancing is done at the opening price of the day following the announcement date rather than the closing price of the announcement date. In this case, the hedged return increases to 0.163% per day (3.59% per month). The empirical results confirm the usefulness of analyst textual opinion through various verifications.
Here, I would like to discuss two important implications of the main results of this paper. First, what is the economic interpretation of OPN change? Analysts have their own beliefs about a particular company, and as new information becomes available, they process that information and revise their beliefs. Analysts express their beliefs through reports. A change of OPN means that the analysts' beliefs have changed due to new information about the company. Significant portfolio return from this OPN change also suggests that analysts' private information is reflected in price. The OPN level does not give a significant return because it is not related to changes in analyst beliefs derived from information processing activities.
Second, why do verbal expression convey additional information over quantitative measures? In order for analysts to express a revision in their beliefs, there must be a sufficient amount of change beyond the existing beliefs, which can be viewed as a kind of hurdle. Quantitative metric such as recommendation is sensitive information that investors are interested in, so a greater change of belief is required to correct it. In other words, it has higher hurdles. In comparison, verbal expression through text has a lower hurdle height for analysts.
This paper can contribute to the literature in the following ways. First, the usefulness of analyst reports is investigated from a text perspective. So far, we have been mainly interested in quantitative information such as recommendation or target price [1]. However, it has not yet been studied whether text information is meaningful enough to make a significant return. This study attempts to answer this question in Korea. As a Korean study on the investment strategy using the information of analyst report, Kim et al. (2007) examine the investment strategy based on recommendation. My study differs from them in that it is the first to verify an investment strategy using text information in Korea.
Second, this paper has practical value in that it provides new investment strategies to investors. Although individual investors occupy a greater proportion in the Korean stock market than institutional and foreign investors, they are considered to be inferior in information. Since analyst report used in this study can be obtained free of charge by individual investors, if individual investors utilize the methodology of this study, it will help to alleviate this information disadvantage. In addition, this paper proposes a portfolio strategy that gives the highest return by checking various factors to be considered when investing. Considered factors are whether to trade at closing price vs. opening price, use one-sorted portfolio vs. double-sorted portfolio, rebalance daily vs. weekly, adopt alternative opinion measures, and use equally weighted return vs. value-weighted return. These various considerations will not only make the results more robust, but will also make them more comfortable to use in practice.
Third, the paper provides academic and policy implication by verifying the efficiency of the Korean stock market. According to Fama (1970, 1991) who establish three types of market efficiency: weak, semistrong and strong, this paper verifies the semistrong efficient market. The analyst reports in Hankyung consensus are updated in real time every day and free to investor, and as a result it is publicly available information. Therefore, the test of investment strategy using this analyst report information will be a verification of whether the Korean stock market is semistrong efficient.
The result of significant excess returns on the ΔOPN-base portfolios may indicate that the market is not semistrong efficient. However, the daily trading strategy is not easy to implement given the trading costs such as tax, bid-ask spread, short selling fee and related cost of liquidity, etc. Weekly rebalanced portfolio returns are statistically insignificant. This means that even if the market is not semistrong efficient, it is not easy to earn significant returns by executing an actual investment strategy.
The remainder of the paper is organized as follows. Section 2 describes our data and sample. Section 3 explains the literature review. Section 4 introduces the methodology of extracting the opinions from the analyst report text and the investment strategies using analysts' textual opinions. Section 5 provides the empirical results on the performance of investment strategy and section 6 concludes the paper.
2. Data
Analyst reports of the Korean firms are obtained from the Hankyung consensus (http://consensus.hankyung.com/) provided by the Korea Economic Daily. The Hankyung consensus provides free analyst reports for users, and updates them in real time every day. Therefore, individual investors are able to obtain the report immediately for their investment. The Hankyung consensus contains various types of reports such as corporate, industry, market, derivative and economy. This paper is conducted with the corporate reports.
The corporate report of Hankyung consensus provides information such as the release date, report title, target price, recommendation, analyst name, securities company (brokerage house) to which the analyst belongs, and pdf file of the report. These data are collected from the Hankyung consensus website using the web crawling technique. The sample period is set to 3 years from 2016 to 2018.
Panel A of Table 1 shows the summary statistics of the analyst reports from 2016 to 2018. I obtain 46,750 reports as the initial sample. First, the 21,165 reports which issues at least once during a quarter remain after removing the firm with missing observation during a quarter. Second, 272 reports without recommendation and 55 reports of “Not Rated” recommendation are removed. Third, 3,207 reports not getting text due to invalid format are deleted. Fourth, the first-issued report within the sample period is removed to get the revision variables such as recommendation change. Fifth, the Korean securities dealers automated quotations (KOSDAQ) firms are also removed. Finally, 15,987 reports for the KOSPI200 firms remain as sample firms.
The stock sector of the Korea exchange (KRX) mainly consists of the Korea composite stock price index (KOSPI) and KOSDAQ markets. KOSPI market is major Korean stock market including all common stocks that make up the KOSPI. KOSDAQ market is launched for small firms benchmarked from the National Association of Securities Dealers Automated Quotation (NASDAQ). The KOSPI 200 is a capitalization-weighted index of 200 Korean stocks among the KOSPI market, like the S&P 500 in the United States (US). The stocks included in the KOSPI200 are representative stocks leading industry, and makes up 90% of the total market value of the Korean stock exchange. Therefore, the sample in this study is relatively free from problems in feasibility such as transaction cost or short selling from the perspective of trading strategy. For this reason, the equal-weight scheme is mainly used in portfolio analysis. The value-weight results are also reported in the robustness check.
Panel B of Table 1 show the summary statistics of the analyst reports according to the recommendation. The reports are divided into five ranges: Sell, Underweight, Neutral, Buy and Strong Buy. For each category the following values are arbitrarily assigned. Sell = 1, Underweight = 2, Neutral = 3, Buy = 4, Strong Buy = 5. Recommendation change (ΔREC) is the value obtained by subtracting the current recommendation value by the previous report value for a specific firm. Although the recommendation grade classification differs among securities companies, I define five categories according to Lee and Choi (2003) and Kim and Eum (2006).
Out of the total sample, there are 1 sell (0.01%) and 13 underweight (0.08%), and the combined number is only 14 (0.09%). The largest number is 14,780 with a buy recommendation, accounting for 92.45%. Next, there were 1,125 neutral recommendation, which account for 7.04%. This is consistent with previous research findings that analysts' recommendations are biased toward optimism. Asquith et al. (2005) also report that only 0.5% of US analysts had a sell recommendation and 0.2% had a strong sell recommendation. Compared to the US, Korean analysts' sell recommendation is even rarer. When trying to implement a portfolio investment strategy using analyst recommendation, the lack of sell recommendation makes it impossible to construct a short portfolio when constructing a hedge portfolio. This study attempts to supplement this lack of sell recommendation by using text information.
The recommendation change (ΔREC) variable was obtained by subtracting the recommendation value of the previous report from the current recommendation for a specific firm. For example, recommendation change of −2 indicates case in which the recommendation has decreased by 2 steps. 0 indicates a case where recommendation is maintained, and 2 indicates a case where the recommendation increases by 2 steps. In Panel B, there is 1 sell recommendation report that has been downgraded by two levels from the previous neutral recommendation. Of the 13 underweight reports, 3 reports are down one step from the neutral recommendation and 10 reports maintain the underweight recommendation.
The largest number of observations is the case where the buy recommendation is maintained, with 14,541 reports. Next is 883, which remain in neutral recommendation. In the case of rating downgrade, 241 reports are the most downgraded from buy to neutral, followed by 16 reports that fell from strong buy to buy, and 3 reports that fell from neutral to underweight. In the case of a rating increase, the most frequent reports are 221 reports that go up one level from neutral to buy, followed by 9 reports that rise from buy to strong buy, and 2 that go up two steps from underweight to buy.
Table 2 shows the summary statistics of Korean firms covered by our sample in the KOSPI market. Of the 711 companies listed on the KOSPI in 2016, 183 are covered by our sample. In terms of the number of companies, it is 25.74% of all companies, but based on the year-end market capitalization, it amounts to 85.43% of the total market. Market capitalizations covered by our sample are considered sufficient to represent the market. In addition, these stocks have abundant liquidity and can be sold short, making it easy to implement viable strategy.
In 2016, the number of securities companies that issue the analyst report is 23 and the number of analysts is 235. The average number of analysts per covered firm is about 5, and the average number of covered firms per analyst is about 4. The average recommendation rating is 3.94, which is close to buy recommendation. The statistics for 2016 so far are almost the same for 2017 and 2018.
Other than the analyst report, I resort to the following additional sources. Daily individual stock returns and market index returns (KOSPI returns) are obtained from the DataGuide database provided by the FnGuide. Firm characteristics such as size and book-to-market ratio are also from the FnGuide.
3. Literature review
This paper is mainly related to two fields. The first is literature related to the informativeness of texts. There are many researches that text information has predictive power for the asset prices. Antweiler and Frank (2004) measure bullishness signal from the Yahoo! Finance message board and reports that it predicts market volatility. Tetlock (2007) attempts a text analysis of the Wall Street Journal (WSJ) column and finds that a pessimistic tone is associated with a subsequent decline in stock market stock prices and an increase in trading volume. Tetlock et al. (2008) analyze individual stocks through WSJ and Dow Jones News Service (DJNS) news articles. The negative tone of the news is associated with subsequent declines in company profits and stock prices, and shows the strongest predictive power when the news is about the company's intrinsic value. Li (2010) analyzes the management discussion and analysis (MD&A) section of the US 10-K report and finds that the tone of the text can predict future corporate earnings. Loughran and McDonald (2011) show that the text tone of annual reports predicts future stock prices and returns using their own financial sector-specific word lists. Buehlmaier and Whited (2018) measure the degree of financial constraint through the text of the company's annual report, and then show that the stronger the financial constraint, the higher the stock price return. In Korea, Kim and Joh (2019) analyze the return on the first day of an IPO (initial public offering) through the text tone of a securities issuance declaration.
As a study on the text of the analyst report, there is Huang et al. (2014). They find that the text of the US analyst report is significantly related to the return after the announcement even after controlling for the existing recommendation opinion, target price and earnings forecast. However, we did not verify the investment strategy using text information. Asquith et al. (2005) study the stock price response to changes in stock recommendations, target prices and earnings forecasts in analyst reports, and find that each provides unique information. In addition, they confirm that it is valuable as meaningful information when the analyst analyzes the text of the argument described to justify his or her opinion.
The second literature is on the information contents of analyst reports. A representative study on investment strategy using analyst report information is Barber et al. (2001). They report that analyst recommendations are useful information for investors in the US by reporting that a trading strategy of buying high-rated stocks and selling low-rated stocks according to analyst recommendations can yield meaningful returns of over 4% per year. Jegadeesh et al. (2004) study the relationship between the information effect of analyst investment opinions and corporate characteristics. The level of investment opinion at the analyst reporting date itself is found to have predictive power in value stocks and momentum stocks, and the predictability of the change of investment opinion shows that it is robust regardless of stock characteristics. Loh and Mian (2006) find that the higher the accuracy of an analyst's earning forecast, the greater the profitability of the recommendation, and they argue that the accuracy of the analyst's earning forecast is reflected in the quality of the recommendation.
There are a number of studies analyzing information power, focusing on the event when the analyst report is released, not an investment strategy. Stickel (1995) and Womack (1996) find that stock prices rise after an analyst recommendation is raised in the US market, and that stock prices fall when they fall. In terms of size, the downward case is larger and lasts longer than the upward case. There are studies that claim that the target price provided by analysts also has informational power. Brav and Lehavy (2003) show that there is a significant price response in relation to the change in target price. Bradshaw et al. (2013) find that there was a significant price response to the change in the analyst's target price, but find no significance for its persistence. In a comparative study on valuation methodologies for calculating target prices, Gleason et al. (2013) argue that valuation models such as the residual income model (RIM) are superior to P/E multiple methods.
In Korea, there are many studies on the information of analyst reports. Lee and Choi (2003) confirm that the analyst's change of recommendation has a significant relationship with the subsequent stock price, showing that this informational power is greater in the case of large brokerage houses. Kim and Eum (2006) show that stock prices significantly rise after analysts raise their target prices and fall significantly after they decline. Kim et al. (2007) show that investment strategy based on recommendation level (REC) is not superior to performance based on momentum strategy, but investment strategy based on changes in recommendation shows superiority. Kho and Kim (2007) find that the analyst's sell opinion persisted for up to 6 months after presentation, while the buy opinion is rather weak, with a significant negative return. The regression analysis also shows an opposite correlation between earning forecasting accuracy and actual profitability of stocks recommended to buy, and they interpret this phenomenon to be caused by the analyst's conflict of interest. Cha and Yoo (2010) analyze 1,088 analyst reports of 405 companies from 2001 to 2006, and show they provide useful information. Kim et al. (2011) show that the average stock price actually reaches the target price is 37%, and based on this, they report that the target price tends to be presented optimistically. In addition, analysts who accurately predict the target price in the past have the ability to continuously predict the accurate target price. Kim and Park (2012) find that the information power of analyst reports decreases in firms with high analyst activity levels and increases in firms with low analyst activity levels. Kim (2012) measures the information power of an analyst's report by the abnormal market return on the report disclosure date, and analyzes its determinants. Information power decreased as the number of analyst reports increases, and increases as the stake ratio, transaction volume and stock price disparity ratio of small investors increases.
4. Research design for investment strategy
4.1 Textual analysis to measure the analyst's textual opinions
To measure textual opinion of analyst reports, I apply lexicon approach using KOSELF that classify Korean words into positive and negative categories (Cho et al., 2021, 2022) [2]. The KOSELF, which only contains unigram phrases in Cho et al. (2021), is improved to include the bigram phrases in Cho et al. (2022). Additionally, I combine this improved version of KOSELF with Loughran and McDonald (2011) word list, which is the most popular financial dictionary. In appendix, construction procedure and top 15 word list of improved version of KOSELF are explained in detail. The KOSELF word list can be obtained from the following website. (https://sites.google.com/view/cheolwon-yang/koself?authuser=0).
To measure the opinion of each analyst report, the OPN of the analyst report is defined as follows by subtracting the negative word ratio from the positive word ratio.
where POS means the frequency of positive words found in the analyst report, and NEG means the frequency of negative words. After finding the number of corresponding negative and positive words by applying the improved KOSELF to each analyst report, the OPNs defined in Equation (1) are calculated. The OPN converts textual opinion included in the analyst report into a value ranging from − 1(most negative) to +1(most positive). If OPN is greater than 0, the analyst report has a positive tone, and a higher number means a stronger positive tone. Conversely, as OPN is smaller than 0 and the value is larger, it indicates a stronger negative tone. To remove the effect of the report text size, the sum of the number of negative and positive words is used as the denominator and standardized.
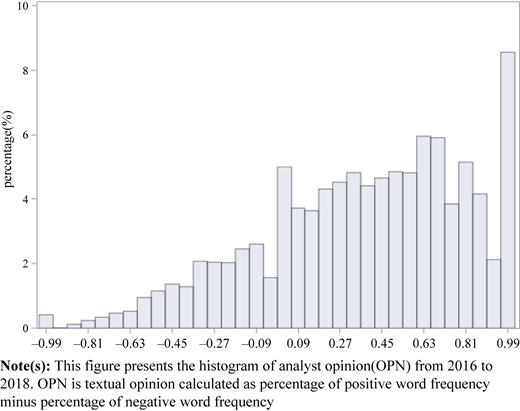
Table 3 reports the summary statistics of textual opinion (OPN). Panel A reports distribution of OPN. The average of OPN is 0.36 and standard deviation is 0.44. The 1st quartile is 0.06, median is 0.42 and the 3rd quartile is 0.71, which means the distribution is skewed to the left. There is no significant difference when compared by year.
Figure 1 shows the histogram of OPN from the analyst reports. This figure represents more detailed OPN distributions suggested by Panel A of Table 3. Around the zero value the positive values are more distributed than the negative ones. The distribution increases rapidly at 1 value. The number of 1 value is overwhelmingly large, and for this reason, the distribution is skewed to the left.
Overall, it is consistent with the findings of previous studies of analyst reports that positive opinions outnumber negative opinions. However, considering that the buy recommendation is over 90% and the underweight and sell recommendation is 0.9% in Table 1, the OPN seems to capture much more negative opinions of analysts compared to recommendation.
Panel B of Table 3 describes how textual opinions related to the quantitative summary measures, such as RECs, firm size, book-to-market ratio and trading volume. The correlation coefficient between OPN and REC is 0.181, which is statistically significant. Although the absolute value itself is not very high, it shows that there is a positive correlation. OPN has a negative correlation with firm size, book-to-market ratio (BM) and trading volume.
4.2 Performance of investment strategy using textual opinion
Is it possible to get a meaningful return by investing according to the textual information of the analyst report? If so, how much is the return? To verify this, I employ two investment strategies. The first is an event-driven investment strategy. After analyst report is disclosed, investor can trade stocks according to analyst's opinion. This is rudimentary strategy using disclosure events. I examine the return around the disclosure of analyst reports. I measure CARs for various days relative to the report disclosure date. Abnormal return (AR) is the difference between a firm's daily return and the KOSPI market index.
However, it has a disadvantage of implementing it as an actual investment strategy because it depends on the date of the event. To overcome this, the second investment strategy of portfolio construction is introduced. Investment portfolio is constructed using the method proposed by Barber et al. (2001). This method has an advantage in that it presents the return that can be obtained from actual investment by constructing a calendar-time based portfolio originally using the recommendations of analyst reports. In this paper, I use a textual opinion (OPN) instead of a recommendation to implement the investment strategy.
First, I compute a daily consensus of analyst text opinions for each company. That is, for stock i, the consensus of the analysts' textual opinions on day t−1 is defined as the average value of the OPN of each analyst.
where is the number of analysts who gave an opinion on stock i on day t−1, and is the textual opinion(OPN) of analyst j who gave an opinion on firm i on day t−1.
Second, I construct 5 or 3 portfolios based on each firm's analyst textual opinion () on day t−1. Portfolios are rebalanced every day. The return on each portfolio can be calculated as follows:
where is the return on day t of the stock i, is the number of stocks included in portfolio p on day t−1, and is the portfolio weight of stocks included in portfolio p on day t−1. It is obtained by equal weighting method using 1/ or value weighting method dividing the market capitalization of the stock by the sum of the market capitalizations of all stocks included in the portfolio. Equally-weighted portfolio is reported in the main empirical results and value-weighted portfolio is examined in the robustness check later. This will allow you to construct 5 portfolios per day based on the analyst's textual comments. In addition to this, a hedged portfolio where short the portfolio with the lowest textual opinion and buy the one with the highest is constructed.
For performance evaluation, the risk of each portfolio must be adjusted. In this study, Jensen's alpha concept is used. The following three types of factor models are used as benchmarks.
First, the one-factor model uses the market's excess return (Market) as a dependent variable.
Second, Fama and French (1993) three-factor model adds the small-cap stocks-large stocks (SMB) and value stocks-growth stocks (HML) to the market excess return (Market). Each explanatory variable represents a size premium and a value premium.
Third, Fama and French (2015) five-factor model adds profitability and investment factors, in addition to the above three factors.
where Rp,t is the excess return of the portfolio p on day t, Markett is the KOSPI excess return on day t, SMBt is the return of the firm size factor on day t, HMLt is the return of the book value market factor on day t, RMWt is the difference between the returns on diversified portfolios of stocks with robust and weak profitability, CMAt is the difference between the returns on diversified portfolios of the stocks of low and high investment firms, which we call conservative and aggressive.
The variable of interest in performance evaluation is , which is called Jensen's alpha. Jensen's alpha means the excess return excluding the part explained by the risk premium. If this value has statistical significance and has a positive (+) value, it can be interpreted as having a significant performance even after considering the risk.
5. Empirical results
5.1 Cumulative abnormal returns (CARs) around the disclosure of analyst reports
In this section, I examine the return around the disclosure of analyst reports by measuring CARs. AR is the difference between a firm's daily return and the KOSPI market index. I check various days relative to the report disclosure date. I employ the 2nd, 4th and 10th trading days after the report is published. These are denoted by CAR(0,2), CAR(0,4) and CAR(0,10), respectively. Considering that the investor obtains and interprets the report and uses it as an actual investment strategy, it is impossible to realize the return on the announcement date. Therefore, the CARs of 2nd, 4th and 10th trading days excluding the report disclosure date are examined again. These are denoted as CAR(1,2), CAR(1,4) and CAR(1,10), respectively.
Table 4 shows the results of CARs. In Panel A, the entire sample is divided into 5 groups according to the textual opinion of the analyst report and marked from 1 (Low) to 5 (High). CAR (0,2) shows that market reaction in the low OPN quintile is negative (−0.814%) and high OPN quintile is positive(0.655%). The difference of CARs between the high and low quintile is 1.469% (t-value = 11.99), which is statically significant. This result shows that the textual opinion of analyst reports contains significant information. This phenomenon is also found in the CAR (0,4) and CAR(0,10). The differences of CARs are 1.322% (t-value = 9.22) and 1.303% (t-value = 6.71), respectively.
CAR (1,2), which excludes the report disclosure date, is 0.350%(t-value = 3.89) and statically significant. The magnitude of the return has been reduced to one-fifth of CAR (0,2), and it shows that most of the analyst information is reflected on the day of the disclosure. CAR (1,4) is marginally significant at 0.203%(t-value = 1.66), but CAR (1,10) is not significant at 0.185% (t-value = 1.02). The significant returns can be obtained in the short term even if the day of disclosure is excluded. This result in Table 4 indicates the textual information implied in the body of the reports contains economically significant value.
In Panel B, the sample is divided into 3 groups by the change of the textual opinion (ΔOPN). CAR (0,2) with negative ΔOPN is − 0.162% and positive ΔOPN is +0.449%. The difference of 0.611% (t-value = 7.66) is statically significant. Significance is also found in the CAR (0,4) and CAR(0,10). This result shows that the change of textual opinion of analyst reports also contains significant information. CAR (1,2) is 0.219%(t-value = 3.77), and its magnitude is about one-third of CAR (0,2). CAR (1,4) and CAR (1,10) are also significant. The significance of CARs from OPN change is maintained over a longer period than OPN itself.
5.2 Portfolio returns using analysts' textual opinions
The basic topic of this study is how much meaningful return can be generated by investing stocks according to textual opinion of analyst reports. To verify this, investment portfolios are constructed using the method proposed by Barber et al. (2001). This makes it is possible to statistically judge whether the investor can benefit from the analyst textual opinion.
Following the methodology introduced in the previous section, I construct quintile (tercile) portfolios by sorting stocks by analysts' textual opinion (OPN) of the previous day. Equally weighted portfolio returns are calculated and portfolios are rebalanced every day. Table 5 shows the portfolio returns sorted by OPN level. The table reports five types of returns: raw return, market-adjusted return, alpha from CAPM (capital asset pricing model), alpha from 3 factor model, and alpha from 5 factor model. Market-adjusted return is the stock's daily return minus the KOSPI return.
Panel A of Table 5 shows the result of quintile portfolio returns. OPN is converted as five groups, indicating 1 for OPN<0, 2 for 0=<OPN<0.2, 3 for 0.2=<OPN<0.4, 4 for 0.4=<OPN<0.6, 5 for 0.6=<OPN<1, respectively. The return on portfolio 1(Low OPN) is 0.007% and the return on portfolio 5(High OPN) is 0.020%, showing a tendency to increase as the return goes from portfolio 1 to portfolio 5. There is no statistically significant portfolio among the five portfolios. The High-Low hedged portfolio return is 0.018% (t-value = 0.69), but it is also not statistically significant.
Considering risk-adjusted returns, Jensen's alpha returns in portfolios 1 to 3 are all negative (−), while the returns in portfolio 4 to 5 are all positive (+), showing a clear contrast. Overall, stocks with positive analyst opinions tend to have higher returns. However, it is disappointing that it does not have statistical significance.
Panel B of Table 5 shows the result of tercile portfolio returns. OPN is converted as three groups, indicating 1 for OPN<0, 2 for 0=<OPN<0.4, 3 for 0.3=<OPN<1, respectively. The return on portfolio 1(Low) and portfolio 3(High) is similar to that of quintile portfolios. The High-Low hedged portfolio return of 0.024% (t-value = 1.00) is positive, but not statistically significant. Jensen's alpha returns in portfolios 1–2(Low) are all negative (−), while the returns in portfolio 3(High) are all positive (+). However, it does not have statistical significance. When opinion level variable (OPN) is used, portfolio returns have increasing pattern according to opinion level, but they do not guarantee the statistical significance.
Next, I examine the portfolio returns from the opinion change (ΔOPN) rather than the opinion level (OPN). In case of recommendation, it is known that recommendation change have more informativeness than the REC (Jegadeesh et al., 2004). However, recommendation has a disadvantage that it is difficult to use as a portfolio investment strategy due to the rare event itself (especially in the case of a sell recommendation). On the other hand, the opinion from analyst report text capture more diverse views of analysts and the opinion change (ΔOPN) also do the detailed change of analyst views.
Table 6 shows the return of the portfolio composed by analysts' opinion change. Stock is assigned into three groups, indicating the Low stocks (1) for ΔOPN<0, the High stocks(3) for ΔOPN> 0, and 2 for otherwise. The equally weighted portfolio returns are calculated. The return on portfolio 1(Low) is −0.040% and the return on portfolio 3(High) is 0.069%, showing a tendency to increase as the return goes from portfolio 1 to portfolio 3. The High-Low hedged portfolio return is 0.117% (t-value = 2.16), and it is also statistically significant. Considering risk-adjusted returns, Jensen's alpha returns in hedged portfolios are all positive and statistically significant.
Since this trading strategy involves daily rebalancing, hedged return of 11.7 basis points per day (2.57% per month) may be substantially reduced once appropriate trading costs are taken into account. Explicit round-trip transaction costs including brokerage commission and securities transaction tax is 0.33%, and implicit transaction costs reflected in percentage bid-ask spread is about 0.97% on average in Korea. The short selling commission fee is about 2.5% per year for individuals. Taking all of this into account, the total transaction cost of buying and selling amounts to about 1.31%. Considering this level of transaction cost, a large portion of the excess return is deducted, and it is not easy to actually obtain a significant excess return in the market. It can be interpreted that the Korean market is efficient to that extent.
5.3 Further consideration and robustness check
In the previous, investment strategy using the change the analyst's opinion brings about meaningful returns. Here, I will cover some practical factors that should be considered in investment strategy.
5.3.1 Open-to-open return
Various attempts can be made for a more viable investment strategy. Originally, I use the daily return obtained from the closing price to verify the portfolio return. This assumes that the portfolio is rebalanced at the closing price on the day the analyst report is disclosed. Investors should implement the text analysis on analyst report and rebalance portfolio at the closing price of the day. However, it is not easy to complete both by the closing time of the same day. An alternative to this is to analyze the day's report overnight and then rebalance the portfolio at open price in the following day. This will be much easier to implement. In this case, we need to use the open-to-open return.
Table 7 shows the results from the open-to-open return. Stock is assigned into three groups, indicating the Low portfolio stocks(1) for ΔOPN<0, the High portfolio stocks (3) for ΔOPN> 0, and 2 for otherwise. The return on portfolio 1(Low) is −0.094% and the return on portfolio 3(High) is 0.067%. The High-Low return is 0.163% (t-value = 2.83), and it is also statistically significant. Considering risk-adjusted returns, Jensen's alpha returns in High-Low portfolios are all positive and statistically significant.
The return of the open-time rebalancing strategy of 16.3 basis points per day (3.59% per month) is greater than the return of the close-time rebalancing strategy of 11.7 basis points per day (2.57% per month). I conclude that rebalancing at the open price the day after the analyst report disclosure is a much better method than rebalancing at the closing price on the same day, since it not only gives higher performance but also provides sufficient time for analysis.
5.3.2 Rebalancing frequency
In the analysis, daily OPNs and daily returns are used. This means that the rebalancing of the portfolio occurs daily. However, daily portfolio rebalancing is expensive due to transaction cost. We can delay the use of information. Weekly adjustments may be more feasible. As an alternative of daily rebalancing, weekly rebalancing portfolio is examined. The analyst opinion for a week is defined as an average of the opinion value of that week, and portfolios are constructed according to change in opinion. Equally weighted weekly returns are calculated and rebalanced every week.
Table 8 reports both the close-to-close return and the open-to-open return. If the closing price is used, the rebalancing is implemented at the Friday closing price. If the open price is used, the rebalancing transaction should be completed on the Monday opening time of the following week. In this case, investors have more spare time to complete the analysis on the analyst report over the weekend.
Table 8 shows that the weekly rebalancing investment strategy does not give meaningful returns. In case of the close-to-close return, the High-Low return is 0.064% (t-value = 0.66), and it is not statistically significant. Considering the open-to-open return, the hedged return is 0.093% (t-value = 0.84), and it is also not statistically significant. Delayed use of analyst report information has undesirable consequences. The previous results of CAR in Table 3 also show that the informational power of analyst reports disappears after 4 days. Weekly rebalancing is too late to use this information.
5.3.3 Recommendation and opinion
In this section, I investigate other information in the analyst report. By using the recommendation, the investment strategy of Barber et al. (2001) is implemented. Stock is assigned into three groups, indicating the Sell portfolio for REC<3, the Neutral for 3 ≤ REC<4, and the Buy for REC ≥ 4.
Table 9 shows that the market-adjusted return on Sell portfolio is −0.018% and the return on Buy portfolio is −0.009%. The return of Buy-Sell portfolio is 0.063% and not statistically significant with t-value = 0.32. The result in Table 9, unlike the US, it does not show a significant return [3]. The return of Buy-Neutral portfolio is −0.036%(t-value = −2.03), which is the opposite of our expectation.
For more detail analysis, the neutral and buy ratings, which account for the largest portion, are further divided into three portfolios according to the textual opinion change (ΔOPN). The High-Low return in Buy recommendation is statistically significant with 0.200%(t-value = 3.10). In contrast, the Buy-Neutral portfolios within ΔOPN are insignificant or in the opposite direction to our prediction. This shows that textual opinion is more useful than recommendation in investment strategy. This poor result of the recommendation comes from two limitations. First, recommendations do not reflect detailed opinions because they are limited to a few grades. Second, most of the recommendations are biased towards neutral and buy.
5.3.4 Robustness check
Two robustness checks are performed. First, alternative opinion measure, OPN_all is used. Unlike OPN, OPN_all uses the length of the analyst report as the denominator. This is to improve the shortcomings of OPN. If the number of positive and negative words in the OPN is small, there is a possibility that the measure will be overestimated.
Panel A of Table 10 shows that the result is not much different from that of the OPN in the main text. Stock is assigned into three groups, indicating the Low stocks(1) for ΔOPN_all<0, the High stocks(3) for ΔOPN_all> 0, and 2 for otherwise. The return on portfolio 1(Low) is −0.039% and the return on portfolio 3(High) is 0.091%. The High-Low return is 0.127% (t-value = 2.04), and it is statistically significant. Considering risk-adjusted returns, Jensen's alpha returns in High-Low portfolios are all positive and statistically significant.
Second, the equally weighted portfolio return is changed to value-weighted average. The value-weighted portfolio return is computed using the market capitalization as of the end of the previous month. Panel B of Table 10 shows that the results do not have significant returns. The high-low return is 0.092% (t-value = 1.39), and it is not statistically significant. Considering risk-adjusted returns, Jensen's alpha returns in High-Low portfolios are all not significant. This means that significant results when using equal-weighted average returns are mainly influenced by small-cap firms. This is in line with previous studies that the information in the analyst report is more valuable in small companies with large information asymmetry (Kim and Park, 2012).
The information provided by analyst reports is diverse, including recommendations and target prices, in addition to texts. Recommendations have the strongest informational power, but they have limitations in that they are limited to a small number of grades and that changes are rare. This paper can supplement the shortcomings of the recommendation by using the OPN extracted from the analyst report text. Through various verifications, this paper confirms which information provided by analysts can be linked to actual investor returns.
6. Conclusion
Analyst reports contain diverse information about companies, such as recommendations, target prices, earnings forecast and text body. The text accounts for the largest portion in terms of volume, but has not been studied so far. The main goal of this study is to investigate the economic usefulness of the analyst report text. After measuring analyst opinion from analyst report text, the performance of investment strategies using this information is examined.
Analyst opinion about a firm is measured by calculating the frequency of positive and negative words in the report text through the KOSELF. To verify the usefulness of textual opinion, a calendar-time based portfolios based on the analysts' textual opinions are constructed and rebalanced every day. The results show that opinion change portfolio in Buy recommendation shows the highest return. The hedged portfolio return is 0.200% per day and statistically significant. This study shows the usefulness of the analysts' textual information beyond recommendation.
This paper has several limitations. In the results of this study, performance depends on the quality of sentiment lexicon. If a more accurate financial sentiment dictionary can be made, better results can be obtained. In addition, more advanced text analysis techniques such as using machine learning have been developed. This will have room for further improvement.
The author is grateful to Yunsung Eom (discussant) and seminar participants at the Korea Derivatives Association for their helpful comments. This paper is conducted by the academic research support of the Korean Derivatives Association in 2021 (Sponsored by Mirae-Asset Management).
Notes
For detailed research, please refer to the literature review section of this paper.
In the case of English, Loughran and McDonald (2011) shows the problem of using a general-purpose sentiment lexicon for financial analysis and built an English sentiment lexicon specialized for financial research. Cho et al. (2021) find the same problem in Korean as Loughran and McDonald (2011). They propose a Korean financial sentiment lexicon named KOSELF. This word list consists of 47 negative words and 48 positive words. The list of negative words includes words that have negative connotations in corporate financial analysis, such as decrease, decline, slump, downward, deficit, burden, shrink, slowdown, loss, deterioration, sale, delay, inevitable, reduction (감소, 하락, 부진, 하향, 적자, 부담, 축소, 둔화, 손실, 악화, 매각, 지연, 불가피, 절감). The list of affirmative words includes words such as profit, improvement, rise, enlargement, stability, recovery, attainment, attractiveness, securement, active, recommend, benefit, best, uptrend (이익, 개선, 상승, 확대, 안정, 회복, 달성, 매력, 확보, 적극, 추천, 수혜, 최고, 상승세).
In the case of change of recommendation, the occurrence date is too rare to form a daily portfolio.
References
Appendix
The positive and negative word list of improved version of KOSELF is constructed as following steps (Cho et al., 2022). The text of the analyst report goes through the following preprocessing process. First, all special characters, alphabetic characters and numbers existing in the text are removed. Next, the text in the analyst report is tokenized and sentences are separated into words and morphemes. For this purpose, Komoran (Korean morphological analyzer) morphological analysis module included in Korean Natural Language Processing in Python (KoNLPy), which is widely used as a morphological analyzer, is used. KoNLPy is a Python package developed for Korean information processing at Seoul National University (Park and Cho, 2014). It tokenizes sentences into morpheme units through morpheme analysis and calculates the parts of speech (noun, verb, verb, etc.). Finally, unigram and bigram tokens are matched with their original reports' recommendation revisions.
To distinguish all tokens into positive and negative words, I apply the following two conditions to all words in analyst reports (Cho et al., 2022). First, the document frequency for the token should be more than ten. It means that the positive (negative) token should be appear at least ten separate upgrade(downgrade) documents. Secondly, I calculate likelihood of the Naïve Bayesian statistics for each token. The Naïve Bayes method provides statistical relation between words and categories. Generally, this approach is used for the machine learning classification. But in this paper, we only take likelihood to compare specific word's probability on positive or negative dictionary. The likelihood of ith word is calculated as following:
where is ith word of analyst reports, is the conditional probability that the ith word belong to positive category, and is the conditional probability that the ith word belong to negative category.
According to the ratio of conditional probability, the words are assigned positive or negative word to the improved version of KOSELF. When > , the wordi appears more in upgrade reports, implying the more possibility of being positive words in KOSELF. In contrast, the wordi has the possibility of being negative word list in KOSELF when < .
Table A1 reports the 10 highest probability words for positive and negative category from the KOSELF. In Panel A of Table A1, the highest probability word is “recommendation upgrade”. The probability that word “recommendation upgrade” appears within the upgrade report sample is 0.13%, while the probability that the same word within the downgrade report sample is 0.01%.
Then the ratio between two probabilities is calculated, because the relative frequency of two categories (recommendation upgrade reports and downgrade reports) should be considered before constructing the lexicon. In an example of the word “recommendation upgrade”, the probability that the word appears in upgrade reports is about 18.1 times larger than that in the downgrade reports.
Similarly, the word “upward” appears 460 times more frequently in upgrade reports. But when considering the relative frequency, the conditional probability of word “upward” within upgrade reports is 0.56% while the probability within downgrade reports is 0.10%. The ratio between two probabilities becomes 5.4, which indicates the frequency is high in upgrade reports but it also comes up in the downgrade reports.
Panel B of Table A1 shows the negative words selected based on the same probabilistic method for the KOSELF. The highest word's probability contrast to downgrade and upgrade reports is “lower return”, where the ratio of the two probabilities is 269,279. This means that the word “lower return” is barely appears in upgrade report sample. The words such as “downward investment”, “downward”, “aftereffect”, “lower profit”, “decline quarter”, “raw material price”, “downward quarter”, “soaring prices” show similar pattern. The word “downgrade” was most frequently used (529 times) word among the listed words, and the probability of the word appearance is 10.7 times higher in downgrade reports compared to the upgrade reports.
Overall, the ratio of the probabilities in the last column of Panel B is higher than that of Panel A. This indicates that the analysts more likely to use positive words in both recommendation upgrade reports and downgrade reports, while negative words are rarely used in the upgrade reports.
Table A2 shows top 15 positive and negative words in the improved KOSELF captured by the analyst reports. The most frequently used positive word is “Improvement”, occupying 6.9% of total words. “Buy (3.5%)”, “Possible (3.3%)”, “Exceed (3.1%)”, “Upward (2.7%)”, “Stability (2.7%)” and “Recovery (2.6%)” also appear frequently as positive words. Among the negative word category, “Decrease” is the most frequently used word, accounting for 9.2% of total words. Next, the word “Depression” appears about 7.6%, surpassing the rate of the most frequent positive word “Improvement”. The word “Below (5.5%)”, “Downward (4.5%)”, “Loss (3.9%)”, “Temporary (3.2%)” appears more often than other negative words. The specific KOSELF word list is made public through the website. (https://sites.google.com/view/cheolwon-yang/koself?authuser=0).