This research investigates how subsidy programs in Vietnam's residential electricity market affect consumers' well-being.
Two perspectives are employed: cash transfer and quantity-based subsidy. The effectiveness of cash transfer is measured in three ways: benefit incidence, beneficiary incidence and materiality. The quantity-based subsidy is established under the increasing block rate pricing, with the first two block rates being lower than the marginal cost. To improve the quantity-based subsidy, the research examines the consumer surplus under four proposals.
The results show that both types of subsidies are ineffective in supporting the poor.
In order to achieve a more equal distribution among households, the subsidy program should remove all subsidized blocks and reflect the full marginal cost. Changes should be made to the price structure regarding both marginal price and intervals.
To mitigate the impact of the quantity-based subsidy, the government should improve the cash transfer by reducing extortion and improving targeting efficiency, especially for poor households living in rented houses.
This paper is the first to discuss the welfare effect of the electricity subsidy in Vietnam. First, it comprehensively evaluates the cash transfer subsidy in Vietnam. Second, it suggests a modification in the residential electricity tariff.
1. Introduction
The Vietnamese government has made significant efforts to improve electricity access and affordability for residential households. In the early 1990s, electricity was scarce, and the electrification rate was less than 50% (Asian Development Bank, 2011). However, within a decade, this rate grew to 77% by 2001, and in 2019, electrification reached 99.4%, higher than the world average of 90.1% (World Bank, n.d.). In terms of affordability, the government implemented interventions to keep the marginal cost for residential usage at VND1,622 per kWh, only covering 73% of the long-run marginal cost of VND2,100 per kWh (Asian Development Bank, 2016). This low cost has helped make the residential electricity tariff in Vietnam among the lowest in Southeast Asia and only higher than that of the Lao PDR and Myanmar (Poch and Tuy, 2012).
Despite the improvements in access and affordability, inequality in electricity consumption across households has become a concern. While households spend only 6% of their income on electricity bills, this rate has grown faster than income, which puts a great burden on poor households (Ha-Duong and Nguyen, 2021; Nguyen et al., 2019). As a result, the inequality in electricity expenditure is more severe than income inequality (Son and Yoon, 2020). To address this matter, authorities support poor households through two channels: cash transfer and quantity-based subsidy. For the first channel, they offer a fixed amount of VND50,000 per month to recognize poor households. For the second channel, they construct an increasing block rate tariff in which the first two block rates are below the marginal cost.
This study examines the residential electricity subsidy in Vietnam in terms of cash transfer and quantity-based subsidy. We evaluate the cash transfer performance from three perspectives: benefit incidence, beneficiary incidence and materiality, following Komives et al. (2005). About the quantity-based subsidy, we provide policy recommendations on the tariff to mitigate the inequality in electricity expenditure across households with various income levels. To do this, we analyze the consumer surplus change under four proposals. The first plan is the tariff proposed by Vietnam Electricity (EVN) in 2020, which was supposed to replace the existing tariff. The second plan widens the subsidized block interval to better capture poor households. The third plan inherits the spirit of the second plan but also extends the interval in the high block to compensate for the loss in the second plan. The final plan removes the subsidy in the first two blocks and adds the social cost of health and the environment to electricity production.
The analysis in this paper is derived from the 2015 Vietnam Household Registration Study (HRS) (World Bank, 2015). This survey collected responses from 5,000 households in Ha Noi, Ho Chi Minh, Binh Duong, Da Nang and Dak Nong. While many topics in the HRS overlapped with the Vietnam Household Living Standard Survey (VHLSS) (i.e. education, health care, employment, assets, housing, income, expenditure and social inclusion and social protection), the survey has two features that distinguish it from the VHLSS. First, it has a section for household registration procedures. Second, it focuses on temporary residents as this group accounts for 44% of the total sample.
Early studies on electricity in Vietnam mainly focused on the effect of rural electrification on households' characteristics, such as income or children's education (Asian Development Bank, 2011; Khandker et al., 2009). More recently, the focus has shifted to energy security, energy poverty and electricity inequality, as analyzed by Baulch et al. (2018), Dapice et al. (2022), Le et al. (2023), Nguyen et al. (2019) and Son and Yoon (2020). The performance of the electricity sector and consumer satisfaction have also been intensively studied (Ha-Duong and Nguyen, 2017, 2021). Other papers investigated the electricity demand function, focusing on finding the appropriate instrument variables to overcome the endogeneity. For example, Nguyen (2019) adopted previous analyses and chose the predicted quantity price as the instrument, or Le (2020) utilized the household registration system to establish unique instruments for Vietnam. This paper contributes to the existing literature by examining the effectiveness of cash subsidies and providing policy recommendations for a more equitable tariff system, filling a gap in the current research on electricity in Vietnam.
The remainder of this paper is organized as follows. Section 2 reviews the framework to examine the performance of cash transfer and its application to Vietnam. Section 3 describes the methodology to measure the welfare effect under different scenarios using the price elasticity of demand estimated in the demand function. Section 4 empirically estimates the demand function and measures the consumer welfare impact. Section 5 provides some key policy recommendations. Section 6 concludes the paper and proposes some topics for further research.
2. The analysis of cash transfer
2.1 The framework for assessing cash transfer
Cash transfer (cash subsidy) can be viewed as social assistance since the government guarantees poor households access to basic amenities. Following the framework of Komives et al. (2005), we assess the performance of the cash transfer in Vietnam in three dimensions: benefit incidence, beneficiary incidence and materiality. This framework has been widely used in subsidy evaluation of public utilities, such as electricity (McRae, 2015), water (Andres et al., 2019) or public transport (Serebrisky et al., 2009).
2.1.1 Benefit incidence
This dimension addresses the performance of a subsidy in covering the poor population. Specifically, it compares the ratio of the poor population receiving the subsidy to the proportion of the poor population in the whole population. It can also be interpreted as the average subsidy that a poor household receives to the average subsidy that a random household in the sample gets. To calculate this dimension, we use the targeting performance indicator Ω (see Equation (1)). A good value of Ω should be at least 1. For more clarification, suppose that 20% of the population is poor and they receive 20% of the total subsidy, Ω will be 1.
where is the value of the subsidy that poor households receive;
is the number of poor households;
is the value of the subsidy that all households receive;
is the total number of households.
2.1.2 Beneficiary incidence
Once the performance of the subsidy in covering the poor population is defined, its effectiveness in reaching eligible households is evaluated. To measure this beneficiary incidence, we use two indicators: exclusion errors (proportion of poor households excluded from the subsidy) and the percentage of beneficiaries in each income quintile.
2.1.3 Materiality
The subsidy's size relative to household income is investigated by examining the percentage of the subsidy's value over the average income of poor households.
2.2 The performance of cash transfer in Vietnam
2.2.1 An overview of cash transfer and beneficiaries in Vietnam
The Vietnamese government provides a monthly lump sum cash subsidy of VND50,000 to registered poor households as electricity support (EVN, 2016). Eligibility requires the person to obtain permanent residence status in their house and has a monthly income below VND1,100,000 (rural) or VND1,300,000 (urban).
Beneficiaries are assessed in three categories: households below the poverty threshold, households recognized as poor and listed as such and households recognized poor households receiving the subsidy. The absolute values are 735, 145 and 87 households, respectively. When converted to percentages, 15.51% of the total households were poor, of which only 19.62% were recognized by authorities. Finally, among those recognized as poor households, only 60% received the subsidy. These low rates indicate the Vietnamese authorities' ineffectiveness in targeting and reaching the poor within the community.
2.2.2 The performance of cash transfer in Vietnam
2.2.2.1 Benefit incidence
We calculated the targeting performance for poor households, regardless of their record in the poor list, and obtained a value of Ω = 0.262 (Equation (1)). This result suggests that the cash transfer program in Vietnam has not progressed well as the subsidy does not fully cover the poor population.
2.2.2.2 Beneficiary incidence
Our calculations show that the errors of exclusion in Vietnam are significantly high, with 87.47% of the poor households not receiving the subsidy. When considering the recognized poor households, 40.28% did not receive the subsidy. Regarding the distribution across the income quintiles, the first quintile revealed the highest proportion of those receiving the subsidy (10.47%), but the other quintiles also had beneficiaries (i.e. 2nd quintile: 2.67%; 3rd quintile: 1.17%; 4th quintile: 0.77%), even in the highest quintile (5th quintile: 0.74%).
2.2.2.3 Materiality
The electricity subsidy, equivalent to VND50,000, equals about 1.27% of a poor household's average income (VND3,491,905). The size of the subsidy is extremely small; therefore, its contribution to the cost-of-living mitigation of a poor household is limited.
In summary, cash transfer performance in Vietnam is inefficient from three perspectives. Benefit incidence shows that the subsidy's value does not cover the entire poor population. Beneficiary incidence indicates a low proportion of poor households receiving the subsidy and high leakage to the ineligible. Moreover, materiality reveals that the subsidy's value is insignificant relative to income, rendering it ineffective in supporting the poor.
3. An overview of the quantity-based subsidy
3.1 The increasing block-rate tariff
The block-rate tariff charges different marginal prices for different blocks of consumption. Equation (2) demonstrates the marginal price in a block-rate tariff structure, in which is the marginal price of block , is the quantity consumed and are the thresholds. If , it denotes an increasing block-rate tariff. In contrast, denotes a decreasing block-rate tariff.
The increasing block-rate tariff is a quantity-based subsidy as the marginal prices for the first blocks are lower than the marginal cost. It assumes that poor households consume within the subsidized blocks, which are below the average of middle- and high-income households. The main advantage of this tariff is that it guarantees all households access to a certain quantity of utility (Komives et al., 2005).
In Vietnam, the first two blocks of the residential electricity tariff (up to 100 kWh) are subsidized, with marginal prices lower than the retail electricity marginal cost of VND1,622.01 per kWh (see Table 1). Approximately 46.05% of poor households absorbed the entire subsidy since their consumption was below 100 kWh.
3.2 The baseline model specification
A standard residential electricity demand function, shown in Equation (3), includes the price of electricity, household income, the price of electricity substitutes and the temperature (Narayan and Smyth, 2005). The expected signs for all the variables except for the price are positive.
where is the natural log of quantity consumed;
is the natural log of income;
is the natural log of price;
is the natural log of the price of substitute energy;
is the natural log of weather;
is the error term and is assumed to be normally distributed, which is .
The model in this study followed the standard model shown in Equation (3) with modifications in the natural log of substitute energy, the natural log of weather and sets of households and area-specific variables:
3.2.1 Natural log of price
The type of price chosen is one of the most critical questions in studying the block-rate tariff (Hewitt and Hanemann, 1995); however, no concrete answer has been given. Early studies in the 1970s, inspired by Howe and Linaweaver (1967), used marginal price. However, since Taylor (1975) and Nordin (1976) were published, the price choice was the marginal price and an additional variable that reflected the lump sum transfers in the block-rate tariff structure.
While marginal pricing is commonly used to analyze block-rate tariffs, it unrealistically assumes that consumers fully comprehend the marginal price when consuming the product. Ito (2014) found that consumers do not seem to respond to marginal or expected marginal prices but to the average price. Shin (1985) showed that the average price should be calculated from the bill, not the average of all marginal prices the consumers face.
This study used the average price derived from the electricity bill instead of the marginal price, based on the work of Ito (2014) and Shin (1985). In Vietnam, there are two price systems: the official block-rate tariff regulated by the EVN and the unofficial flat price that depends on landlords. According to the World Bank and Vietnam Academy of Social Sciences (2016), the average price of the unofficial flat price system is VND2,884, higher than the final block tariff in the official system.
3.2.2 Natural log of quantity
Unfortunately, the quantity of electricity consumed was not reported in the survey; therefore, it would be derived from the electricity bill. Regarding the households that pay the flat price, the quantity is simply the division of the expenditure by the flat price (VND2,884). For households that are subject to the block-rate tariff, the quantity is calculated using Equation (6), in which Q denotes the quantity consumed and indicate the marginal price with respect to the block.
3.2.3 Natural log of income
The total income was not reported in the survey, but the wage and non-wage incomes are available. Therefore, the income is calculated from the sum of these two components. The wage income is the monthly salary of household members who work in organizations. The non-wage income comprises non-agriculture business; asset leasing; agriculture, forestry and fisheries; remittances; loan interest; capital contribution and other income.
3.2.4 Natural log of price of substitutes
Electricity is reasonably assumed to be substituted in cooking and lighting. Hence, close substitutes (gasoline and other fuels, including oil, wood and coal) were examined. Since the demand for these types of energy is inelastic (Espey, 1998; Labandeira et al., 2017; Havranek et al., 2012), it is feasible to use the expenditure for these types of fuels as an approximation of the price of substitutes.
3.2.5 Households – related variables
Household-specific characteristics are examined, including the number of household members, house size and a list of dummy variables reflecting whether a household owns electric appliances.
3.2.6 Area-related variables
The area-related variables include the indicators of areas (urban/rural) and the province in which the house is located. Since the data were collected in five provinces, these variables also capture the effect of temperature.
3.3 The choice of the econometric model
The residential electricity demand function (4) follows the standard demand model, in which quantity is the function of price. However, economic theory also demonstrates the impact of quantity on price. Hence, the problem of simultaneity arises. Since price and quantity are jointly determined, the ordinary least squares (OLS) regression would lead to biased and inconsistent estimation (Hill et al., 2018; Wooldridge, 2013).
Two econometric models are usually applied to tackle this issue. The first is the discrete/continuous choice with a two-error model, which applies specifically to the block-rate tariff. This model was first proposed in studying the impact of the tax rate on labor supply (Burtless and Hausman, 1978) and was then widely used in the demand function of water block-rate pricing (Hewitt and Hanemann, 1995; Rietveld et al., 2000). This model assumes that the demand function is linear within a block but is kinked when moving from one block to another.
The second model is the instrument variables with two-stage least squares (IV/2SLS) estimation. This model does not separate the specific problem of the block-rate tariff from the typical joint determination in the demand function but treats them as the general problem of endogeneity. In utility demand studies, this model is often used in research on electricity (Halvorsen, 1976; Taylor, 1975).
This study applied the IV/2SLS model to address endogeneity for two reasons: First, it follows previous papers examining the electricity demand function. Second, it has also been used in articles on Vietnam's retail electricity demand function (Ha-Duong and Nguyen, 2017; Le, 2020). To estimate the IV/2SLS model, instrument variables are compulsory.
3.4 The choice of instrument variables
A good instrument variable must theoretically satisfy three conditions. First, it must not directly affect the outcome variables, and therefore, it must not appear as an explanatory variable. Second, it must not correlate with the error term or, in other words, any unobservable factors that explain the outcome variables. Finally, it must correlate with the endogenous variable.
This study applied the choice of instrument variables from Le (2020), which was explicitly defined for Vietnam. These are “the company/person to whom the household pays the electricity bill” and “the residence status.” As a requirement of relevant instrument variables, they should affect only the electricity price. Moreover, they should neither associate with the electricity quantity nor correlate with any unobserved factors in the model (4).
3.4.1 The person to whom the household pays the electricity bill
As mentioned earlier, households that pay EVN directly are subject to the block-rate tariff, while those that pay landlords are more likely to pay the flat price. The HRS shows that all households that pay the bill to landlords pay the flat price.
3.4.2 Residence status
The Law on Residence of Vietnam states that an individual's residence status is granted in the property owned by this person or their parents. Rental property is also accepted in very limited circumstances, constrained by a formal agreement between the renter and the landlord (The National Embassy, 2020). As a result, temporary residents are more likely to live in a rental house and thus be subject to a flat price. In contrast, permanent residents live in their own houses and pay the block-rate price. From the HRS, out of the households that pay the flat price, only 1.86% are permanent residents; the remaining are temporary residents.
3.5 Consumer welfare effect measurement
Consumer surplus has been widely used in studying the welfare effect despite being controversial (Cohen et al., 2016; Hausman, 1981; Kim, 1997). This study adopted the welfare effect under reforms by measuring the change in the consumer surplus. This approach was also used by BuShehri and Wohlgenant (2012), who studied the welfare effect in Kuwait under the reform in residential electricity.
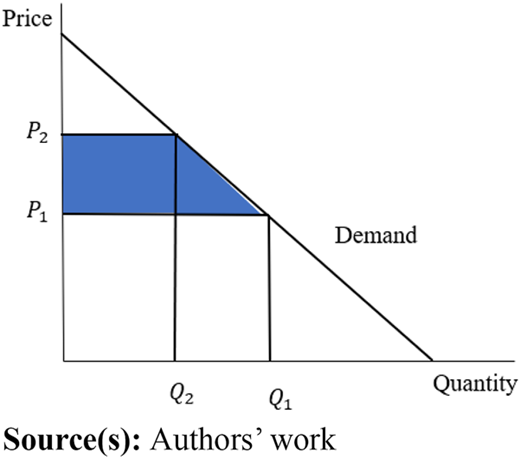
Figure 1 illustrates the example of consumer surplus loss in the case of price increases. When the price increases from to , the quantity demand decreases from to . As a result, the consumer surplus loss will be the area of the blue trapezoid, which is
The quantity changed in this study was calculated through the price elasticity of demand. This indicator illustrates the percentage change in the quantity demanded when there is a 1% change in the price. Since the demand function is the log-log form, the estimate for the price ( is also the elasticity.
To establish the consumer welfare effect, three assumptions are made:
The demand function is linear: This can be achieved because, as indicated above, consumers react to the average price instead of the (expected) marginal price.
Any change in the threshold is equivalent to a change in price; thus, the equilibrium moves along the curve, but the curve itself remains unchanged.
Consumers maintain their level of consumption when the new price structure is announced but will adapt consumption when they receive the bill.
Under these three assumptions, the consumer surplus change for one household was calculated as follows: Whenever there is a change in the price, consumers do not change the quantity consumed immediately. However, when they receive their bills, they will evaluate the new average price (derived from the bill) with the old average price and modify the quantity consumed. The new quantity will be calculated using the price elasticity of demand. This quantity is the final quantity . Once the quantity has been calculated, the expenditure will be re-calculated, and the average price will be re-computed because the price should be derived from the bill. This is the final price (. After calculating the consumer surplus change for each household, the total welfare effect can then be calculated by the sum of the consumer surplus change in the corresponding groups.
4. Result estimation
4.1 Descriptive statistics
We used the full sample to estimate the demand function. For the analysis of the consumer surplus, we divided our sample into three sub-samples based on income levels: low-, middle- and high-income households. Specifically, low-income households refer to poor households, which we defined in Section 2. Hence, the terms low-income and poor households can be used interchangeably. There are two reasons for this: first, we want to avoid confusion, and second, as poor households account for 18.36% of our sample, it is not much different from the usual 20% threshold. Our high-income households are in the fifth quintile of household incomes, commonly used in reports by Vietnamese authorities (e.g. GSO, 2019). The remaining households are classified as middle-income households.
Table 2 presents means and standard deviations for some important variables in model (4). On average, low-income households use 154.05 kWh per month, while middle- and high-income households consume more with 213.62 kWh and 240.36 kWh, respectively. The average electricity price and expenditure follow this pattern as well. Regarding households' incomes, the mean value of high-income households is three times higher than that of middle-income households and nine times higher than that of low-income households. Additionally, more than half of the sample live in urban areas.
4.2 Model estimation
Table 3 shows the estimations from the OLS and the IV/2SLS results. Under the IV/2SLS model, key variables have expected signs and are statistically significant. The coefficient for the electricity price (the elasticity of demand) is , which indicates that, on average, holding other variables constant, a 1% increase in price leads to a decrease in the quantity demanded by . The absolute value of elasticity greater than 1 shows that the electricity quantity demanded is sensitive to the change in price. Moreover, the demand change with respect to income is inelastic since its elasticity is less than 1. This finding is consistent with Bose and Shukla (1999), Csereklyei (2020) and Holtedahl and Joutz (2004), who also found that residential electricity demand is income-inelastic for the US, India, Taiwan, Organisation for Economic Co-operation and Development (OECD) countries and the European Union nations.
Standard hypothesis tests in an IV/2SLS model are examined in Table 3. The Wu–Hausman test for endogeneity concluded that the model was endogenous. Different tests to explore the strength of the instrument variables were also conducted. The results from the weak instrument test and the instrument validity test (the Sargan test) indicated that at a 5% significance level, both instrument variables were strongly and jointly valid.
4.3 The welfare effect under four proposals
4.3.1 An overview of the four proposals
This section introduces the four proposals for measuring the welfare effect: one proposal by EVN and three by the authors.
4.3.1.1 Proposal 1
In 2020, EVN proposed a new price structure to the Ministry of Industry and Trade (MOIT) to replace the existing one, which had been in use since 2015. Under the new plan, the number of blocks was reduced from 6 to 5. The marginal price was also increased to reflect the increase in the retail marginal cost, from VND1,622.01 per kWh to VND1,864.44 per kWh (Ngọc Linh, 2020). The new price structure is shown in Table 4 (panel A) along with the proportion to the marginal cost and the marginal price when inflation is excluded. Under the new structure, only the first block is subsidized. Moreover, if inflation is considered, the 2020 price, on average, is only 1% higher than the 2015 price. Therefore, the new price structure can be viewed as redistributing welfare but not as gaining producer surplus.
4.3.1.2 Proposal 2
This proposal modifies the interval of the 2015 price structure in order to subsidize the average electricity quantity consumed by poor households. Currently, a poor household consumes 154.05 kWh per month, while the figure for a non-poor household is 200 kWh. In addition, the proportion of poor households whose consumption falls under the subsidized blocks is 46.05%. If the subsidized block is extended from 100 to 150 kWh, 60.5% of poor households will be fully covered. This study chose the new threshold as 150 kWh instead of 155 kWh since 150 is a rounding number. Also, if 155 kWh is chosen instead of 150 kWh, the percentage of poor households that are fully subsidized rises by only 0.82%, which is negligible. Table 4 (panel B) summarizes the new structure of the tariff.
4.3.1.3 Proposal 3
Proposal 3 is an extension of proposal 2 in the sense that the interval for block 4 is narrowed to 201–250 kWh to cover part of the loss from increasing the subsidized interval. The threshold chosen is 250 kWh since the average electricity usage of a high-income household in Vietnam is 240 kWh. Table 4 (panel C) summarizes the new tariff structure of this proposal.
4.3.1.4 Proposal 4
Proposal 4 sets the marginal price for the first two blocks equal to the marginal cost. As a result, the number of blocks decreases from 6 to 5. The subsidy is removed, but consumers still receive benefits since they do not pay the markup for their first block consumption. Besides markup elimination, this proposal also captures the negative externalities of electricity production on health and the environment. According to Biegler (2009), the social cost of electricity production is the combination of different costs from different sources. This study adopted the cost structure from Biegler (2009) with a modification to the 2015 price. Regarding the cost structure for Vietnam, data from the International Energy Agency (2021) were used. In sum, the external cost of electricity production in Vietnam is VND336 per kWh, which brings the marginal cost to VND1,958 per kWh. Table 4 (panel D) summarizes the new tariff reflecting the changes in subsidy and the marginal cost.
4.3.2 Results of the welfare effect under the four proposals
The welfare effect measures the performance of the four proposals compared to the original tariff. Table 4 (panel E) shows the revenue and the profit changes of EVN in the four proposals. In general, all proposals except proposal 4 reduce the revenue as well as the profit of EVN, with the greatest loss coming from proposal 1, which EVN offered.
Table 5 explores the percentage change in price (considering inflation) of the four proposals. Generally, the tariff was designed as a higher quantity consumed faced a higher marginal price. Regarding proposal 1, the price structure is not optimal because the decrease in the marginal price for the lower intervals is small. Furthermore, the price for the interval (201, 300) falls sharply, even though it is considered as high consumption (the average usage of a non-poor household is around 200 kWh).
The consumer welfare effect is shown in Table 5. Overall, all proposals except proposal 4 increase the consumer surplus, in which the largest increase is from proposal 1 and the smallest increase is from proposal 3. Regarding the first three proposals, while they improve the welfare for consumers, the benefit is distributed unequally: High-income households receive the most benefits, followed by middle-income households, and low-income households receive the least benefits. In terms of proposal 4, it leads to a great loss of the consumer surplus, with the largest loss coming from high-income households and then middle-income households.
5. Policy implications
5.1 The government should continue cash transfer to the eligible
A cash subsidy for eligible households is needed to compensate for the increased expenditure. Improving the targeting effectiveness is crucial to ensure that the subsidy benefits those who need it the most. From our analysis, about 20.24% of the subsidy is currently leaked to ineligible households, so reducing exclusion can help redistribute the subsidy to eligible households, increasing its value for each recipient.
5.2 Tariff reform is necessary
Proposals 2 and 3 show that modifying intervals alone does not benefit low-income households as much as middle- and high-income households as the latter group tends to consume more electricity. Therefore, any quantity-based subsidy will be most beneficial to this group. Proposal 1 suggests that changes in both quantity and price are most effective for achieving equity. Removing subsidies from the first blocks leads to a more equal welfare distribution, as seen in proposal 4, where low-income households experience the least loss compared to high-income households.
5.3 Poor households renting accommodation should receive more support
In Vietnam, the district budget is used for educational and social assistance expenditures related to cash transfer. Since fiscal responsibilities are heavily decentralized, transferring the assigned budget within a province can be challenging (Morgan and Trinh, 2016). Therefore, local authorities are less likely to provide support to temporary residents, making them ineligible for most forms of social assistance.
Regarding quantity-based subsidies, temporary households mainly pay a flat price that is typically higher than the official tariff. As a result, they consume less electricity but have a higher expenditure. For instance, a poor household paying the flat price uses 54.646 kWh, which costs them VND173,400. In contrast, a poor household living in their permanent registered house consumes 145.974 kWh and pays VND277,300. On average, a poor household living in their own house consumes 176.13% more but only pays 59.92% more than a household renting accommodation.
Thus, poor households living in rented houses should receive more support from the government. One possible solution is to transfer the burden of social assistance from subnational to national budgets. The national authorities may not have been able to do this in the past due to a lack of information about residence status, but this issue can be addressed as the national population database is currently under implementation.
6. Concluding remarks
This paper investigates the residential electricity subsidy in Vietnam from two perspectives: cash transfer and quantity-based subsidy. For cash transfer, we apply the framework of Komives et al. (2005) to evaluate the subsidy in three dimensions: benefit incidence, beneficiary incidence and materiality. Overall, cash transfer in Vietnam is ineffective as it does not fully cover the poor population, and the subsidy coverage depends heavily on the poor list, which records few poor households. The size of the subsidy is also small compared to the income of these households. While we believe cash transfer should be continued, it needs to be reformed, with specific attention paid to poor households living in rented accommodation. In terms of the quantity-based subsidy, we estimate the price elasticity of demand through the demand function and then measure the consumer welfare effect under four scenarios to provide some recommendations to improve the official tariff. Some critical policy implications are as follows: (1) to gain better welfare distribution, the marginal price in the first block should reflect the full marginal cost; (2) both the interval and the marginal price should be modified and (3) removing the subsidized blocks improves the distributional equity.
We also identify several potential research areas for further exploration of the residential electricity tariff in Vietnam.
This study was limited to poor households. To provide more insightful policies, the study could be extended its scope to other vulnerable groups, such as households living in remote areas or minority groups.
The current increasing block-rate pricing plan does not encourage conservation as high-income households benefit from consuming over subsidized blocks. Other forms of tariffs, such as time-of-use, time-of-day or real-time pricing, can be considered to improve welfare and conservation. Access to micro-data from EVN can help explore this examination.