


This paper analyzes the application of real options to livestock production. It evaluates the strategic flexibility in determining the optimal selling time for livestock, considering the technological and market risks involved in its production.
Based on a data sample of 300 records collected over the past 15 years, a biophysical-economic model was developed and simulated using an iterative stochastic procedure.
The alternatives that provide the highest profit growth are identified by quantifying their risk parameters and yielding strategies for enhancing the value of livestock companies.
This research aims to understand how to improve decision-making in companies managing biological assets under conditions of risk and uncertainty, using the case of livestock systems in Argentina as a basis. This case can be easily adapted to similar cases in other countries.
1. Introduction
The application of real options (ROs), both to financial investments and real ones, constitutes an instance of the general problem of decision-making under uncertainty. These models have been used in practice for many decades (Yu, 2008), but have been rarely used in investment planning for complex biological assets. This is the case of cattle farming, with its specific technological and market risks. The application of RO in such settings provides strategic insights on how to manage livestock growth. A key aspect is the evaluation of its expected outcomes (Muhammad et al., 2020), which requires using specific information about the field of application. In our case, we use data drawn from cattle farming in the Argentinean province of Buenos Aires to develop an RO model for this activity, the main concern of agricultural companies in the region (Fernández et al., 2020).
The effectiveness of cattle breeding is primarily defined by the conception rate during the mating season (Blanc and Gabriel, 2008). The prevailing production systems traditionally use a weaning period (TW) of 7 months, but technologies that shorten lactation, such as early weaning (EW) at 3 months, allow reducing nutritional requirements and achieving higher conception rates for the same forage supply (Schultz et al., 2005). After the birth and weaning of calves, the number of heads to fatten and the final weight goal are commonly decided at the start of the fall session, influenced mainly by future price expectations and rainfall forecasts (which determine future forage availability).
Concerning the latter factor, notice that weather conditions induce a significant variability in the production of livestock. In dry years, producers are forced to sell calves early, whereas in wet years, calves can achieve higher finishing weights, adding value to the initial production. On top of this, the risk of death during the production process and the eventualities facing the maturation until reaching appropriate degrees of finishing must be taken into account in ad hoc optimization strategies. Other sources of uncertainty stem from the technologies used in the field as well as from market conditions (Milanesi, 2020).
This exposure to high risks highlights the need for specific economic and financial valuation tools to optimize the decisions made in the face of the interaction among the different risks. The design of ROs allows for the formulation of complex investment decisions, mitigating those risks, reducing costs and increasing expected outcomes (Van Reedt Dortland et al., 2014). ROs induce a strategic vision of livestock production beyond the shortsighted procedure of achieving a net present value larger than zero, adding value to investment projects in this area (Trigeorgis, 2007).
Nevertheless, the valuation through RO in this area is still deficient in practice (Perez et al., 2023), since livestock producers estimate the expected benefits of their alternatives with low precision (Ponssa et al., 2017). The reason is that, as shown for similar situations by Kahneman (2003), the decisions made by rural producers tend to be based on intuitions instead of reasoned inferences.
The incorporation of improved RO models would result in significant benefits for investment decisions in this economic sector. The key element for their success is the strategic flexibility that may be achieved by valuing correctly the technological and economic uncertainties faced by the producers of livestock. This strategic flexibility will be reflected in the optimal choice of the selling time in either the breeding or fattening phases.
The importance of this research lies in the fact that investment and financing decisions are essential for economic development (United Nations Organization UN, 2015). The use of precise regional statistical information from livestock companies will facilitate the adoption of new business models, attract investments and strengthen sustainable development.
This paper is structured as follows: Section 2 reviews the relevant literature, Section 3 discusses the methodology applied in this investigation, Section 4 presents the results of this research, Section 5 discusses those results in the light of the literature and, finally, Section 6 presents the conclusions.
2. Literature review
Traditional models of the valuation of investment projects assume the stability of the environment in which the projects are to be carried out. Thus, the uncertainty faced by the resulting plans is considered to be relatively mild. However, the implementation of these plans in the real world must face unstable environments, with rapid and often unexpected changes (Monteiro, 2007).
The static analysis of investment projects assumes that once a decision is made, the range of possible outcomes remains fixed, without the possibility of changing the course of action along the way (Pong, 2007). This may induce companies to make wrong decisions. The assumption of future volatility allows more flexible management alternatives, increasing the economic value of companies (Saito et al., 2000).
Valuation methods that contemplate uncertain prospects, assuming the possibility of choosing different courses of action during the execution of the project, yield what is known as strategic flexibility (Mun, 2020). ROs are particularly apt to achieve strategic flexibility in investment projects with real assets (Brandão et al., 2012).
Projects involving non-financial assets that do not require immediate or one-time implementation and thus can be carried forward in phases or progressively and implemented with financial options (put and call options). The valuation of projects can be carried out more efficiently than with methods that assess their present values using risk-free bond portfolios, since options incorporate the possibility of modifying the course of the projects in the future, increasing their economic value (Shibata, 2006).
In traditional methods, the negative impact of uncertainty is reflected in increasing discount rates. With ROs, a larger degree of uncertainty opens up the possibility of increasing the value of a project if managers identify new alternatives and capitalize on them (Tresierra Tanaka and Carrasco Montero, 2016). They may be able to evaluate strategic investments integrally, analyzing sequentially the uncertainty faced by a project, to determine the degree and timing of the exposure of investments to achieve larger benefits. ROs can be designed to provide enough flexibility to reduce losses or increase profits (Rodrigues and Rocha, 2007).
A financial option provides the right, but not the obligation, to buy (call) or sell (put) a defined amount of asset at a predetermined price called the strike price for a specified period, in exchange for a premium payment. Similarly, in an RO, the value of the project is conceived as the value calculated by traditional methods (its present value), plus the price of the option. The existence of options thus increases the value of investment projects, making this valuation crucial for detecting investment opportunities (Brealey et al., 2023).
Decision trees are a suitable analysis tool to evaluate the strategic flexibility of ROs, due to their ability to represent courses of action, their probabilities of occurrence and the expected average outcomes (Milanesi, 2020). The binomial model, incorporated into decision trees, adapts to discrete time the continuous-time nature of the geometric Brownian stochastic process of the Black–Scholes–Merton model (Van der Hoek and Elliot, 2006).
3. Methodology
3.1 Data and variables
The data on livestock to be used in this exercise were obtained from Argentinean companies from the region around Bahía Blanca (Province of Buenos Aires). The climate there is temperate semi-arid, with an average historical annual rainfall of 683 mm, with high intra- and inter-annual variability between 1,000 and 300 mm. The basic input for the operation of these companies is the production of forage for cattle, which correlates with the seasonal rainfall pattern (Torres Carbonell et al., 2021).
Our biophysical-economic model of the livestock systems uses a dataset compiled by the National Institute of Agricultural Technology on a sample universe of 300 production units surveyed for 15 years (Torres Carbonell et al., 2023) and studies of livestock systems from the Socio-Economics Area of the Department of Agronomy at the Universidad Nacional del Sur.
An average livestock company raises a cattle herd of 220 adult animals over a 478-hectare surface. The natural service is carried out in the November-December-January period, with 4% of the herd being bulls. The average annual mortality rate of weaned animals is 1%.
We analyze two weaning technologies:
Traditional: at an average age of 7 months with a calf achievement rate of 76%.
Early: at an age of 3 months, requiring supplementation for 90 days. The achievement rate is 94%. The forage base consists of 35% weeping grass pastures (Eragrostis curvula), 35% tall wheatgrass (Thinopyrum ponticum), 10% hybrid forage sorghum and 20% oat green feed.
To derive the growth of the animals, we run three contingent subroutines:
A precipitation subroutine that yields estimations of rainfall for the four seasons of the year, using the historical rainfall series from 1960 to 2023.
The previous estimations are used as inputs to a forage production function that yields the average amount of forage generated corresponding to the seasonal rainfalls (Torres Carbonell, 2014).
This, in turn, allows forecasting the Daily Weight Gain (DWG) of the animals, using equations from the Commonwealth Scientific and Industrial Research Organisation (CSIRO) nutritional system (2007).
The algorithms for the three subroutines are structured in Microsoft Excel®. Some components are integrated into a Crystal Ball version 7.3.1 implementation of a stochastic iterative procedure, generating 3,000 replica generations. The marketed asset disclaimer procedure is used to run a Monte Carlo simulation (Brandão et al., 2005), yielding the average parameters of the probability distribution of outcomes. In particular, we obtain the crucial parameter for ROs, the volatility of the geometric Brownian process, as the standard deviation of the distribution.
Economic estimations are drawn from historical series recorded in databases provided by the Ministry of Agriculture, Livestock and Fisheries of Argentina as well as from information about other reference markets.
3.2 The RO model
Critical decisions in the development of our RO model are (1) the choice of a weaning method; (2) the selection of the number of animals in fattening and wintering time per calendar season, according to the available amount of forage relative to rainfall and (3) the specification of the price relationship.
To assess the strategic flexibility of the model, the uncertainty of the critical technological and market variables is evaluated through a decision tree using the Microsoft Excel® add-on Simple Decision Tree Toolbar 1.4. The outcomes of different decisions are first obtained, and then the expected value is maximized subject to the technological and market risks associated with them. The course of action with the highest expected value is identified using a recursive process based on probabilities of occurrence and assuming discounted cash flows at a risk-free rate of r = 5%.
The value of the RO is determined by adjusting the discrete-time stochastic process according to the simpler multiplicative binomial model (Van der Hoek and Elliot, 2006). This allows representing the behavior of the underlying geometric Brownian process with the same volatility parameter, which together with the risk-free discount rate, specifies the future expected value of an asset with an economic value that either goes up or down from its value in the previous period in proportions u and d:
where σ is the volatility and t is the difference in time between the previous and future periods.
The projected results for each of the variables determine the probability p of favorable conditions (equation 3), which later allows calculating binomial grids of the economic results of each decision (Smit, 2005).
The livestock company under analysis poses three sources of technological risk and one market risk. The technological risks are captured in the following parameters: (1) the percentages of birth and subsequent weaning of calves per cow, which vary with the results of the chosen weaning method (EW or TW), which may either be successful (W) or a failure (1-W); (2) the proportion of animals that are alive after weaning (1-a is the proportion of dead animals) and (3) the probability of favorable (DWG) or unfavorable (1-DWG) fattening conditions for each season of the year. The market risk, in turn, is given by the probability p of favorable conditions for price relations in costs and revenues (1-p is the probability of unfavorable conditions). The proposed model does not present a correlation of the various sources of risk, since they behave independently.
Equation (4) describes the expected value of the sale of weaned calves (VSell), and Equation (5) describes the expected value of the calves destined for fattening (Vfat).
where CFu and CFd represent the cash flows of the upward (u) and downward (d) branches, respectively.
Equations (6) and (7) describe the model for estimating the expected value for the EW (VEW) and traditional (VTW) alternatives, respectively.
where C is the production cost, WC is the weaning cost and e-r.t is the risk-free discount factor.
Finally, Equation (8) synthesizes the result of the multinomial model, yielding the expected value E(V) of the real option:
This multinomial option model captures the entire spectrum of binomial outcomes of a possible livestock production plan under different choices, subject to the impact of the risk sources. This RO resembles an exotic rainbow-type option, a valuation tool for future decision flows that internalize different sources of uncertainty (Milanesi, 2021).
4. Results
The livestock production plan requires making the following strategic decisions: (1) the starting period of the breeding service phase; (2) the timing of weaning during the service, which determines different levels of conception and calf birth rates for the following year, as well as the different supplementation costs that will be faced, and (3) the decision on either to fat or to sell the calves during the first summer and the subsequent autumn and spring. This determines the total duration of the potential biological production system of 2 years, which can be identified with the total useful life of the RO. Figure 1 illustrates the technological decisions, defining the basic decision nodes of the RO and its maximum expiration time.
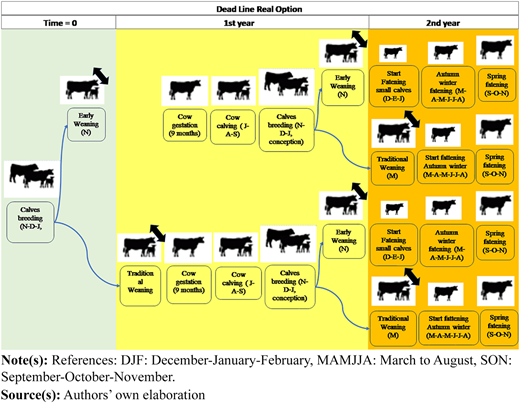
The decision nodes are associated with the critical periods. These decisions determine the technological risks of the production plan. The outcome is obtained by adding the possible market risks at each selling decision. Table 1 enumerates the sources of risk, their probabilities of occurrence and the upward or downward movements for all the possible strategies.
Volatility, probabilities and value of the binomial movements for the decision alternatives
| Type of risk | Eventuality | Parameter | ||||
|---|---|---|---|---|---|---|
| Volatility | P | 1-P | u | d | ||
| Technological | Successful conception with EW | 0.94 | 0.06 | – | – | |
| Successful conception with TW | 0.76 | 0.24 | – | – | ||
| Successful fattening (DJF) EW calves | 0.208 | 0.662 | 0.338 | 1.137 | 0.879 | |
| Successful fattening (DJF) TW calves | 0.377 | 0.563 | 0.437 | 1.239 | 0.807 | |
| Successful fattening (MAMJJA) steers | 0.755 | 0.534 | 0.466 | 1.29 | 0.775 | |
| Successful fattening (SON) steers | 0.418 | 0.516 | 0.484 | 1.33 | 0.752 | |
| Economic | Favorable price relation | 0.302 | 0.507 | 0.493 | 1.352 | 0.740 |
Note(s): References: DJF: December-January-February, MAMJJA: March to August, SON: September-October-November. P is the probability of the specified risk, while 1-P is the complementary probability.
Source(s): Authors' own elaboration
Based on the information in Figure 1 and Table 1, Figure 2 presents the decision tree that integrates all the alternatives, according to the risks and expected financial outcomes.
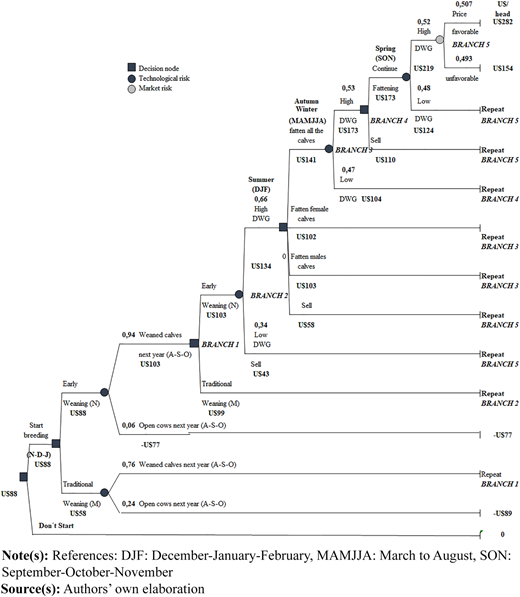
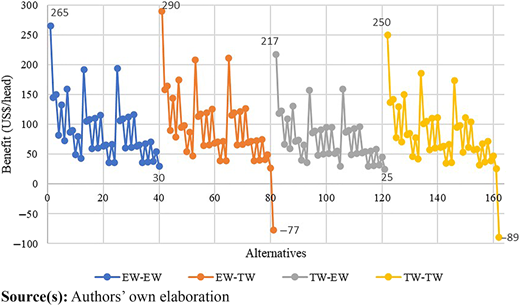
This tree specifies 162 alternatives for different future selling periods. The recursive evaluation of alternatives yields an expected final result of US$ 88 per head (Figure 2). Other alternatives may generate larger values, depending on the conditions that arise over time. The results for all the alternatives are shown in Figure 3, while Table 2 describes the decisions and conditions necessary for achieving the 10 best alternatives plus 3 particularly salient alternatives.
Economic outcomes of the 10 best alternatives plus 3 relevant alternatives for analysis
| Ranking | Alternative | Weaning during the breeding season | Weaning during | DWG summer (DJF) | Fatten calves | WDG autumn-winter (MAMJJA) | WDG spring (SON) | Prices | Result (U$/Head) |
|---|---|---|---|---|---|---|---|---|---|
| the nursing season | |||||||||
| 1° | 41 | EW | TW | + | Male-Female | + | + | + | 290 |
| 2° | 1 | EW | EW | + | Male-Female | + | + | + | 265 |
| 3° | 122 | TW | TW | + | Male-Female | + | + | + | 250 |
| 4° | 82 | TW | EW | + | Male-Female | + | + | + | 217 |
| 5° | 65 | EW | TW | + | Male | + | + | + | 211 |
| 6° | 53 | EW | TW | + | Female | + | + | + | 208 |
| 7° | 25 | EW | EW | + | Male | + | + | + | 194 |
| 8° | 13 | EW | EW | + | Female | + | + | + | 192 |
| 9° | 134 | TW | TW | + | Female | + | + | + | 186 |
| 10° | 47 | EW | TW | + | Male-Female | – | + | + | 174 |
| 19° | 2 | EW | EW | High | Male-Female | High | High | – | 145 |
| 80° | 158 | TW | TW | High | + | 72 | |||
| 85° | 37 | EW | EW | High | + | 70 |
Source(s): Authors' own elaboration
The best alternative yields U$ 290. Its occurrence requires (1) carrying out EW during the service; (2) applying a TW with high DWG in the next summer, after the birth of the calves; (3) high availability of forage for wintering all the calves and high DWG in the fall and spring seasons and (4) the existence of a favorable price relation at the selling period. Table 3 exhibits the revenues, costs, and economic results corresponding to the optimal alternative.
Details of costs, income and economic benefit of the best alternative
| Detail | Head | U$ |
|---|---|---|
| Total costs | 40,188 | |
| Forage | 10,924 | |
| Supplementation | 2,411 | |
| Health | 2,009 | |
| Personnel | 7,636 | |
| Structure | 6,832 | |
| Taxes | 2,009 | |
| Depreciation | 1,608 | |
| Commercialization expenses | 6,759 | |
| Total income | 1,03,988 | |
| Steers | 102 | 58,752 |
| Heifers | 58 | 28,304 |
| Cull bull | 2 | 1,176 |
| Cull bow | 39 | 15,756 |
| Net profit | 63,800 | |
| Net profit U$/head | 290 |
Source(s): Authors' own elaboration
An initial technological risk of conception during the service crucially conditions the number of heads in fattening the following year. However, if the production process is an activity that will be repeated year after year, the choice will be alternative 1 (U$ 265 per head), since the results in one period will not condition those in the following exercise. This is because the expected calf rate by EW is significantly higher (94%) compared to traditional weaning (76%), determining the final number of animals able to fatten and be sold at the end of the project, in 2 years.
Notice that the outcome of EW in alternative 1 (U$ 265 per head) is 22.1% higher than in alternative 82 with traditional weaning (U$ 217 per head) under a similar scenario.
The early evaluation of strategic flexibility provides an assessment of possible courses of action, allowing for informed planning and smooth implementation. In this sense, the unfavorable price relation in alternative 2, compared to the best option, reduces the results by 45.3% to U$ 145 per head. Alternatives 13 and 25, associated with favorable prices and conditions of low DWG in some seasons, yield results 32 and 34%, respectively, better than those of alternative 2, thanks to their corresponding optimal productive conditions even if the prices are low.
The sale at weaning of all calves under favorable prices, either with EW (alternative 37) or traditional weaning (alternative 158), yields results of 70 and 72 U$ per head, respectively. This indicates that as long as the conditions allow to continue the fattening process, the value could be increased by up to 314.3% or 247.2% under alternatives 1 and 82, respectively.
Incorporating climatic and technological risks into the decision tree is fundamental for this analysis. It allows for an adequate valuation of opportunities, unlike other approaches that do not accurately evaluate contingent investment decisions (Brealey et al., 2023).
At the start of the service, managers may envision a wide range of future uncertain events. The possibility of waiting until more information is incorporated, and making corrections in medium-term strategies allows managers to avoid future regrets about irreversible decisions made too early in the process. The margin of maneuver at critical moments of decision, which the tree highlights, yields the operational flexibility necessary to improve the value of the project (Brandão et al., 2005).
Another realization is that, independent of whether the choice is to implement early or traditional weaning, the project yields a present value of 88 U$ per head, triggering different future alternatives. The binomial grid indicates that the outcomes of high and low price scenarios yield a current value of 237 U$ per head Table 4), which internalizes the strategic flexibility of the decisions (Milanesi and Pesce, 2022).
Determination of the current value, expanded value and value of the RO of the analyzed livestock company
| Detail | (U$/head) |
|---|---|
| Expanded value of the project | 237 |
| Current value of the project | 88 |
| OR value | 149 |
Source(s): Authors' own elaboration
The RO provides the right, but not the obligation, of servicing the herd by expanding, reducing, postponing or abandoning future phases of the livestock production process, based on an exercise price and the life span of the option (Smith, 2005). The value of the right to future business opportunities up to 2 years after starting the service is $149 per head, representing 169.3% of the expected current value for the initial decision of $88 per head.
5. Discussion
The option value encapsulates in a single measure all the knowledge about feasible future outcomes that can be reached using the alternatives under analysis, enabling the comparison of the decisions that can be made in the face of the same risks with other investment mechanisms (Wang and Hwan, 2007). Trigeorgis (2007) highlights the importance of using ROs for the coherent valuation of different operational and financial investment alternatives.
ROs allow valuing the outcomes of a large number of paths that may be followed, depending on the available technologies, the agroclimatic context and the market conditions. The only limitation to the adoption of this way of valuing investment decisions is the lack of familiarity with ROs [1].
The knowledge about intangible assets related to the performance in the production of livestock is highly relevant to increasing competitive advantages and creating value (Rodríguez-Castellanos et al., 2007). Using such knowledge, decision-makers can reduce the negative impact of uncertainty and the presence of market information asymmetries, achieve a more efficient strategic allocation of resources and increase the value generated by the company.
The value determined in this study was higher than in Perez et al. (2023), a similar analysis but for cattle production in La Pampa (Argentina). These authors found that the value of the RO was 14.2% of the current value of the initial decision. This difference can be attributed to the configuration of the systems, mainly in the margins on different forage approaches, which, along with land value, modify the impact on production costs.
The potential applicability of this approach is very broad, and while it is not unexplored, it has so far been little used in the agricultural sector. In this sense, there are a few studies of its application in Argentina and other countries. Ponssa et al. (2017) analyzed the optimal timing of replacing empty cows in northern Buenos Aires. Unlike in our case, this requires the valuation of a put option, with a value equivalent to 22 kg of calf per cow, showing the economic importance of being able to sell cows in cases where conception does not occur. Broz et al. (2017) compared forest investment projects, analyzing the outcomes of logging at the end of the forest’s life, incorporating into the assessment of an RO the market risks and the strategic flexibility at the time of logging and providing a larger freedom of maneuver in a very long-term production.
Sosa Cruz and Banda Ortiz (2020) analyzed four coffee plantation projects in Mexico by comparing traditional discounted cash flows and ROs. The latter allowed them to capture more alternatives, increasing the value of the projects, reducing risks and providing more assurance about whether the project should be implemented. Thomas et al. (2008), in the same vein, compared projects of Chilean public institutions through ROs, finding alternatives that may increase the value in a range from 25 to 500%, compared to the outcomes of the same projects without incorporating their risks.
Problems to be evaluated with ROs should be decomposed into all their possible alternatives, specifying their corresponding risks, to determine the most efficient decisions that can be made as the project progresses (Mun, 2020). In our work, this is achieved by partitioning the livestock project into stages, allowing for the eventual acquisition of information to make better decisions. Minardi (2000) points out that the ROs are fit to be applied to managing natural resources since a fundamental component of the alternatives, the prices of the underlying assets, can be directly read from the market.
In this sense, in our application, we identified the decision flexibility points optimizing the value of investment projects to steer the results toward the best option at decision points where significant uncertainties are resolved. Strategies may change the course of action thanks to the continuous influx of information.
6. Conclusions
In this paper, we generated quantitative information on value-enhancing alternatives and their risk parameters for livestock production, incorporating the value of strategic flexibility in managerial decisions. The following conclusions can be drawn for our particular case study:
By assessing technological and economic risks, we identified 162 courses of action. The alternative of selling all the calves yielded values of $70 and $58 per head in the context of favorable prices for early and traditional weaning. The analysis of operational flexibility revealed that if climatic conditions favor continuous fattening, the former initial result could increase by 278.5% and 222.1%, respectively, in a wide range of intermediate situations that contribute additional value.
The current value of the decision to sell calves at weaning is $88 per head. The valuation of fattening them is $149 per head. The flexibility of the feasible strategies suggests that as favorable conditions occur, it is much more convenient to fatten a large number of males and then females until the end of the next spring.
These results indicate the advantages of incorporating strategic flexibility in the management of livestock, contrary to the recommendations of traditional valuation models. In future work, we intend to incorporate further technological alternatives such as supplementation during fattening and the implementation of different sales strategies. These extensions will enrich the number of alternatives and thus the value of production projects.
Note
Arregui Ayastuy et al. (2011a) show, in an analysis of 517 companies in the Basque Country that only 10% used ROs to value their investment strategies, 3/4 knew that options existed and only 1/4 were able to recognize what those options were.

