


This study aims to identify and analyse the barriers to adopting Industry 4.0 technologies in inventory systems within the retail sector. Despite the critical role of these barriers in hindering the implementation of digital technologies, there is a noticeable gap in the literature regarding analytical studies that address this issue.
To fill this gap, the study employs a hierarchical model to examine the interrelationship between various barriers. The model integrates joint interpretive structural modelling (ISM) and cross-impact matrix multiplication applied to classification (MICMAC) analysis. The research involves interviews with a group of expert participants from the Australian retail industry, focusing on 13 key barriers identified through a comprehensive literature review and expert input. The driving power and dependence power of each barrier are assessed and classified into four clusters.
The study identifies 13 key barriers to the adoption of Industry 4.0 technologies in retail inventory systems. Among these, four stand out as the most influential: financial constraints, lack of management, organisational inadaptability and government reluctance. Financial constraints emerge as the dominant driver, as limited profit margins restrict retailers’ ability to invest in new technologies. In contrast, skill and training requirements were found to be the least consequential, indicating that workforce limitations, while relevant, are not perceived as critical in undermining inventory system performance. These results clarify the relative influence of barriers and their role in shaping adoption outcomes.
The study provides exploratory insights that can help retail practitioners in Australia understand and prioritise the barriers to adopting Industry 4.0 technologies in inventory systems. By mapping the driving and dependence power of each barrier, retailers can develop more targeted strategies to address the most influential challenges. While the findings are indicative and context-specific, they offer a structured basis for reflection and strategic planning, supporting the ongoing digital transformation of inventory management in the retail sector.
The contribution of this research lies in its context-specific examination of barriers to Industry 4.0 adoption in Australian retail inventory systems. Although previous studies have investigated Industry 4.0 adoption across various sectors, few focus on retail inventory management and the interrelationships among barriers in this specific context. By applying interpretive structural modelling (ISM) and MICMAC analysis, the study provides a structured exploration of how barriers interact, offering preliminary insights for both researchers and practitioners rather than claiming a fully novel methodological or theoretical contribution.
1. Introduction
Industry 4.0, first conceptualised in 2011 by a former SAP manager in Germany, represents a paradigm shift in industrial practices through the adoption of digital and smart technologies that enable decentralised, automated processes within organisations (Kassen, 2022). These technologies facilitate the seamless movement of data and materials without direct human intervention, transforming the way businesses operate across multiple sectors. Although Industry 4.0 emerged initially in the manufacturing domain, its principles have extended to supply chain management, logistics, and retail operations due to their cross-functional nature and the increasing need for efficiency, agility, and responsiveness in complex environments (Tjahjono et al., 2017; Calabrese et al., 2022).
The integration of Industry 4.0 technologies in supply chains offers multiple opportunities. By leveraging advanced digital tools, organisations can optimise process management, forecast demand more accurately, improve supplier selection, and enhance decision-making across interconnected activities. Technologies such as augmented reality (AR), big data analytics, cloud computing, Internet of Things (IoT), radio-frequency identification (RFID), robotics, and artificial intelligence (AI) are increasingly employed to provide real-time visibility, improve operational efficiency, and strengthen competitive advantage (Mendoza et al., 2025; Kamal, 2020). Retailers, in particular, rely on these innovations to manage highly dynamic inventory systems, respond to fluctuating customer demand, and deliver superior service levels in an increasingly competitive marketplace.
Inventory management constitutes a critical area for the application of Industry 4.0. It involves controlling stock levels, optimising warehousing strategies, reducing lead times, and efficiently allocating resources across the supply chain. Effective inventory management not only supports operational efficiency but also contributes directly to customer satisfaction and profitability. Retail organisations face mounting pressure to maintain the right balance between stock availability and cost efficiency, particularly in fast-moving consumer goods and high-demand sectors. These pressures are exacerbated by the volatility of global markets, frequent changes in consumer preferences, and the increasing complexity of supply networks (Singh and Verma, 2018; Shriharsha et al., 2025).
Despite the clear benefits, the adoption of Industry 4.0 technologies in inventory management is accompanied by multiple challenges. Studies indicate that organisations encounter barriers at various levels, including organisational, technological, strategic, legal, and ethical dimensions. Common obstacles include financial constraints, resistance from employees, lack of skilled personnel, inadequate infrastructure, low standardisation of processes, cybersecurity threats, and insufficient policy support from governments (Almada-Lobo, 2015; Nicoletti, 2018). These challenges often interact and amplify one another, making the implementation of smart technologies in inventory systems a complex endeavour. For example, technological advancements such as IoT and AI may require substantial investment in workforce training and data management systems, while regulatory uncertainties and cybersecurity risks further complicate adoption decisions.
Although Industry 4.0 has attracted considerable research interest in recent years, studies specifically focusing on barriers in inventory management systems are limited. Existing literature often addresses general applications or technological benefits without providing an in-depth analysis of the challenges that organisations face in practical implementation (Paul et al., 2019; Yadav et al., 2020, 2022). As a result, there is a critical knowledge gap regarding the nature of these barriers, their interrelationships, and their influence on the adoption of Industry 4.0 technologies in the retail sector.
This study aims to address this gap by investigating the key barriers to implementing Industry 4.0 technologies in retailers’ inventory management systems and exploring the interrelationships between these barriers. Specifically, the study seeks to answer the following research questions:
What are the key barriers to implementing industry 4.0 technologies in the retailers’ inventory management systems?
What is the interrelationship between the identified barriers and to what extent do these barriers influence one another?
This research will answer the questions by collecting data from experts in the field of inventory management from Australian retailers. The data collection leads to identifying and summarizing key barriers and the interrelationship between these barriers will be discussed using an interpretive structural model (ISM). Besides, a MICMAC analysis is used to determine to what extent these barriers influence one another in the supply chain.
The remainder of this study is summarized as follows. A comprehensive literature review is proposed in section 2 to highlight the knowledge gap. Section 3 proposes a quantitative approach that comprises collecting data, ethical approval, and applying ISM and MICMAC analysis approaches. Section 4 illustrates the collected data and analyses them using a reachability matrix. The results obtained from the ISM, MICMAC, and reachability matrix analysis are summarized in section 5 by assigning the identified barriers to four clusters based on their driving and dependence power. Eventually, Section 6 summarizes the findings and proposes theoretical and managerial implications.
2. Literature review
Retailers have started using new strategies to enhance their business models and propose value for stakeholders. Adopting smart technologies is an effective method that can be used to improve the service level amongst supply chain activities. Transparency of products through shipping containers and interoperability of machines and humans based on virtual technologies such as augmented reality (AR), precise optimization algorithms, and AI automation are some instances of applying these technologies in an inventory system. Along with logistic applications, inventory management is also the case for employing industry 4.0 technologies. Currently, most approaches in inventory management are multi-objective optimization models to minimize the total cost of handling inventory and keep the service level at an acceptable value. The transition from traditional to smart inventory management requires huge pools of date, internet connectivity, enterprise software systems, and smart products (Karimi-Nasab and Aryanezhad, 2011).
Uncertain demand is one of the main factors that pose uncertainty in the whole inventory system. Therefore, the inventory system requires processes that can help increase predictability, balance demand fluctuations, and maintain the selling price. Besides, developing transparency through digital ledgers and IoT can help inventory systems to move towards decentralizing the system, decreasing the complexity of decision-making, and remaining flexible (G et al., 2019). However, retailers still confront numerous obstacles in implementing industry 4.0 technologies in their inventory systems effectively. This section proposes a literature review on the potential barriers to this implementation. It starts with identifying the technologies that are applicable in inventory systems and moves toward finding barriers that are obstacles to implementing each technology (Yerpude and Singhal, 2018).
2.1 Industry 4.0 technologies in inventory systems
The autonomous vehicle can be considered one of the ideal technologies to provide constant traceability and automation in the inventory system and reduce costs and time spent on material handling (Wankhede and Vinodh, 2022; Piron et al., 2024). One of the instances of applying autonomous vehicles is using installed scanners to follow a pre-defined flight route to read barcodes (Beul et al., 2018). A light detection device can also be attached to a self-positioning drone capable of scanning the environment autonomously. These drones use RFID scanners to identify tags around warehouses and provide inventory reports (Fernández-Caramés et al., 2019). Besides, QR code-based vehicles can also be used to detect items in a warehouse. Combining these vehicles with an ultra-wideband (UWB) network improves the accuracy of this detection significantly. The application of these vehicles mainly results in reducing delivery delays, improving pickup accuracy, increasing productivity, mitigating average operation time, and developing user-friendliness (Macoir et al., 2019).
Big data analytics which is the process of extracting and analysing data from large data pools can also be applied to optimize knowledge creation and enhance decision-making in inventory systems (Tiwari et al., 2018). Managing the safety stock, predicting demand patterns, minimizing costs, and optimizing materials flow are some advantages of using this approach in inventory systems (Wang et al., 2016; Han et al., 2021).
Internet of things (IoT) which is defined as a network of objects accommodating technologies that interact with internal state and external environment includes a range of different physical sensors, processors, and actuators that send data to a virtual platform. Technologies such as RFID, wireless sensor networks (WSN), cloud computing, laser scanners, and intelligent information sensing devices are some of the new advances in the area (Calabrese et al., 2022). Near-field communication (NFC) is also used in inventory systems to enhance the traceability of products over short distances (Abdel-Basset et al., 2018).
Blockchain is a shred time-stamped data ledger that makes the interaction between participants without relying on authorities (Tiwari et al., 2018). This technology is a distributed database among a network of computers that can store and share information electronically. As inventory systems rely on fast information exchange, which is needed for real-time decision-making, blockchain can be used for data authenticity across all parties involved in inventory activities. Blockchain can be combined with autonomous vehicles to assist with the traceability of products and sharing the data in real-time in a safe platform (Kapitonov et al., 2017).
AI can administrate customer data and forecast customer behaviour, provide proactive notification for operators to re-order stock, and assist operators to optimize the re-ordering points (Sustrova, 2016). Artificial neural network which is based on AI can imitate human brain functions and solve the problem of re-ordering and demand forecasting (Paul and Azeem, 2011). Another application of AI which is expert systems addresses material handling patterns and their complexities. In this regard, an organisation’s material requirement planning (MRP) can incorporate expert systems to collect and store data on master production schedules (MPS), order patterns, and inventory replenishment intervals.
Although some barriers were initially identified in manufacturing, logistics, and IT contexts, they are transferable and relevant to retail inventory management. For instance, challenges related to data integration, system interoperability, and workforce skills, while documented in other sectors, also directly affect the implementation of Industry 4.0 technologies in retail inventory systems. These barriers influence how retailers adopt digital tools such as IoT, RFID, and analytics platforms, impacting inventory accuracy, process efficiency, and overall operational performance. By including these barriers, the study ensures a comprehensive exploration of factors that can hinder Industry 4.0 adoption in the retail inventory context.
2.2 Barriers to implementing industry 4.0 technologies in inventory systems
A study conducted by Deloitte on the challenges and solutions of industry 4.0 in Switzerland depicts a divergence in the current state of adopting industry 4.0 in inventory management and the perceived potential of this segment. Form the industrial experts’ point of view, procurement and manufacturing processes have already undergone a huge transformation. However, with %74 of participants rating, warehousing and inventory management is the segment that benefits from adopting these technologies more than others (Finance, 2015). Despite this significance, there is a lack of literature specifically targeting inventory systems.
Financial constraints are huge problems in implementing new technologies (Horváth and Szabó, 2019). Lack of clarity in cost-benefit analysis and monetary gains within an organisation is the main challenge of this implementation. Besides, a lack of financial resources is an important challenge for companies to overcome (Theorin et al., 2017).
As industry 4.0 technologies are rapid, intensive, and resource-consuming, adequate management skills are required to implement timely decisions to achieve the expected results. In this regard, the management team coordinates the cross-functional collaboration of digitalized process of value chain networks (Ras et al., 2017; Hossain and Thakur, 2020). Moreover, some executives who are not familiar with these technologies become reluctant in adopting them. This resistance to change can arise from a lack of competence or denying the benefits of digital transformation (Gökalp et al., 2017).
Some other organisational challenges such as the feeling of over-supervision, inexplicit values, feeling inadequacy, and high workload concerns can emerge during the adoption of new technologies, and workers might feel micromanaged. Organisational inadaptability might convey the feeling of being under pressure or inadequate (Birkel et al., 2019). Potentially, some of the staff might be afraid of losing their job and organisational power. Disruption of existing jobs and conflict of interests interferes with upcoming changes and requires constant adaptability to solve the challenges (Ito et al., 2021).
Different studies mutually agreed that the major challenges of most organisations in implementing industry 4.0 technologies reside in the lack of a skilled workforce and retraining current staff to fit into new roles (Erol et al., 2016). Multi-criteria analysis on the identified barriers of industry 4.0 specifically points out that there is a shortage of workforce who understand the requirements of supply chain management. IoT also adds more complexity to the data management system which means companies need to retain or hire new employees who can work with the data management tools and networks (Bag et al., 2018).
Implementing industry 4.0 technologies requires high-speed internet connection in different sectors of the organisation to maintain the processing power and address specific computational units. Besides, the lack of unified communication protocols and back-end systems may interfere with the processes of industry 4.0 technologies which will be challenging. Most of these technologies are new and their backup systems need to be maintained to ensure the procedures’ reliability. For some technologies such as autonomous vehicles, the cost of purchasing equipment, low support for end-users, and complex interface affect the technology that is being implemented (Ajmera and Jain, 2019).
Cyber security issues are threats for organisations while industry 4.0 technologies create numerous data transactions. Data security and legal repercussions are the main issues of adopting the technologies in inventory systems. For instance, blockchain users’ information including name, address, and personal details can be publicly accessed due to being visible to all nodes (Cimini et al., 2018). Therefore, major attacks such as denial of service, spoofing, and double spending are common threats. Oracles which are centralized third parties constitute a relationship between blockchain and the real world (Etemadi et al., 2021). In the case of smart contracts, oracles are essential for data collection and there is always a possibility that these oracles consist of criminal individuals or organisations (Fraga-Lamas and Fernández-Caramés, 2019).
Legal complexities in implementing industry 4.0 technologies emphasize data protection regulations when in the private-law domain, liability is significant as contracts can be miscoded and the intended expectations of parties might not be achieved (Omar et al., 2020). In smart contracts, parties need to agree on jurisdiction and governance for dispute resolution and the identity of both parties can also be questioned as most blockchains avoid sharing details (Ho et al., 2021). From the public perspective, blockchains can be used for money laundry purposes to take advantage of pseudonymous involvement (De Giovanni, 2019).
Low degrees of standardization across business processes drastically hinder the further adaptation of industry 4.0 technologies in inventory systems (Raj et al., 2020). Organizations with a lack of digital culture often encounter problems in integrating industry 4.0 technologies due to difficulties in establishing seamless connectivity and integration between machines, workers, and equipment (Rajput and Singh, 2019). A variety of platforms and databases is an issue for data exchanging when developing interoperability (Müller, 2019).
Difficulties in coordination can be classified as one of the significant barriers to adopting smart technologies in inventory systems (Kmiecik, 2022; Rabelo et al., 2002). As processes in an inventory system are becoming more interconnected, coordinating different functions is challenging as most organisations still operate within departments and use hardware and software that is designed for their pre-defined processes.
Industry 4.0 improvements are applied to service-oriented activities; however, some organisations focus on the return on investment and bottom lines which underlies risks that should be taken into account (Cachon and Fisher, 2000). Therefore, high expectations can negatively affect the process of integrating technologies within an inventory system. In this regard, inventory systems can be improved by increasing the collected data volume, synchronizing transactions, and obtaining consensus amongst clients. This can affect IoT devices that require rapid access to computational performance with low computational power (Hamadneh et al., 2021).
In case of new disruptive technologies, governments need to provide the necessary infrastructure for the digital transition and implement policies to control and regulate the systems. Lack of support and policy making affects the rate of implementing industry 4.0 technologies in inventory systems (Horvat et al., 2018). For instance, cold chains in food industries and pharmaceuticals require control systems based on various sensors that measure different environmental factors (Yadav et al., 2022). However, there is little evidence from the governments that try to provide guidelines for implementing smart technologies in inventory management sectors (IBISWorld, 2019).
The sheer volume of heterogeneous data generated through adopting industry 4.0 technologies has been exponentially on the rise since its inception. Data protection, collection, reliability of data, transfer rate, and storage efficiency are relatively faster while using smart methods. However, constant exposure to volatile results has made decision-making strenuous in some cases. The immature status of technology, energy cost, low scalability, and untrusted nodes are some reasons that prevent organisations from investing in industry 4.0 technologies. As an extension of blockchain technology, smart contracts have limitations such as transaction capacity, latency, throughput, and validation protocols (Paul et al., 2019).
2.3 Identification of the barriers
The existing literature has been explored to provide a review of current barriers preventing the further implementation of Industry 4.0 technologies in inventory management. The main inventory management-related Industry 4.0 technologies are autonomous vehicles, big data analytics, the Internet of Things (IoT), blockchain, and artificial intelligence (AI). This review was conducted through an examination of peer-reviewed academic publications and industry reports. These sources contributed to identifying 13 common barriers to the adoption of these five key technologies. These barriers include financial constraints, lack of managerial support, organisational inadaptability, skill and training requirements, inadequate infrastructure and facilities, cybersecurity issues, legal complexities, integration and interoperability challenges, lack of coordination and collaboration, unclear perception of benefits, government reluctance, limited investment in research and development (R&D), and technological complications.
To ensure that the barriers included in this study represent the current state of knowledge in the literature, a structured process was followed to identify, synthesise, and consolidate barriers to the adoption of Industry 4.0 technologies in inventory systems. This process comprised three main steps:
Step 1: Extraction of barriers from the literature: A broad review of peer-reviewed journal articles, conference proceedings, and industry reports was conducted, focusing on the application of Industry 4.0 technologies in supply chain and inventory management. The search targeted the five key technologies most frequently discussed in the context of inventory systems: autonomous vehicles, big data analytics, Internet of Things (IoT), blockchain, and artificial intelligence (AI). All challenges and obstacles mentioned in relation to these technologies were extracted to form an initial long list of potential barriers.
Step 2: Thematic clustering and categorisation: The extracted barriers were then organised into thematic categories, drawing upon established frameworks in digital transformation and supply chain management (e.g. Ras et al., 2017; Bag et al., 2018; Raj et al., 2020). For example, barriers such as lack of managerial support, resistance to change, and workforce retraining needs were grouped under organisational and human resource barriers. Similarly, issues such as cybersecurity, interoperability, and legal uncertainties were clustered under technological and regulatory barriers. This step ensured that overlapping concepts were merged, while preserving the distinct challenges highlighted in the literature.
Step 3: Synthesis into common barriers: Following clustering, a consolidation process was undertaken to refine the list into broader but clearly defined categories that captured recurring themes across multiple sources. This synthesis produced the final set of 13 barriers: financial constraints, lack of managerial support, organisational inadaptability, skill and training requirements, inadequate infrastructure and facilities, cybersecurity issues, legal complexities, integration and interoperability challenges, lack of coordination and collaboration, unclear perception of benefits, government reluctance, limited investment in research and development (R&D), and technological complications.
This systematic approach ensured that the identified barriers were not only drawn from diverse sources but also represent the most recurrent and cross-cutting challenges consistently acknowledged across the literature. The 13 barriers therefore provide a comprehensive and integrative framework for examining Industry 4.0 adoption in inventory systems, particularly within the retail sector, where research remains limited compared to manufacturing and logistics.
2.4 Gaps in literature
Despite the breadth of research available, a closer analysis reveals several important gaps. Firstly, while existing studies have extensively discussed individual technologies or focused on a single type of barrier, there is a lack of integrative research that examines multiple Industry 4.0 technologies in relation to inventory management simultaneously—especially in the context of the retail sector. Most of the available literature tends to focus on the manufacturing sector or third-party logistics (3PL) providers, where the technological environment and implementation challenges may differ significantly from those encountered in retail. Consequently, the barriers identified in prior studies may not fully capture the unique complexities and operational dynamics within retail inventory systems.
Secondly, the current literature is predominantly conceptual or based on theoretical frameworks, with limited empirical investigation into how these barriers manifest in real-world inventory operations. This shortfall limits the practical applicability of findings and underscores the need for more industry-specific, evidence-based research. In particular, there is minimal research examining the level of Industry 4.0 readiness among retail organisations, and how this readiness influences the prioritization or mitigation of adoption barriers. Moreover, the interrelationships among barriers—such as how a lack of infrastructure may exacerbate cybersecurity risks or how unclear benefits hinder managerial support—are rarely addressed through structured analytical methods.
These gaps highlight the necessity for empirical studies that not only identify but also map the interconnectivity and relative impact of the various barriers to adopting Industry 4.0 in inventory management. Accordingly, the present study seeks to fill this void by adopting a quantitative approach to data collection. Methods include structured phone interviews, face-to-face discussions, and online meetings with inventory managers and planners. The goal is to elicit insights from practitioners and draw a networked understanding of the barriers, thereby contributing to both practical implementation strategies and theoretical development in this area.
3. Research methodology
3.1 Unit of analysis and unit of observation
To fill the corresponding knowledge gap, this study adopts an exploratory method which allows us to address the mentioned research question. A joint empirical approach and quantitative methodology are employed in this study in which the quantitative method is mainly used for collecting and analysing data (Percy et al., 2015). The study adopts an exploratory approach, combining empirical and quantitative methods (Percy et al., 2015), with data collected through face-to-face or online interviews to enhance reliability and depth of responses (Merriam and Tisdell, 2015). Participants were Australian retail managers responsible for inventory, logistics, and supply chain operations, selected for their holistic perspective on processes and policies (Kim and Daniel, 2020). Interviews followed a structured protocol, including pre-defined open-ended and pairwise comparison questions to capture the perceived influence of barriers to Industry 4.0 adoption. Example questions included:
“Which barriers do you perceive as most critical to adopting Industry 4.0 technologies in your inventory management system?”
“How does Barrier A influence Barrier B in terms of operational or strategic impact?”
Ethical approval was obtained from the University of Adelaide, and all participants provided informed consent. Confidentiality was ensured by assigning unique identifiers to each participant, and all data were securely stored.
3.1.1 IoT
Australian retailers are considered as the unit of analysis. These units include inventory, logistics, and supply chain managers along with inventory, logistics, and supply chain planners. This study chooses managers as the primary source for observation which aligns with the study conducted by (Kim and Daniel, 2020) due to their holistic perspective on policies and procedures.
3.2 Quantitative approach
Information about retail companies in Australia is freely available through the Australian Bureau of Statistics (ABS) distributing website (Australian Bureau of Statistics (abs.gov.au). On this website, different retailing companies are classified as follows:
Household goods retailing
Food retailing
Cafes and food services
Clothing and personal accessories
Department stores
Other retailing companies
Quota sampling which is a non-probability purposing sampling methodology is selected as the main sampling approach in this study. This methodology which generates a non-random basis for sample selection using sample characteristics is more flexible in selecting a minimum number of participants instead of a fixed number (Saunders, 2014). The selection quota for this study is based on the business size (financial turnover and number of employees) and considered three to five participants from each of the retailing companies which are in the top five in terms of business size. Therefore, selected participants represent the managerial positions that are related to inventory management activities (e.g. directors, executives, etc.). Based on the proposed sampling process, only the companies that demonstrated their push towards implementing industry 4.0 technologies in inventory management are selected. Their performance in this implementation can be verified through accessible performance reports, corporate websites, and third-party reports. Due to creating rapport and having a natural encounter with participants, using face-to-face interviews is believed to be the most effective way to get information. This is significant because this study has empirically collected experts’ perspectives on the implication of industry 4.0 in inventory operations which is a novel phenomenon in retailing industries. Thus, the nature of open-ended nature of semi-structured questions allows more freedom to explore the experts’ opinion.
To design semi-structured interviews (SSIs), the methodology developed by Newcomer et al. (2015) is used in this study. One of the advantages of this semi-structured is that enough time is assigned to each participant and a shorthand system, quotation marks, and audio recording are necessary while taking notes from the interview. The confidentiality of the interviews should be clarified for the participants, and they should be aware of the reason for their participation. Interviewers should understand how questions are developed, and more investigations are needed in which areas. The interviews start with a short introduction to inform the participants about each topic and make them sure that they have enough time to respond to each question. Also, they are reminded that they can leave the interview at any time.
In the next section, five questions are proposed to collect information from the participants based on their perceived knowledge of the subject and the size of operations they conduct. The questions are designed open-ended to let participants provide as much information as they want and compare each barrier to implement industry 4.0 with other barriers through a comparison matrix. Participants separately compare the influence of each barrier with another using a scale of 0–3 in which 0 shows no influence and 3 shows the highest perceived influence. In a case where participants are not sure if two barriers affect each other, they can choose “P” which means a “probability” of influence with an unknown degree. Thirteen comparison matrices are recommended in the questionnaire to find the impact of each barrier on others. Finally, two questions allow participants to give their opinion on the topic. The first one is to find the barriers that have not been identified by participants and the second one measures the degree of impact of barriers on each other.
A well-planned approach is used to improve the quality of outcomes from the interviews. In this regard, four areas of preparation including flow, format, length, and quality become important. This approach helps the interviewees shape a general idea of the problem. None of the participants should feel like they are being interrogated during the interview and interrupting the participants is not acceptable.
The designed questionnaire consists of 13 comparison matrices in which the barriers to employing industry 4.0 technologies in the inventory management sector are discussed. The impact of each barrier on each other is also explored based on the participants’ opinion and five scores measures the dependence level of each of these barriers on others summarized in Table 1.
Barrier dependence level
| Dependence level | Definition |
|---|---|
| 0 | No relations |
| 1 | Weak |
| 2 | Medium |
| 3 | Strong |
| P | Probable |
This approach is performed continuously, and the results are shown in the next section. Eventually, two questions are proposed to probe into the participants’ point of view: the first question indicates the barriers that might have not been identified by this study when investigating the application if industry 4.0 technologies in retail industries on inventory management; and the second question asks about possible solutions that experts offer to overcome these barriers. All interviews were separately transcribed, and the documents were sent to corresponding participants to ensure the accuracy of the collected information.
According to the ambiguity of the barriers, a combination of interpretative structural modelling (ISM) model along with MICMAC analysis is proposed (Janes, 1988). The reason for choosing this research methodology is that this approach is capable of finding a compound association between different elements which can be used for finding a multi-tier structure of these barriers and the interrelationship (Singh et al., 2007). Besides, the ISM method quantifies qualitative data based on the judgement of participants and the final output of this approach is a relationship diagram that answers the first and third research questions. MICMAC analysis is also applied to identify the drive and dependence power of barriers identified in the literature and can be used as a complementary approach for ISM to make barriers evident (Khurana et al., 2010; Kumar and Sharma, 2018).
3.2.1 Interpretive structural modelling (ISM)
.ISM is a technique for analysing contextual interrelationships between different elements of a system which is first used by (Warfield, 1974) to break down a problem into smaller subproblems. ISM can be used to examine numerous direct and indirect variables that affect the system and clarify the significance, risks, and order of elements within a system. Participants’ bias is something that is not considered in this method and is a limitation of this approach which can affect the outcome of the analysis. In a study conducted by (Singh et al., 2007), the main features of ISM are described as follows.
It is an interpretive technique based on experts’ opinions.
It is considered a modelling technique due to using diagrams for representing the relationship and linkages.
It simplifies a complex system.
Its structural model provides and interprets links and nodes.
Six steps are proposed to use the ISM methodology in practice (Gupta and Jain, 2020).
Notations used to represent the relationship between barriers
| Notation | Representation |
|---|---|
| Barrier leads to barrier | |
| Barrier leads to barrier | |
| Barriers and facility ate each other | |
| There is no relation between barriers and |
Barrier identification: Barriers to applying industry 4.0 technologies in inventory management and their interrelationship should be identified. Interviews are conducted for this purpose.
Developing contextual relationship: A pairwise comparison between identified barriers is proposed. To determine the contextual relationship between two barriers , four symbols are utilized in this study which can be summarized in Table 2
Building reachability matrix: This matrix is constructed based on SSIM. In this step, the transitivity rule is checked to ensure that the reachability matrix follows a logical pattern of finding relationships among barriers. Thereafter, SSIM is translated into a matrix that undergoes arithmetic functions, and four relationships are turned into a binary matrix which is elaborated as follows.
If entry in SSIM is , then and entries in the reachability matrix are 1 and 0, respectively.
If entry in SSIM is , then and entries in the reachability matrix are 0 and 1, respectively.
If entry in SSIM is , then and entries in the reachability matrix are 1 and 1, respectively.
If entry in SSIM is , then and entries in the reachability matrix are 0 and 0, respectively.
Determining hierarchy of barriers: Final reachability matrixes are achieved by checking the transitivity rule and the transitivity rule is employed to determine the hierarchy of barriers based on participants’ presumptions. As it is mentioned before, ISM is trying to capture opinions and, in some cases, the participants may not accurately explain the consecutive relationships of barriers. Afterwards, level positioning is used to determine the hierarchy of barriers when antecedents and reachability of barriers are identified based on the final reachability matrix. Barriers on the top level of the hierarchy do not enable other barriers and each time a barrier gets categorized in a level of the hierarchy, it is removed from the next iteration. This process continuous until all barriers are assigned in the hierarchy.
Establishing a diagram of nodes and edges after implementing the transitivity rule
Transforming the diagram into and ISM model where nodes are replaced by statements.
3.2.2 Cross-impact matrix multiplication applied to classification (MICMAC)
While ISM represents direct barrier influence analysis, MICMAC analysis presents indirect relationships influencing the barriers. MICMAC analysis develops the driving power and dependence of system elements based on matrix multiplication properties. Matrices are initially squared which leads to obtaining the second matrix and this process iterates times to create interconnecting variables of th order. The process gets terminated when a stable state iteration of driving power and dependence power is achieved. The input matrix for MICMAC analysis is called direct matrix , which is created by analysing the final diagram for barriers. After self-multiplying matrix , a saturated state is reached and it this stage, matrix is the final indirect relationship matrix for MICMAC analysis. The dependence and driving rank of barriers can be obtained from the stabilized MICMAC matrix. This approach uses a simplified axis starting from zero in both (dependence power) and (driving power) dimensions to classify barriers into four clusters. The mentioned clusters are summarized as follows.
Cluster I. Autonomous barriers: These barriers have less driving power and dependence power, which means they are disconnected from the system.
Cluster II. Dependent barriers: These barriers have weak driving power but possess higher dependence. Therefore, it can be assumed that by eliminating barriers they rely on, they will also disappear.
Cluster III. Linkage barrier: These barriers have both strong driving power and dependence power. These barriers are unstable and influenced by lower-level barriers.
Cluster IV. Independent barriers: These barriers have strong driving power but weak independence. These are key barriers to the system and their lack of reliance on other barriers makes them independent.
In the next section, the process of data collection is elaborated to make use of the two methods mentioned in this section and develop a logical flow to answer all research questions.
4. Data analysis
The data collection was conducted with four participants, and a profile of each is summarised in Table 3. Initially, 14 companies were identified for the study. Within these companies, 40 candidates were contacted via email or LinkedIn messaging. Seven candidates declined the invitation in response to the first email, two candidates accepted and signed the consent form, and the remaining candidates did not respond. In the second round of contact, 31 candidates were followed up with to arrange meetings. During this period, while conducting the first two discussions, two additional candidates agreed to participate. One candidate requested a two-week delay due to being on annual leave. In total, four candidates ultimately participated in face-to-face or online meetings, rather than through email or other remote methods. Although this number was below the preferred sample size, it was still within an acceptable range for the purposes of this research. The participants represented three companies, each from a different sector within the retail industry. For confidentiality, each participant was assigned a number based on the order of their meetings.
Profile of participants
| Participant | Role | Date of interview | Experience | Relevance to the application of Industry 4.0 |
|---|---|---|---|---|
| 1 | Operations and sales manager | 12/05/2022 | 6 years in retailing | Involved in using RFID tags to identify and assort products |
| 2 | Store executive manager | 14/05/2022 | 3 years in sales management | Involved in planning and stock-keeping technologies such as ABC analysis |
| 3 | Store executive manager | 17/05/2022 | 9 years in warehouse management | Involved in SAP demand forecasting modules |
| 4 | Operations specialist | 27/05/2022 | 9 years in warehouse management | Involves cloud-based inventory systems that his company uses amongst its franchises |
We acknowledge the concern regarding the small sample size. The MICMAC method can be effectively applied with limited data (Kaladharan et al., 2024; Yu et al., 2023) because it relies on expert judgement and quantitative analysis to assess relationships between variables. Its strength lies in systematically identifying key drivers and dependencies within a system, even without large datasets, making it suitable for strategic planning and scenario building in contexts with limited data. We opted for quality over quantity by focusing on a smaller, yet varied, group of experts, allowing us to delve deeper into individual perspectives. By examining both similarities and disparities among these expert viewpoints, we aimed to avoid the pitfalls of relying solely on a consensus-based approach.
To construct the Structural Self-Interaction Matrix (SSIM) and reachability matrix, data from face-to-face or online interviews were systematically analysed. Experts assessed pairwise relationships between identified barriers, indicating directional influences. To enhance consistency and reduce individual bias, all responses were cross-verified across participants, and discrepancies were addressed through iterative clarification until consensus was reached. The SSIM was then converted into the initial reachability matrix following the standard Interpretive Structural Modelling (ISM) procedure, with transitivity checks applied to ensure logical consistency. To further strengthen validity, the emerging model was triangulated with insights from relevant literature, aligning expert judgements with prior empirical findings. These procedures ensured that, even with a relatively small sample size, the development of the SSIM and reachability matrix maintained internal consistency, methodological rigour, and theoretical validity.
The data obtained from the questionnaire is used to find the interrelationship between different barriers. ISM, which is an interactive learning methodology, is used to determine the relationship between different variables by designing a series of graphics and words. Later, the contextual relationship between different barriers is determined by participants. The mentioned relationships are defined as the influence of the barrier on barrier . These pairwise relationships are built using a structural self-interaction matrix (SSIM), and the influence of barriers is quantified. Different types of barriers to implementing Industry 4.0 in inventory management systems are summarized in Table 4.
Barriers to the application of Industry 4.0 in inventory systems
| Barrier number | Barrier |
|---|---|
| 1 | Financial constraints |
| 2 | Lack of management |
| 3 | Organizational inadaptability |
| 4 | Skill and training requirements |
| 5 | Lack of infrastructure and facilities |
| 6 | Cyber security issues |
| 7 | Legal complexities |
| 8 | Integration and interoperability |
| 9 | Lack of Coordination and collaboration |
| 10 | Unclear perception of benefits |
| 11 | Government reluctancy |
| 12 | Lack of R&D |
| 13 | Technological complications |
Although the study is based on a small number of expert participants, several measures were implemented to enhance the reliability and validity of the findings. Participants were carefully selected from diverse retail sub-sectors and managerial levels to capture a range of perspectives on barriers to Industry 4.0 adoption. Responses for the Structural Self-Interaction Matrix (SSIM) were systematically cross-verified across participants, and any discrepancies were resolved through iterative clarification until consensus was achieved. The ISM and MICMAC procedures were applied rigorously, including transitivity checks and systematic calculation of driving and dependence powers, providing a structured framework for analysing barrier relationships. These steps, along with transparent documentation of the methodology, ensured methodological rigour and internal consistency. The findings are exploratory and intended to provide initial insights, forming a foundation for future studies with larger samples.
SSIM matrix for all participants is shown in Table 5, which shows the interrelationship between different barriers in applying Industry 4.0 in inventory systems.
SSIM matrix for all participants
| Participant 1 | Participant 2 | ||||||||||||||||||||||||||
|---|---|---|---|---|---|---|---|---|---|---|---|---|---|---|---|---|---|---|---|---|---|---|---|---|---|---|---|
| Barriers | 13 | 12 | 11 | 10 | 9 | 8 | 7 | 6 | 5 | 4 | 3 | 2 | 1 | Barriers | 13 | 12 | 11 | 10 | 9 | 8 | 7 | 6 | 5 | 4 | 3 | 2 | 1 |
| 1 | V | V | O | O | X | V | A | V | V | V | A | A | 1 | X | X | A | A | A | V | X | X | V | X | V | X | ||
| 2 | V | V | O | V | V | V | V | V | V | V | V | 2 | O | V | O | X | X | X | V | V | V | X | X | ||||
| 3 | O | A | O | O | X | X | O | O | A | X | 3 | O | X | O | X | X | X | V | V | O | A | ||||||
| 4 | X | V | O | V | A | O | O | V | A | 4 | O | X | O | A | V | X | V | V | A | ||||||||
| 5 | X | X | X | X | X | V | V | V | 5 | V | X | A | A | V | V | O | O | ||||||||||
| 6 | A | A | X | O | X | X | X | 6 | X | A | V | O | O | O | X | ||||||||||||
| 7 | X | V | X | O | X | A | 7 | A | O | X | O | O | A | ||||||||||||||
| 8 | X | X | O | V | X | 8 | X | A | O | A | X | ||||||||||||||||
| 9 | V | A | O | X | 9 | A | V | O | X | ||||||||||||||||||
| 10 | V | V | V | 10 | O | X | O | ||||||||||||||||||||
| 11 | O | O | 11 | X | A | ||||||||||||||||||||||
| 12 | X | 12 | A | ||||||||||||||||||||||||
| 13 | 13 | ||||||||||||||||||||||||||
| Participant 3 | Participant 4 | ||||||||||||||||||||||||||
| Barriers | 13 | 12 | 11 | 10 | 9 | 8 | 7 | 6 | 5 | 4 | 3 | 2 | 1 | Barriers | 13 | 12 | 11 | 10 | 9 | 8 | 7 | 6 | 5 | 4 | 3 | 2 | 1 |
| 1 | X | X | A | A | A | X | A | A | X | A | V | A | 1 | O | X | A | X | X | A | X | V | V | X | A | X | ||
| 2 | O | V | O | X | V | X | A | O | X | X | A | 2 | V | V | O | V | V | O | O | V | V | X | V | ||||
| 3 | X | O | A | O | X | O | V | A | X | V | 3 | O | X | O | O | V | V | A | A | A | X | ||||||
| 4 | O | X | A | X | X | A | V | V | A | 4 | X | X | O | X | X | X | O | V | X | ||||||||
| 5 | V | A | X | O | A | A | X | O | 5 | A | X | X | X | V | V | O | X | ||||||||||
| 6 | X | X | X | O | X | O | X | 6 | X | A | A | O | V | X | V | ||||||||||||
| 7 | A | O | X | A | X | A | 7 | X | X | X | X | A | V | ||||||||||||||
| 8 | V | X | O | X | V | 8 | A | V | O | A | V | ||||||||||||||||
| 9 | A | O | O | X | 9 | O | V | O | O | ||||||||||||||||||
| 10 | V | V | O | 10 | V | X | X | ||||||||||||||||||||
| 11 | X | V | 11 | X | X | ||||||||||||||||||||||
| 12 | X | 12 | X | ||||||||||||||||||||||||
| 13 | 13 | ||||||||||||||||||||||||||
Transitivity and reachability are two important rules in ISM analysis. In this regard, a reachability matrix is formed to represent how barriers affect one another and how far a barrier reaches others. The main difference between the reachability matrix and SSIM is the numerical binary nature of the reachability matrix, which allows mathematical calculations for the problem. SSIM is translated into binary values based on the transformation rule, which is presented in Table 6.
Initial reachability matrix of barriers
| Participant 1 | Participant 2 | ||||||||||||||||||||||||||
|---|---|---|---|---|---|---|---|---|---|---|---|---|---|---|---|---|---|---|---|---|---|---|---|---|---|---|---|
| Barriers | 1 | 2 | 3 | 4 | 5 | 6 | 7 | 8 | 9 | 10 | 11 | 12 | 13 | Barriers | 1 | 2 | 3 | 4 | 5 | 6 | 7 | 8 | 9 | 10 | 11 | 12 | 13 |
| 1 | 1 | 0 | 0 | 1 | 1 | 1 | 0 | 1 | 1 | 0 | 0 | 1 | 1 | 1 | 1 | 1 | 1 | 1 | 1 | 1 | 1 | 1 | 0 | 0 | 0 | 1 | 1 |
| 2 | 1 | 1 | 1 | 1 | 1 | 1 | 1 | 1 | 1 | 1 | 0 | 1 | 1 | 2 | 1 | 1 | 1 | 1 | 1 | 1 | 1 | 1 | 1 | 1 | 0 | 1 | 0 |
| 3 | 1 | 0 | 1 | 1 | 0 | 0 | 0 | 1 | 1 | 0 | 0 | 0 | 0 | 3 | 0 | 1 | 1 | 0 | 0 | 1 | 1 | 1 | 1 | 1 | 0 | 1 | 0 |
| 4 | 0 | 0 | 1 | 1 | 0 | 1 | 0 | 0 | 0 | 1 | 0 | 1 | 1 | 4 | 1 | 1 | 1 | 1 | 0 | 1 | 1 | 1 | 1 | 0 | 0 | 1 | 0 |
| 5 | 0 | 0 | 1 | 1 | 1 | 1 | 1 | 1 | 1 | 1 | 1 | 1 | 1 | 5 | 0 | 0 | 0 | 1 | 1 | 0 | 0 | 1 | 1 | 0 | 0 | 1 | 1 |
| 6 | 0 | 0 | 0 | 0 | 0 | 1 | 1 | 1 | 1 | 0 | 1 | 0 | 0 | 6 | 1 | 0 | 0 | 0 | 0 | 1 | 1 | 0 | 0 | 0 | 1 | 0 | 1 |
| 7 | 1 | 0 | 0 | 0 | 0 | 1 | 1 | 0 | 1 | 0 | 1 | 1 | 1 | 7 | 1 | 0 | 0 | 0 | 0 | 1 | 1 | 0 | 0 | 0 | 1 | 0 | 0 |
| 8 | 0 | 0 | 1 | 0 | 0 | 1 | 1 | 1 | 1 | 1 | 0 | 1 | 1 | 8 | 0 | 1 | 1 | 1 | 0 | 0 | 1 | 1 | 1 | 0 | 0 | 0 | 1 |
| 9 | 1 | 0 | 1 | 1 | 1 | 1 | 1 | 1 | 1 | 1 | 0 | 0 | 1 | 9 | 1 | 1 | 1 | 0 | 0 | 0 | 0 | 1 | 1 | 1 | 0 | 1 | 0 |
| ssss10 | 0 | 0 | 0 | 0 | 1 | 0 | 0 | 0 | 1 | 1 | 1 | 1 | 1 | 10 | 1 | 1 | 1 | 1 | 1 | 0 | 0 | 1 | 1 | 1 | 0 | 1 | 0 |
| 11 | 0 | 0 | 0 | 0 | 1 | 1 | 1 | 0 | 0 | 0 | 1 | 0 | 0 | 11 | 1 | 0 | 0 | 0 | 1 | 0 | 1 | 0 | 0 | 0 | 1 | 0 | 1 |
| 12 | 0 | 0 | 1 | 0 | 1 | 1 | 0 | 1 | 1 | 0 | 0 | 1 | 1 | 12 | 1 | 0 | 1 | 1 | 1 | 1 | 0 | 1 | 0 | 1 | 1 | 1 | 0 |
| 13 | 0 | 0 | 0 | 1 | 1 | 1 | 1 | 1 | 0 | 0 | 0 | 1 | 1 | 13 | 1 | 0 | 0 | 0 | 0 | 1 | 1 | 1 | 1 | 0 | 1 | 1 | 1 |
| Participant 3 | Participant 4 | ||||||||||||||||||||||||||
| Barriers | 1 | 2 | 3 | 4 | 5 | 6 | 7 | 8 | 9 | 10 | 11 | 12 | 13 | Barriers | 1 | 2 | 3 | 4 | 5 | 6 | 7 | 8 | 9 | 10 | 11 | 12 | 13 |
| 1 | 1 | 0 | 1 | 0 | 1 | 0 | 0 | 1 | 0 | 0 | 0 | 1 | 1 | 1 | 1 | 1 | 0 | 1 | 1 | 1 | 1 | 0 | 1 | 1 | 0 | 1 | 0 |
| 2 | 1 | 1 | 0 | 1 | 1 | 0 | 0 | 1 | 1 | 1 | 0 | 1 | 0 | 2 | 1 | 1 | 1 | 1 | 1 | 1 | 0 | 0 | 1 | 1 | 0 | 1 | 1 |
| 3 | 0 | 1 | 1 | 1 | 1 | 0 | 1 | 0 | 1 | 0 | 0 | 0 | 1 | 3 | 1 | 0 | 1 | 1 | 0 | 0 | 0 | 1 | 1 | 0 | 0 | 1 | 0 |
| 4 | 1 | 1 | 0 | 1 | 0 | 1 | 1 | 0 | 1 | 1 | 0 | 1 | 0 | 4 | 1 | 1 | 1 | 1 | 1 | 1 | 0 | 1 | 1 | 1 | 0 | 1 | 1 |
| 5 | 1 | 1 | 1 | 1 | 1 | 0 | 1 | 0 | 0 | 0 | 1 | 0 | 1 | 5 | 0 | 0 | 1 | 1 | 1 | 1 | 0 | 1 | 1 | 1 | 1 | 1 | 0 |
| 6 | 1 | 0 | 1 | 0 | 0 | 1 | 1 | 0 | 1 | 0 | 1 | 1 | 1 | 6 | 0 | 0 | 1 | 0 | 1 | 1 | 1 | 1 | 1 | 0 | 0 | 0 | 1 |
| 7 | 1 | 1 | 0 | 0 | 1 | 1 | 1 | 0 | 1 | 0 | 1 | 0 | 0 | 7 | 1 | 0 | 1 | 0 | 0 | 0 | 1 | 1 | 0 | 1 | 1 | 1 | 1 |
| 8 | 1 | 1 | 0 | 1 | 1 | 0 | 1 | 1 | 1 | 1 | 0 | 1 | 1 | 8 | 1 | 0 | 0 | 1 | 0 | 1 | 0 | 1 | 1 | 0 | 0 | 1 | 0 |
| 9 | 1 | 0 | 1 | 1 | 1 | 1 | 1 | 0 | 1 | 1 | 0 | 0 | 0 | 9 | 1 | 0 | 0 | 1 | 0 | 0 | 1 | 0 | 1 | 0 | 0 | 1 | 0 |
| 10 | 1 | 1 | 0 | 1 | 0 | 0 | 1 | 1 | 1 | 1 | 0 | 1 | 1 | 10 | 1 | 0 | 0 | 1 | 1 | 0 | 1 | 1 | 0 | 1 | 1 | 1 | 1 |
| 11 | 1 | 0 | 1 | 1 | 1 | 1 | 1 | 0 | 0 | 0 | 1 | 1 | 1 | 11 | 1 | 0 | 0 | 0 | 1 | 1 | 1 | 0 | 0 | 1 | 1 | 1 | 1 |
| 12 | 1 | 0 | 0 | 1 | 1 | 1 | 0 | 1 | 0 | 0 | 0 | 1 | 1 | 12 | 1 | 0 | 1 | 1 | 1 | 1 | 1 | 0 | 0 | 1 | 1 | 1 | 1 |
| 13 | 1 | 0 | 1 | 0 | 0 | 1 | 1 | 0 | 1 | 0 | 1 | 1 | 1 | 13 | 0 | 0 | 0 | 1 | 1 | 1 | 1 | 1 | 0 | 0 | 1 | 1 | 1 |
Note(s): *Guidance for transferring the SSIM matrix to binary values: If the (i,j) element of the SSIM matrix is V, then set (i, j) to 1 and (j, i) to 0; If the value is A, then set (i, j) to 0 and (j, i) to 1; If the value is X, then both (i, j) and (j, i) should be set to 1; If the value is O, then both (i, j) and (j, i) should be set to 0
Another rule applied in this process is the transitivity rule of ISM, which is used to determine the final reachability matrix. Checking for transitivity is important because ISM relies on expert opinions, which may sometimes be inconsistent. The final reachability matrix, after applying the transitivity rule, is calculated for all participants. The results for all participants are presented in Appendix 1, with an example for Participant 1 shown below in Table 7. The cells marked with stars indicate the entries that changed to 1 as a result of applying the transitivity rule.
Final reachability matrix after checking the transitivity
| Barriers | 1 | 2 | 3 | 4 | 5 | 6 | 7 | 8 | 9 | 10 | 11 | 12 | 13 | Driver power |
|---|---|---|---|---|---|---|---|---|---|---|---|---|---|---|
| 1 | 1 | 0 | 0 | 1 | 1 | 1 | 0 | 1 | 1 | 0 | 0 | 1 | 1 | 8 |
| 2 | 1 | 1 | 1 | 1 | 1 | 1 | 1 | 1 | 1 | 1 | 0 | 1 | 1 | 12 |
| 3 | 1 | 1* | 1 | 1 | 1* | 1* | 1* | 1 | 1 | 1* | 0 | 1* | 1* | 12 |
| 4 | 1* | 0 | 1 | 1 | 0 | 1 | 0 | 1 | 1 | 1 | 0 | 1* | 1* | 9 |
| 5 | 1* | 0 | 1 | 1 | 1 | 1 | 1 | 1 | 1 | 1 | 1 | 1 | 1 | 12 |
| 6 | 0 | 0 | 0 | 0 | 0 | 1 | 1 | 1 | 1 | 0 | 1 | 0 | 0 | 5 |
| 7 | 1 | 0 | 0 | 1* | 1 | 1 | 1 | 1* | 1 | 0 | 1 | 1 | 1 | 10 |
| 8 | 1* | 1* | 1 | 1* | 1* | 1 | 1 | 1 | 1 | 1 | 0 | 1 | 1 | 12 |
| 9 | 1 | 0 | 1 | 1 | 1 | 1 | 1 | 1 | 1 | 1 | 1* | 1* | 1 | 12 |
| 10 | 0 | 0 | 1* | 1* | 1 | 1* | 1* | 1* | 1 | 1 | 1 | 1 | 1 | 11 |
| 11 | 0 | 0 | 1* | 1* | 1 | 1 | 1 | 1* | 1* | 1* | 1 | 1* | 1* | 11 |
| 12 | 1* | 0 | 1 | 1* | 1 | 1 | 0 | 1 | 1 | 1* | 1* | 1 | 1 | 11 |
| 13 | 0 | 0 | 1* | 1 | 1 | 1 | 1 | 1 | 1* | 1* | 0 | 1 | 1 | 10 |
| Dependence | 9 | 3 | 10 | 12 | 11 | 13 | 10 | 13 | 13 | 10 | 7 | 12 | 12 |
The final reachability matrix is the base for drawing the hierarchy diagram of interconnectivity, which is the goal of ISM analysis; however, it is still not clear what barriers are antecedent to other barriers. When doing the level partitioning of the reachability matrix, the antecedent set includes the barrier and barriers that caused this barrier. The intersection set is barriers existing in both the antecedent set and reachability set. This process is repeated until all barriers have been allocated to a level. The level partitioning of the reachability matrix for the first participant is shown in Table 8. This matrix for the other three participants is proposed in Appendix 2.
Level partitioning of the reachability matrix
| Reachability set | Barriers | Reachability set | Antecedent set | Intersection set | Level |
|---|---|---|---|---|---|
| Iteration 1 | BA1 | 1,4,5,6,8,9,12,13 | 1,2,3,4,5,7,8,9,12 | 1,2,3,4,5,7,8,9,12 | I |
| BA2 | 1,2,3,4,5,6,7,8,9,10,12,13 | 2,3,8 | 2,3,8 | ||
| BA3 | 1,2,3,4,5,6,7,8,9,10,12,13 | 2,3,4,5,8,9,10,11,12,13 | 2,3,4,5,8,9,10,12,13 | ||
| BA4 | 1,3,4,6,8,9,10,12,13 | 1,2,3,4,5,7,8,9,10,11,12,13 | 1,3,4,8,9,10,12,13 | ||
| BA5 | 1,3,4,5,6,7,8,9,10,11,12,13 | 1,2,3,5,7,8,9,10,11,12,13 | 1,3,5,7,8,9,10,11,12,13 | ||
| BA6 | 6,7,8,9,11 | 1,2,3,4,5,6,7,8,9,10,11,12,13 | 6,7,8,9,11 | ||
| BA7 | 1,4,5,6,7,8,9,11,12,13 | 2,3,5,6,7,8,9,10,11,13 | 5,6,7,8,9,11,13 | ||
| BA8 | 1,2,3,4,5,6,7,8,9,10,12,13 | 1,2,3,4,5,6,7,8,9,10,11,12,13 | 1,2,3,4,5,6,7,8,9,10,12,13 | ||
| BA9 | 1,3,4,5,6,7,8,9,10,11,12,13 | 1,2,3,4,5,6,7,8,9,10,11,12,13 | 1,3,4,5,6,7,8,9,10,11,12,13 | ||
| BA10 | 3,4,5,6,7,8,9,10,11,12,13 | 2,3,4,5,8,9,10,11,12,13 | 3,4,5,8,9,10,11,12,13 | ||
| BA11 | 3,4,5,6,7,8,9,10,11,12,13 | 5,6,7,9,10,11,12 | 5,6,7,9,10,11,12 | ||
| BA12 | 1,3,4,5,6,8,9,10,11,12,13 | 1,2,3,4,5,7,8,9,10,11,12,13 | 1,3,4,5,8,9,10,11,12,13 | ||
| BA13 | 3,4,5,6,7,8,9,10,12,13 | 1,2,3,4,5,7,8,9,10,11,12,13 | 3,4,5,7,8,9,10,12,13 | ||
| Iteration 2 | BA1 | 1,4,5,12,13 | 1,2,3,4,5,7,12 | 1,4,5,12 | II |
| BA2 | 1,2,3,4,5,7,10,12,13 | 2,3 | 2,3 | ||
| BA3 | 1,2,3,4,5,7,10,12,13 | 2,3,4,5,10,11,12,13 | 2,3,4,5,10,12,13 | ||
| BA4 | 1,3,4,10,12,13 | 1,2,3,4,5,7,10,11,12,13 | 1,3,4,10,12,13 | ||
| BA5 | 1,3,4,5,7,10,11,12,13 | 1,2,3,5,7,10,11,12,13 | 1,3,5,7,10,12,13 | ||
| BA7 | 1,4,5,7,11,12,13 | 2,3,5,7,10,11,13 | 5,7,11,13 | ||
| BA10 | 3,4,5,7,10,11,12,13 | 2,3,4,5,10,11,12,13 | 3,4,5,10,11,12,13 | ||
| BA11 | 3,4,5,7,10,11,12,13 | 5,7,10,11,12 | 5,7,10,11,12 | ||
| BA12 | 1,3,4,5,10,11,12,13 | 1,2,3,4,5,7,10,11,12,13 | 1,3,4,5,10,11,12,13 | ||
| BA13 | 3,4,5,7,10,12,13 | 1,2,3,4,5,7,10,11,12,13 | 3,4,5,7,10,12,13 | ||
| Iteration 3 | BA1 | 1,5 | 1,2,3,5,7 | 1,5 | III |
| BA2 | 1,2,3,5,7,10 | 2,3 | 2,3 | ||
| BA3 | 1,2,3,5,7,10 | 2,3,5,10,11 | 2,3,5,10 | ||
| BA5 | 1,3,5,7,10,11 | 1,2,3,5,7,10,11 | 1,3,5,7,10,11 | ||
| BA7 | 1,5,7,11 | 2,3,5,7,10,11 | 5,7,11 | ||
| BA10 | 3,5,7,10,11 | 2,3,5,10,11 | 3,5,10,11 | ||
| BA11 | 3,5,7,10,11 | 5,7,10,11 | 5,7,10,11 | ||
| Iteration 4 | BA2 | 2,3,7,10 | 2,3 | 2,3 | IV |
| BA3 | 2,3,7,10 | 2,3,10,11 | 2,3,10 | ||
| BA7 | 7,11 | 2,3,7,10,11 | 7,11 | ||
| BA10 | 3,7,10,11 | 2,3,10,11 | 3,10,11 | ||
| BA11 | 3,7,10,11 | 7,10,11 | 7,10,11 | ||
| Iteration 5 | BA2 | 2,3,10 | 2,3 | 2,3 | V |
| BA3 | 2,3,10 | 2,3,10,11 | 2,3,10 | ||
| BA10 | 3,10,11 | 2,3,10,11 | 3,10,11 | ||
| BA11 | 3,10,11 | 10,11 | 10,11 | ||
| Iteration 6 | BA2 | 2 | 2 | 2 | VI |
| BA11 | 11 | 11 | 11 |
Table 9 summarises the number of direct influences reported by each participant for each barrier, capturing the essence of the SSIM and initial reachability matrices. Barriers with a higher number of direct influences, such as BA1 and BA2, indicate strong causal potential, suggesting they act as foundational drivers in the adoption of Industry 4.0 in inventory systems. In contrast, barriers with fewer direct influences appear more dependent, highlighting their reliance on other barriers to manifest their effects. Notably, differences across participant responses reveal variability in how barriers are perceived and prioritised, reflecting potential subjectivity in expert judgement. This variability underscores the need for cautious interpretation, as the hierarchical positioning of barriers may differ depending on individual perspectives rather than representing uniform systemic behaviour.
Number of direct influences per barrier across participants
| Barrier | Participant 1 | Participant 2 | Participant 3 | Participant 4 | Average |
|---|---|---|---|---|---|
| BA1 | 8 | 12 | 7 | 9 | 9 |
| BA2 | 12 | 10 | 9 | 7 | 9.5 |
| BA3 | 12 | 11 | 10 | 8 | 10.25 |
| BA4 | 9 | 8 | 8 | 9 | 8.5 |
| BA5 | 12 | 9 | 10 | 8 | 9.75 |
| BA6 | 5 | 6 | 6 | 5 | 5.5 |
| BA7 | 10 | 8 | 9 | 8 | 8.75 |
| BA8 | 12 | 10 | 7 | 8 | 9.25 |
| BA9 | 12 | 9 | 6 | 7 | 8.5 |
| BA10 | 11 | 9 | 8 | 9 | 9.25 |
| BA11 | 11 | 8 | 7 | 8 | 8.5 |
| BA12 | 11 | 9 | 6 | 8 | 8.5 |
| BA13 | 10 | 8 | 6 | 7 | 7.75 |
The obtained partition levels are used to draw ISM diagrams which are represented by arrows, nodes, and barrier numbers. In the elaborated diagram, only the transitive links and their interpretation is crucial are proposed in the diagram. The bottom level of the diagram is composed of the barriers with the highest partition level numbers and the diagram is filled upward until all barriers are stored in a designated level. Finally, for each barrier, the antecedent set is used to configure the inward arrows for each level barrier. The final ISM diagram for the barrier’s relationship determined by participants is drawn in Figure 1.
 Flowchart 1: The flowchart starts with two text boxes arranged horizontally at the bottom, labeled from left to right as follows: “B A 2” and “B A 11.” Two upward arrows from the “B A 2” and “B A 11” lead to the third and fourth text boxes labeled “B A 3” and “B A 10.” A double-headed horizontal arrow is present between “B A 3” and “B A 10.” An upward arrow from “B A 3” and “B A 10” leads to a fifth box labeled “B A 7.” Two upward arrows from “B A 7” lead to the sixth and seventh text boxes labeled “B A 1” and “B A 5.” A double-headed horizontal arrow is present between “B A 1” and “B A 5.” An upward arrow from “B A 1” leads to an eighth text box labeled “B A 4.” An upward arrow from “B A 5” leads to a ninth text box labeled “B A 13.” A tenth text box labeled “B A 12” is present between “B A 4” and “B A 13.” A double-headed horizontal arrow is present between “B A 4” and “B A 12.” A double-headed horizontal arrow is present between “B A 12” and “B A 13.” An upward arrow from “B A 4” leads to an eleventh text box labeled “B A 6.” An upward arrow from “B A 12” leads to a twelfth text box labeled “B A 8.” An upward arrow from “B A 13” leads to a thirteenth text box labeled “B A 9.” A double-headed horizontal arrow is present between “B A 6” and “B A 8.” A double-headed horizontal arrow is present between “B A 8” and “B A 9.” The caption reads “a. Final I S M diagram for barriers identified by participant 1.” Flowchart 2: The flowchart starts with six text boxes arranged vertically from bottom to top, connected by upward arrows and labeled as follows: “B A 9,” “B A 12,” “B A 11,” “B A 13,” “B A 10,” and “B A 11.” Two upward arrows from “B A 1” lead to the seventh and eighth text boxes labeled “B A 2” and “B A 3.” A double-headed horizontal arrow is present between “B A 2” and “B A 3.” Five upward arrows from “B A 2” and “B A 3” lead to the ninth, tenth, eleventh, twelfth, and thirteenth text boxes arranged horizontally and labeled from left to right as follows: “B A 4,” “B A 5,” “B A 6,” “B A 7,” and “B A 8.” The caption reads “b. Final I S M diagram for barriers identified by participant 2.” Flowchart 3: The flowchart starts with a first text box at the bottom labeled “B A 11.” Five upward arrows from “B A 11” lead to the second, third, fourth, fifth, and sixth text boxes arranged horizontally and labeled from left to right as follows: “B A 4,” “B A 2,” “B A 6,” “B A 9,” and “B 10.” Seven upward arrows from “B A 4,” “B A 2,” “B A 6,” “B A 9,” and “B 10” lead to the seventh, eighth, ninth, tenth, eleventh, twelfth, and thirteenth text boxes arranged horizontally and labeled from left to right as follows: “B A 3,” “B A 7,” “B A 8,” “B A 1,” “B A 13,” “B A 12,” and “B A 5.” The caption reads “c. Final I S M diagram for barriers identified by participant 3.” Flowchart 4: The flowchart starts with a first text box at the bottom labeled “B A 11.” Two upward arrows from “B A 11” lead to the second and third text boxes, arranged horizontally and labeled from left to right as follows: “B A 1” and “B A 2.” A double-headed horizontal arrow is present between “B A 1” and “B A 2.” Two upward arrows from “B A 1” and “B A 2” lead to the fourth and fifth text boxes arranged horizontally and labeled from left to right as follows: “B A 5” and “B A 13.” A double-headed horizontal arrow is present between “B A 5” and “B A 13.” Two upward arrows from “B A 5” and “B A 13” lead to the sixth and seventh text boxes, arranged horizontally and labeled from left to right as follows: “B A 3” and “B A 8.” A double-headed horizontal arrow is present between “B A 3” and “B A 8.” Six upward arrows from “B A 3” and “B A 8” lead to the eighth, ninth, tenth, eleventh, twelfth, and thirteenth text boxes arranged horizontally and labeled from left to right as follows: “B A 4,” “B A 6,” “B A 7,” “B A 9,” “B A 10,” and “B A 12.” The caption reads “d. Final I S M diagram for barriers identified by participant 4.”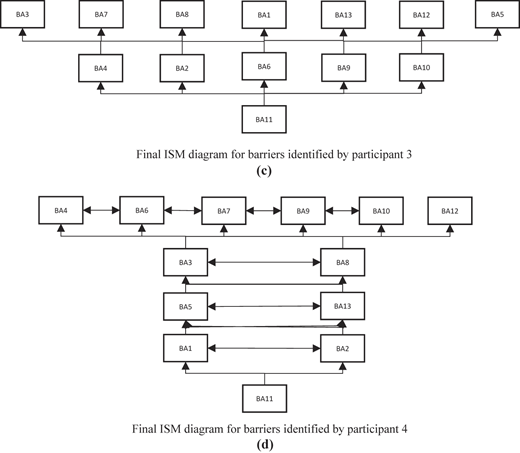
Final ISM diagram for barriers. Source: Authors’ own work
Flowchart 1: The flowchart starts with two text boxes arranged horizontally at the bottom, labeled from left to right as follows: “B A 2” and “B A 11.” Two upward arrows from the “B A 2” and “B A 11” lead to the third and fourth text boxes labeled “B A 3” and “B A 10.” A double-headed horizontal arrow is present between “B A 3” and “B A 10.” An upward arrow from “B A 3” and “B A 10” leads to a fifth box labeled “B A 7.” Two upward arrows from “B A 7” lead to the sixth and seventh text boxes labeled “B A 1” and “B A 5.” A double-headed horizontal arrow is present between “B A 1” and “B A 5.” An upward arrow from “B A 1” leads to an eighth text box labeled “B A 4.” An upward arrow from “B A 5” leads to a ninth text box labeled “B A 13.” A tenth text box labeled “B A 12” is present between “B A 4” and “B A 13.” A double-headed horizontal arrow is present between “B A 4” and “B A 12.” A double-headed horizontal arrow is present between “B A 12” and “B A 13.” An upward arrow from “B A 4” leads to an eleventh text box labeled “B A 6.” An upward arrow from “B A 12” leads to a twelfth text box labeled “B A 8.” An upward arrow from “B A 13” leads to a thirteenth text box labeled “B A 9.” A double-headed horizontal arrow is present between “B A 6” and “B A 8.” A double-headed horizontal arrow is present between “B A 8” and “B A 9.” The caption reads “a. Final I S M diagram for barriers identified by participant 1.” Flowchart 2: The flowchart starts with six text boxes arranged vertically from bottom to top, connected by upward arrows and labeled as follows: “B A 9,” “B A 12,” “B A 11,” “B A 13,” “B A 10,” and “B A 11.” Two upward arrows from “B A 1” lead to the seventh and eighth text boxes labeled “B A 2” and “B A 3.” A double-headed horizontal arrow is present between “B A 2” and “B A 3.” Five upward arrows from “B A 2” and “B A 3” lead to the ninth, tenth, eleventh, twelfth, and thirteenth text boxes arranged horizontally and labeled from left to right as follows: “B A 4,” “B A 5,” “B A 6,” “B A 7,” and “B A 8.” The caption reads “b. Final I S M diagram for barriers identified by participant 2.” Flowchart 3: The flowchart starts with a first text box at the bottom labeled “B A 11.” Five upward arrows from “B A 11” lead to the second, third, fourth, fifth, and sixth text boxes arranged horizontally and labeled from left to right as follows: “B A 4,” “B A 2,” “B A 6,” “B A 9,” and “B 10.” Seven upward arrows from “B A 4,” “B A 2,” “B A 6,” “B A 9,” and “B 10” lead to the seventh, eighth, ninth, tenth, eleventh, twelfth, and thirteenth text boxes arranged horizontally and labeled from left to right as follows: “B A 3,” “B A 7,” “B A 8,” “B A 1,” “B A 13,” “B A 12,” and “B A 5.” The caption reads “c. Final I S M diagram for barriers identified by participant 3.” Flowchart 4: The flowchart starts with a first text box at the bottom labeled “B A 11.” Two upward arrows from “B A 11” lead to the second and third text boxes, arranged horizontally and labeled from left to right as follows: “B A 1” and “B A 2.” A double-headed horizontal arrow is present between “B A 1” and “B A 2.” Two upward arrows from “B A 1” and “B A 2” lead to the fourth and fifth text boxes arranged horizontally and labeled from left to right as follows: “B A 5” and “B A 13.” A double-headed horizontal arrow is present between “B A 5” and “B A 13.” Two upward arrows from “B A 5” and “B A 13” lead to the sixth and seventh text boxes, arranged horizontally and labeled from left to right as follows: “B A 3” and “B A 8.” A double-headed horizontal arrow is present between “B A 3” and “B A 8.” Six upward arrows from “B A 3” and “B A 8” lead to the eighth, ninth, tenth, eleventh, twelfth, and thirteenth text boxes arranged horizontally and labeled from left to right as follows: “B A 4,” “B A 6,” “B A 7,” “B A 9,” “B A 10,” and “B A 12.” The caption reads “d. Final I S M diagram for barriers identified by participant 4.”Final ISM diagram for barriers. Source: Authors’ own work
Participant 1 believes that lack of management support and government reluctance are at the bottom level of the hierarchy, as these two barriers can give rise to other barriers. Similarly, Participants 3 and 4 also identify government reluctance as a foundational barrier, aligning with Participant 1's view. In contrast, Participant 2 considers lack of coordination and collaboration to be the lowest-level barrier in the hierarchy. Therefore, it is important to keep in mind that a barrier that is allocated to the bottom level does not mean that these barriers are the most impactful ones as they may cause other barriers to have more negative impacts in some cases. In this case, MICMAC analysis can be used to determine the driving power of each barrier.
When multiple variables exist in a system, the interrelationship between the variables can be interpreted considering direct and indirect relationships. Analysing direct relationships is performed by the ISM approach, and indirect relationships are analysed by MICMAC analysis to propose a more in-depth analysis of barriers. MICMAC is a method from linear algebra that produces a matrix by multiplying two matrices (Jothimani et al., 2015).
The first step in analysing the indirect relationship between the barriers is to generate a direct relationship matrix “A”, which is derived from the final ISM diagram. Here, the transitive relationship between the barriers is neglected, and diagonal elements of the matrix are changed to zero. The driving power of each barrier is determined by adding the number 1 in rows, and the dependence power is measured by adding the number 1 in columns. In this regard, if variable 1 affects variable 2 and variable 2 affects variable 3, then variable 1 affects variable 3 indirectly. These indirect relationships cannot be signified in the direct relationship matrix A. Therefore, matrix A is squared, and the second order of this matrix is generated. The new matrix is analysed to see if the order for driving power and dependence has changed. If so, this process is repeated, and matrix A is multiplied times to attain interconnecting variables of th order. This process stops when the th matrix approaches a stable state and driving power equals dependence power in the interaction and this process is called saturation.
Driving and dependence power scores are the most significant outcomes of MICMAC analysis. Dependence power indicates the degree to which a barrier relies on other barriers to show up. Meanwhile, driving power defines a barrier’s level of impact on other barriers. In order to find the elements of the indirect relationships’ matrix amongst barriers, ISM diagram arrows define the direct reachability for a barrier. Table 10 summarizes the direct relationships between barriers for participant 1. Similar tables are proposed for other participants in Appendix 2.
Direct relationships between barriers
| Barriers | 1 | 2 | 3 | 4 | 5 | 6 | 7 | 8 | 9 | 10 | 11 | 12 | 13 |
|---|---|---|---|---|---|---|---|---|---|---|---|---|---|
| 1 | 0 | 0 | 0 | 1 | 1 | 0 | 0 | 0 | 0 | 0 | 0 | 0 | 0 |
| 2 | 0 | 0 | 1 | 0 | 0 | 0 | 0 | 0 | 0 | 0 | 0 | 0 | 0 |
| 3 | 0 | 0 | 0 | 0 | 0 | 0 | 1 | 0 | 0 | 1 | 0 | 0 | 0 |
| 4 | 0 | 0 | 0 | 0 | 0 | 1 | 0 | 0 | 0 | 0 | 0 | 1 | 0 |
| 5 | 1 | 0 | 0 | 0 | 0 | 0 | 0 | 0 | 0 | 0 | 0 | 0 | 1 |
| 6 | 0 | 0 | 0 | 0 | 0 | 0 | 0 | 1 | 0 | 0 | 0 | 0 | 0 |
| 7 | 1 | 0 | 0 | 0 | 1 | 0 | 0 | 0 | 0 | 0 | 0 | 0 | 0 |
| 8 | 0 | 0 | 0 | 0 | 0 | 1 | 0 | 0 | 1 | 0 | 0 | 0 | 0 |
| 9 | 0 | 0 | 0 | 0 | 0 | 0 | 0 | 1 | 0 | 0 | 0 | 0 | 0 |
| 10 | 0 | 0 | 1 | 0 | 0 | 0 | 1 | 0 | 0 | 0 | 0 | 0 | 0 |
| 11 | 0 | 0 | 0 | 0 | 0 | 0 | 0 | 0 | 0 | 1 | 0 | 0 | 0 |
| 12 | 0 | 0 | 0 | 1 | 0 | 0 | 0 | 1 | 0 | 0 | 0 | 0 | 1 |
| 13 | 0 | 0 | 0 | 0 | 0 | 0 | 0 | 0 | 1 | 0 | 0 | 1 | 0 |
The matrix mentioned in Table 10 is multiplied n times until it reaches the saturation state for both driving and dependence powers. The matrix which has a stabilized dependence and driving power is proposed in Table 11. Direct dependencies between barriers that are indicated by other participants are summarized in Appendix 3.
Driving power and dependence power ranks
| Barriers | ||||||||||||||
|---|---|---|---|---|---|---|---|---|---|---|---|---|---|---|
| Driving | Dependence | Driving | Dependence | Driving | Dependence | Driving | Dependence | Driving | Dependence | Driving | Dependence | Driving | Dependence | |
| 1 | 2 | 2 | 2 | 3 | 4 | 4 | 3 | 4 | 5 | 4 | 4 | 4 | 4 | 4 |
| 2 | 1 | 1 | 1 | 1 | 2 | 1 | 2 | 1 | 3 | 1 | 5 | 1 | 5 | 1 |
| 3 | 2 | 2 | 2 | 2 | 4 | 2 | 5 | 2 | 7 | 2 | 7 | 2 | 7 | 2 |
| 4 | 2 | 2 | 2 | 3 | 3 | 5 | 2 | 5 | 2 | 5 | 2 | 5 | 2 | 5 |
| 5 | 2 | 2 | 2 | 3 | 4 | 4 | 3 | 4 | 5 | 4 | 4 | 4 | 4 | 4 |
| 6 | 1 | 2 | 1 | 4 | 1 | 6 | 1 | 7 | 1 | 7 | 1 | 7 | 1 | 7 |
| 7 | 2 | 2 | 2 | 3 | 4 | 3 | 4 | 3 | 6 | 3 | 6 | 3 | 6 | 3 |
| 8 | 2 | 3 | 1 | 5 | 1 | 7 | 1 | 8 | 1 | 8 | 1 | 8 | 1 | 8 |
| 9 | 1 | 2 | 1 | 4 | 1 | 6 | 1 | 7 | 1 | 7 | 1 | 7 | 1 | 7 |
| 10 | 2 | 2 | 2 | 2 | 4 | 2 | 5 | 2 | 7 | 2 | 7 | 2 | 7 | 2 |
| 11 | 1 | 1 | 1 | 1 | 2 | 1 | 2 | 1 | 3 | 1 | 5 | 1 | 5 | 1 |
| 12 | 3 | 2 | 3 | 3 | 5 | 5 | 4 | 6 | 4 | 6 | 3 | 6 | 3 | 6 |
| 13 | 2 | 2 | 2 | 3 | 3 | 5 | 2 | 5 | 2 | 5 | 2 | 5 | 2 | 5 |
Table 10 is obtained using the ranking of the matrix dependency and driving power. The total dependence power of each barrier is calculated by summing up different column elements while the driving power is measured by summing up the row elements in Table 11. Thereafter, ranking the impact of barriers can be measured using the total value of driving or dependence power in comparison to other barriers. Indirect relationship matrix for the rest of the participants is proposed in Appendix 4.
Table 12 illustrates that have the same ranking for driving power and dependence power which indicates that is in the saturated state for indirect matrix . The results for driving power and dependence power for the rest of the participants are proposed in Appendix 7. Then, MICMAC analysis categorizes the barriers which are classified into four clusters as follows.
Indirect relationship matrix A10
| Barriers | Driving power | Rank | |||||||||||||
|---|---|---|---|---|---|---|---|---|---|---|---|---|---|---|---|
| 1 | 1 | 0 | 0 | 15 | 0 | 114 | 0 | 98 | 113 | 0 | 0 | 31 | 16 | 388 | 4 |
| 2 | 8 | 0 | 0 | 37 | 8 | 70 | 1 | 116 | 70 | 1 | 0 | 44 | 37 | 392 | 5 |
| 3 | 9 | 0 | 1 | 52 | 9 | 153 | 1 | 184 | 153 | 0 | 0 | 74 | 52 | 688 | 7 |
| 4 | 0 | 0 | 0 | 16 | 0 | 0 | 0 | 160 | 0 | 0 | 0 | 0 | 16 | 192 | 2 |
| 5 | 0 | 0 | 0 | 16 | 1 | 113 | 0 | 98 | 114 | 0 | 0 | 31 | 15 | 388 | 4 |
| 6 | 0 | 0 | 0 | 0 | 0 | 16 | 0 | 0 | 16 | 0 | 0 | 0 | 0 | 32 | 1 |
| 7 | 1 | 0 | 0 | 31 | 1 | 83 | 0 | 196 | 83 | 0 | 0 | 30 | 31 | 456 | 6 |
| 8 | 0 | 0 | 0 | 0 | 0 | 0 | 0 | 32 | 0 | 0 | 0 | 0 | 0 | 32 | 1 |
| 9 | 0 | 0 | 0 | 0 | 0 | 16 | 0 | 0 | 16 | 0 | 0 | 0 | 0 | 32 | 1 |
| 10 | 9 | 0 | 0 | 52 | 9 | 153 | 1 | 184 | 153 | 1 | 0 | 74 | 52 | 688 | 7 |
| 11 | 8 | 0 | 1 | 37 | 8 | 70 | 1 | 116 | 70 | 0 | 0 | 44 | 37 | 392 | 5 |
| 12 | 0 | 0 | 0 | 0 | 0 | 160 | 0 | 0 | 160 | 0 | 0 | 32 | 0 | 352 | 3 |
| 13 | 0 | 0 | 0 | 16 | 0 | 0 | 0 | 160 | 0 | 0 | 0 | 0 | 16 | 192 | 2 |
| Dependence power | 36 | 0 | 2 | 272 | 36 | 948 | 4 | 1,344 | 948 | 2 | 0 | 360 | 272 | ||
| Rank | 4 | 1 | 2 | 5 | 4 | 7 | 3 | 8 | 7 | 2 | 1 | 6 | 5 |
Cluster I. Autonomous barriers: Barriers that are detached from the whole system with low driving power and low dependence power.
Cluster II. Dependent barriers: Barriers with low driving power and strong dependence power. From the participant's point of view, these barriers can be eliminated if the antecedent’s barriers are eliminated.
Cluster III. Linkage barriers: Barriers with strong dependence power and driving power.
Cluster IV. Independent barriers: Barriers with strong driving power and weak dependence power are the most common variables of the system.
Indirect relationship matrix which is in the saturated state and is used for MICMAC analysis of barriers. The x and y axes of the MICMAC analysis chart show the driving power and dependence power of barriers. In order to divide this chart into four clusters, the maximum driving power and dependency power are rounded up to a higher value. Then, these maximum values are divided by two to show the midpoints of the graph. The maximum driving power is 688, which is rounded up to 700, and the maximum dependence power is 1,344, which is rounded up to 1,400. The nodes in Figure 2a–2d are labelled according to the ranking of each barrier from the survey responses of the four participants.
 All four graphs are divided into four quadrants. The bottom left quadrant is labeled “Cluster 1.” The bottom right quadrant is labeled “Cluster 2.” The top right quadrant is labeled “Cluster 3.” The top left quadrant is labeled “Cluster 4.” Graph 1: The horizontal axis has markings ranging from 0 to 1400 in increments of 200 units. The vertical axis has markings ranging from 0 to 700 in increments of 100 units. The points scattered in cluster 1, along with labels, are as follows: 13: (230, 195). The other label without a point is 4. The points scattered in cluster 2, along with labels, are as follows: 9: (960, 30); 8: (1360, 30). The other label without a point is 6. The points scattered in cluster 4, along with labels, are as follows: 3: (0, 700); 7: (0, 450); 2: (0, 390); 12: (380, 350). Other labels without points are 10, 11, 1, and 5. The caption reads “a. M I C M A C analysis of barriers for participant 1.” Graph 2: The horizontal axis has markings ranging from 0 to 2000 in increments of 500 units. The vertical axis has markings ranging from 0 to 1800 in increments of 200 units. The points scattered in cluster 1, along with labels, are as follows: 13: (0, 600); 11: (0, 350); 12: (0, 200); 9: (0, 100). The points scattered in cluster 2, along with labels, are as follows: 4: (1100, 200); 7: (1800, 300); 6: (2200, 350). Other labels without points are 8 and 5. The points scattered in cluster 4, along with labels, are as follows: 10: (0, 1000); 2: (0, 1550); 1: (0, 1800). The other label without a point is 3. The caption reads “b. M I C M A C analysis of barriers for participant 2.” Graph 3: The horizontal axis has markings ranging from 0 to 200 in increments of 50 units. The vertical axis has markings ranging from 0 to 350 in increments of 50 units. The points scattered in cluster 1, along with labels, are as follows: 4: (10, 110); 9: (20, 175). Other labels without points are 10 and 2. The points scattered in cluster 2, along with labels, are as follows: 5: (110, 10); 7: (165, 11); 13: (178, 12); 1: (180, 12). Other labels without points are 3, 12, and 8. The points scattered in cluster 4, along with labels, are as follows: 6: (22, 180); 11: (0, 330). The caption reads “c. M I C M A C analysis of barriers for participant 3.” Graph 4: The horizontal axis has markings ranging from 0 to 6000 in increments of 1000 units. The vertical axis has markings ranging from 0 to 4000 in increments of 500 units. The points scattered in cluster 1, along with labels, are as follows: 4: (2400, 200). The other label without a point is 12. The points scattered in cluster 2, along with labels, are as follows: 10: (4200, 250); 9: (5200, 260). Other points without labels are 6 and 8. The points scattered in cluster 4, along with labels, are as follows: 3: (100, 2490); 5: (0, 3000); 1: (0, 3500); 11: (0, 3700). Other points without labels are 8, 13, and 12. The caption reads “d. M I C M A C analysis of barriers for participant 4.”
MICMAC analysis of barriers. Source: Authors’ own work
All four graphs are divided into four quadrants. The bottom left quadrant is labeled “Cluster 1.” The bottom right quadrant is labeled “Cluster 2.” The top right quadrant is labeled “Cluster 3.” The top left quadrant is labeled “Cluster 4.” Graph 1: The horizontal axis has markings ranging from 0 to 1400 in increments of 200 units. The vertical axis has markings ranging from 0 to 700 in increments of 100 units. The points scattered in cluster 1, along with labels, are as follows: 13: (230, 195). The other label without a point is 4. The points scattered in cluster 2, along with labels, are as follows: 9: (960, 30); 8: (1360, 30). The other label without a point is 6. The points scattered in cluster 4, along with labels, are as follows: 3: (0, 700); 7: (0, 450); 2: (0, 390); 12: (380, 350). Other labels without points are 10, 11, 1, and 5. The caption reads “a. M I C M A C analysis of barriers for participant 1.” Graph 2: The horizontal axis has markings ranging from 0 to 2000 in increments of 500 units. The vertical axis has markings ranging from 0 to 1800 in increments of 200 units. The points scattered in cluster 1, along with labels, are as follows: 13: (0, 600); 11: (0, 350); 12: (0, 200); 9: (0, 100). The points scattered in cluster 2, along with labels, are as follows: 4: (1100, 200); 7: (1800, 300); 6: (2200, 350). Other labels without points are 8 and 5. The points scattered in cluster 4, along with labels, are as follows: 10: (0, 1000); 2: (0, 1550); 1: (0, 1800). The other label without a point is 3. The caption reads “b. M I C M A C analysis of barriers for participant 2.” Graph 3: The horizontal axis has markings ranging from 0 to 200 in increments of 50 units. The vertical axis has markings ranging from 0 to 350 in increments of 50 units. The points scattered in cluster 1, along with labels, are as follows: 4: (10, 110); 9: (20, 175). Other labels without points are 10 and 2. The points scattered in cluster 2, along with labels, are as follows: 5: (110, 10); 7: (165, 11); 13: (178, 12); 1: (180, 12). Other labels without points are 3, 12, and 8. The points scattered in cluster 4, along with labels, are as follows: 6: (22, 180); 11: (0, 330). The caption reads “c. M I C M A C analysis of barriers for participant 3.” Graph 4: The horizontal axis has markings ranging from 0 to 6000 in increments of 1000 units. The vertical axis has markings ranging from 0 to 4000 in increments of 500 units. The points scattered in cluster 1, along with labels, are as follows: 4: (2400, 200). The other label without a point is 12. The points scattered in cluster 2, along with labels, are as follows: 10: (4200, 250); 9: (5200, 260). Other points without labels are 6 and 8. The points scattered in cluster 4, along with labels, are as follows: 3: (100, 2490); 5: (0, 3000); 1: (0, 3500); 11: (0, 3700). Other points without labels are 8, 13, and 12. The caption reads “d. M I C M A C analysis of barriers for participant 4.”MICMAC analysis of barriers. Source: Authors’ own work
MICMAC analysis was applied to calculate the driving and dependence powers of all identified barriers, with the values averaged across participants. Driving power represents the extent to which a barrier influences other barriers, while dependence power indicates the extent to which a barrier is influenced by others. Based on these measures, barriers were categorised into four clusters: independent barriers (high driving, low dependence), linkage barriers (high driving, high dependence), dependent barriers (low driving, high dependence), and autonomous barriers (low driving, low dependence). The results, summarised in Table 13, indicate that barriers such as BA1, BA2, and BA3 consistently exhibit strong driving power, highlighting their systemic importance. These foundational barriers have the potential to trigger or amplify other barriers, suggesting that addressing them could have a significant impact on facilitating the implementation of Industry 4.0 in inventory systems.
Driving and dependence power of barriers
| Cluster | Barrier(s) | Driving power | Dependence power | Interpretation |
|---|---|---|---|---|
| Independent (high drive) | BA1, BA2, BA3, BA5 | 380–690 | 200–350 | Strong influence on other barriers |
| Linkage (high drive and dep) | BA7, BA10 | 450–690 | 300–700 | Critical systemic barriers |
| Dependent (low drive) | BA6, BA8, BA9 | 30–120 | 400–950 | Reliant on other barriers |
| Autonomous (low drive and dep) | BA12, BA13 | 30–50 | 30–360 | Relatively isolated barriers |
5. Discussion
Adopting Industry 4.0 technologies in retail inventory management requires substantial investment, structural changes, and organisational commitment. Retailers face multiple barriers that hinder the effective implementation of these technologies. This study identified 13 barriers specific to inventory systems and explored their interrelationships using a combination of semi-structured expert discussions and ISM-MICMAC analysis. Unlike previous studies that often focus on manufacturing or logistics sectors (Yadav et al., 2020; Agrawal et al., 2019) or consider single technologies in isolation, this research integrates multiple Industry 4.0 technologies, autonomous vehicles, IoT, AI, big data analytics, and blockchain, within the retail inventory context. The empirical approach provides practical insights that extend the largely theoretical or conceptual findings in prior literature.18- 30
5.1 Cluster I of barriers
Barriers with low dependence power and driving power are classified in this cluster. These barriers exhibit attributes out of line with other barriers and are disconnected from other barriers that can affect the adaptation of Industry 4.0 in inventory systems. Therefore, these barriers do not have a significant impact on implementing Industry 4.0 technologies in practice.
Seven barriers were classified in Cluster I, with “skill and training requirements” (Barrier 4) most frequently identified. This aligns with previous research suggesting that workforce readiness can be a lesser concern in early-stage or less complex Industry 4.0 applications (Erol et al., 2016; Bag et al., 2018). Discrepancies between reports and physical evidence, errors in purchase orders, delays, and returns are often tolerated in retail inventory operations, consistent with HR et al. (2020), who observed that operational teams gradually normalise such issues.
In this study, all four participants have experience in directing operational-level activities, which may explain why barriers like skill requirements appeared less critical—they observed relatively straightforward Industry 4.0 implementations. Nevertheless, these barriers merit further investigation in contexts with more advanced digital integration. Similarly, “lack of coordination and collaboration,” “lack of R&D,” and “technological complications” were identified by roughly half of the participants. Comparable findings in prior studies (Kmiecik, 2022; Rabelo et al., 2002) indicate that these barriers, while present, often have low driving power in retail environments where essential resources for data collection, transfer, storage, and generation are already established.
Retail organisations, which operate on low margins and high volumes, typically prioritise human resource allocation to activities directly impacting revenue and profit. Long-standing practices of commitment and information exchange also enhance collaboration in operational processes. Participants noted that growing competition has further strengthened these capabilities. The remaining barriers in Cluster I were identified by fewer than two participants, suggesting limited perceived importance in inhibiting Industry 4.0 adoption in retail inventory systems.
5.2 Cluster II of barriers
Cluster II barriers are plotted in the bottom right corner of the diagrams. Barriers in this cluster need support from other barriers to minimize the effect of Industry 4.0 adoption in retailers’ inventory management.
The barriers listed in Table 15 exhibit high dependence on other factors, meaning that addressing barriers with greater driving power can indirectly mitigate these dependent barriers. In this study, three of four participants identified “cybersecurity issues,” “legal complexities,” and “integration and interoperability” as dependent barriers. This finding is consistent with prior literature, which highlights that technical and regulatory challenges often arise as consequences of deeper organisational or financial constraints rather than as primary obstacles themselves (Rajput and Singh, 2019; Cimini et al., 2018; Ho et al., 2021).
Specifically, “integration and interoperability” reflects insufficient organisational readiness or enthusiasm for adopting Industry 4.0 technologies, aligning with previous studies that suggest a lack of standardisation and digital culture in organisations can exacerbate interoperability challenges (Müller, 2019; Raj et al., 2020). Similarly, barriers such as “lack of management support,” “unclear perception of benefits,” and “financial constraints” were identified as major drivers influencing the adoption process. This mirrors findings from Horváth and Szabó (2019) and Theorin et al. (2017), which emphasise that managerial commitment, financial resources, and perceived value are critical determinants of successful digital transformation.
Interestingly, participants perceived “legal complexities” as having limited direct impact on adopting Industry 4.0, which contrasts with some blockchain-focused studies in manufacturing and logistics (Ho et al., 2021; Etemadi et al., 2021) where regulatory concerns are often considered significant. This suggests that, in the retail inventory context examined here, organisational and financial factors play a more decisive role than regulatory issues in shaping adoption decisions. Overall, these findings reinforce the hierarchical relationship between driver and dependent barriers, illustrating how resolving high-driving barriers can facilitate the mitigation of downstream technical and regulatory challenges in Industry 4.0 implementation.
5.3 Cluster III barriers
Cluster III, representing barriers with both high driving and dependence power, was empty in this study, indicating that none of the identified barriers simultaneously act as major drivers and majorly dependent. This outcome aligns with other empirical studies on digital transformation in supply chains (Yadav et al., 2020; Agrawal et al., 2019), where barriers generally follow a cause-and-effect pattern—either generating downstream obstacles or arising as a consequence of other issues.
The absence of Cluster III barriers underscores that, in retail inventory systems, barriers are predominantly either highly dependent or highly influential, rather than both. This suggests that managerial and organisational factors, rather than technical or regulatory issues, primarily drive the adoption of Industry 4.0, consistent with prior research emphasizing the centrality of leadership and resource allocation in digital transformation (Gökalp et al., 2017; Ras et al., 2017).
5.4 Cluster IV of barriers
The absence of barriers in Cluster III indicates that participants perceive no barrier with both high driving power and high dependence. This suggests that in retail inventory systems, barriers primarily exhibit either high driving power or high dependence, rather than both simultaneously—a pattern consistent with prior studies in supply chain digital transformation, where barriers tend to follow a clear cause-and-effect relationship (Yadav et al., 2020; Agrawal et al., 2019).
Barriers in Cluster IV, identified as independent with high driving power and low dependence, are considered primary drivers in the adoption of Industry 4.0 technologies. These barriers are crucial because they influence other dependent barriers and significantly affect implementation outcomes, consistent with findings from Horváth and Szabó (2019) and Birkel et al. (2019), which highlight financial, organisational, and policy factors as key determinants in digital transformation success.
Figure 1 illustrates participants’ perspectives on barrier interactions. The first participant noted that “unclear perception of benefits” directly affects the driving power of financial constraints, while the second participant highlighted other barriers that similarly influence financial limitations. Financial constraints emerged as the most critical barrier hindering Industry 4.0 adoption in retail inventory systems, corroborating Theorin et al. (2017), which emphasise resource availability as a central factor in technology adoption.
“Organisational inadaptability” was consistently identified by all participants as a significant barrier, aligning with literature that links resistance to change and workload pressures to challenges in implementing digital technologies (Birkel et al., 2019; Ito et al., 2021). While the second participant viewed this barrier as a driver for other obstacles, the fourth participant considered it less influential compared with other Cluster IV barriers, reflecting the context-dependent nature of organisational readiness (Gökalp et al., 2017).
Similarly, “lack of management support” remains a critical challenge, as Industry 4.0 adoption requires changes across all organisational functions, including the introduction of new technological methods and processes. Such changes increase workload and may provoke resistance from staff, consistent with prior findings (Ras et al., 2017; Birkel et al., 2019). “Governmental reluctance” was also classified in Cluster IV, although MICMAC analysis indicates it has relatively lower driving power than other barriers in this cluster. Nevertheless, the third participant considered it among the most significant barriers, supporting studies highlighting the role of government policy and infrastructure in enabling or constraining Industry 4.0 adoption in inventory management (Horvat et al., 2018; Yadav et al., 2022).
Table 15 summarises the impact of Cluster IV barriers across all participants, demonstrating that addressing these high-driving barriers can facilitate the mitigation of dependent barriers and promote successful implementation of Industry 4.0 technologies in retail inventory systems.
5.5 Implications of data analysis
After conducting all the interviews, participants’ ideas are analysed using ISM and MICMAC analysis. ISM creates a general map of barrier interconnectivity while MICMAC analysis works as a complementary method for ISM using indirect barrier power and dependence power. The final score of each barrier is proposed in Table 17 which is a summary of Tables 14–16 (see Table 17).
Cluster I of barriers
| Barrier | Participant 1 | Participant 2 | Participant 3 | Participant 4 | Number of participants |
|---|---|---|---|---|---|
| 2 | 0 | 0 | 1 | 0 | 1 |
| 4 | 1 | 0 | 1 | 1 | 3 |
| 9 | 0 | 1 | 1 | 0 | 2 |
| 10 | 0 | 0 | 1 | 0 | 1 |
| 11 | 0 | 1 | 0 | 0 | 1 |
| 12 | 0 | 1 | 0 | 1 | 2 |
| 13 | 1 | 1 | 0 | 0 | 2 |
| No. of identified barriers | 2 | 4 | 4 | 2 |
Cluster II of barriers
| Barrier | Participant 1 | Participant 2 | Participant 3 | Participant 4 | Number of participants |
|---|---|---|---|---|---|
| 1 | 0 | 0 | 1 | 0 | 1 |
| 3 | 0 | 0 | 1 | 0 | 1 |
| 4 | 0 | 1 | 0 | 0 | 1 |
| 5 | 0 | 1 | 1 | 0 | 2 |
| 6 | 1 | 1 | 0 | 1 | 3 |
| 7 | 0 | 1 | 1 | 1 | 3 |
| 8 | 1 | 1 | 1 | 0 | 3 |
| 9 | 1 | 0 | 0 | 1 | 2 |
| 10 | 0 | 0 | 0 | 1 | 1 |
| 12 | 0 | 0 | 1 | 0 | 1 |
| 13 | 0 | 0 | 1 | 0 | 1 |
| Number of identified barriers | 3 | 5 | 7 | 4 |
Cluster IV barriers’ impact on all participants
| Barrier | Participant 1 | Participant 2 | Participant 3 | Participant 4 | Number of participants |
|---|---|---|---|---|---|
| 1 | 1 | 1 | 0 | 1 | 3 |
| 2 | 1 | 1 | 0 | 1 | 3 |
| 3 | 1 | 1 | 0 | 1 | 3 |
| 5 | 1 | 0 | 0 | 1 | 2 |
| 6 | 0 | 0 | 1 | 0 | 1 |
| 7 | 1 | 0 | 0 | 0 | 1 |
| 8 | 0 | 0 | 0 | 1 | 1 |
| 10 | 1 | 1 | 0 | 0 | 2 |
| 11 | 1 | 0 | 1 | 1 | 3 |
| 12 | 1 | 0 | 0 | 0 | 1 |
| 13 | 0 | 0 | 0 | 1 | 1 |
| Number of identified barriers | 8 | 4 | 2 | 7 |
Total number of barriers per cluster
| Barriers number | Barriers name | Cluster I | Cluster II | Cluster III | Cluster IV |
|---|---|---|---|---|---|
| 1 | Financial constraints | 0 | 1 | 0 | 3 |
| 2 | Lack of management | 1 | 0 | 0 | 3 |
| 3 | Organizational inadaptability | 0 | 1 | 0 | 3 |
| 4 | Skill and training requirements | 3 | 1 | 0 | 0 |
| 5 | Lack of infrastructure and facilities | 0 | 2 | 0 | 2 |
| 6 | Cyber security issues | 0 | 3 | 0 | 1 |
| 7 | Legal complexities | 0 | 3 | 0 | 1 |
| 8 | Integration and interoperability | 0 | 3 | 0 | 1 |
| 9 | Lack of Coordination and collaboration | 2 | 2 | 0 | 0 |
| 10 | Unclear perception of benefits | 1 | 1 | 0 | 2 |
| 11 | Government reluctancy | 1 | 0 | 0 | 3 |
| 12 | Lack of R&D | 2 | 1 | 0 | 1 |
| 13 | Technological complications | 2 | 1 | 0 | 1 |
5.6 Practical implementation
This study focuses on experts from five leading retail companies in Australia. The selection was based on availability and willingness to participate and aimed to capture informed perspectives from companies with substantial experience in Industry 4.0 adoption. We acknowledge that the small number of participants limits generalisability and may introduce expert bias. Accordingly, the findings are exploratory, and the managerial implications are indicative, derived from expert judgement to guide strategic reflection rather than prescribe actions for the entire sector. This approach aligns with the purpose of ISM–MICMAC, which emphasises uncovering systemic relationships among barriers rather than producing statistically representative results. Future studies with larger and more diverse panels are recommended to validate and extend these insights.
Despite these limitations, the findings offer practical guidance for implementing Industry 4.0 technologies in retail inventory management. Adopting these technologies provides strategic and operational benefits, enabling retailers to remain competitive in an increasingly digital and customer-centric marketplace. Key advantages include improved inventory accuracy and visibility, as technologies such as the Internet of Things (IoT), RFID, and big data analytics allow real-time tracking, reducing stockouts, overstocking, and associated carrying costs, and supporting more agile and lean inventory management. Additionally, these technologies enhance the customer experience by enabling personalised recommendations, seamless omnichannel interactions, and AI-driven customer support, fostering greater customer satisfaction and loyalty.
Operational efficiency is another significant benefit. Automation, robotics, and artificial intelligence streamline repetitive processes such as order fulfilment, warehousing, and checkout, leading to reduced labour costs and increased speed and accuracy. Furthermore, the use of predictive analytics and data-driven decision-making allows retailers to anticipate demand, optimise pricing strategies, and identify emerging market trends more effectively. Industry 4.0 technologies also support improved supply chain integration through tools like blockchain, IoT-enabled tracking, and cloud-based platforms, which enhance transparency, traceability, and coordination across all stakeholders.
Sustainability is increasingly important in retail, and Industry 4.0 technologies contribute by reducing energy consumption, minimising waste, and supporting efficient reverse logistics for returned goods. Smart sensors and data analytics can help monitor and optimise resource usage, aligning with environmental goals and consumer expectations. Moreover, digital technologies such as cloud computing and digital twins enable greater flexibility and resilience, allowing retailers to quickly adapt to disruptions or changes in consumer demand. Collectively, these advancements not only improve operational performance but also create a distinct competitive advantage, positioning early adopters as industry leaders in innovation and responsiveness. Several key areas must be addressed to ensure a successful transition.
The findings of this study highlight several critical considerations for the practical implementation of Industry 4.0 technologies in inventory management within the retail sector. One of the most prominent barriers identified is financial constraint, which emerged as an independent factor with minimal dependence on other barriers. This indicates that financial limitations exist irrespective of managerial or organisational readiness. Given the typically low profit margins in retail, large investments in advanced technologies may be deemed impractical unless accompanied by clear, short-term returns. Retailers, therefore, must adopt cautious and strategic financial planning to prioritise cost-effective solutions that deliver measurable value.
Equally important is the role of middle management in facilitating technology adoption. The study found that most participants were mid-level operations and inventory managers, suggesting that this group holds critical insights into the complexities of applying Industry 4.0 in practice. As such, empowering these managers through training in transformational leadership can improve their ability to lead change, manage resistance, and align teams with innovation goals. In many cases, the organisational inadaptability to new technologies stems from entrenched routines and outdated operational methods. Change management strategies must focus on enhancing flexibility, redesigning processes, and fostering a culture of innovation.
Participants also identified operational inconsistencies—such as incorrect purchase orders, delivery delays, and discrepancies between records and actual inventory—as issues that are often normalised in current practice. These inefficiencies contribute to underinvestment in staff development. Addressing these challenges requires targeted training and capacity building for inventory management personnel to reduce errors and prepare them for digital transformation. Furthermore, organisational resistance, particularly regarding increased cybersecurity demands and employee workload, poses another barrier. A phased implementation, supported by clear communication and user-friendly tools, can help mitigate resistance and promote acceptance.
Interestingly, legal complexities were not viewed as a major concern, as most of the data used in inventory management resides within company servers. This finding suggests that organisations should focus more on internal data governance and system integration than on external compliance hurdles. However, the study identified integration and interoperability as a barrier reflecting deeper issues, such as a lack of management support, vague understanding of potential benefits, and financial concerns. Overcoming this requires visible leadership commitment, evidence-based justification for investments, and transparent communication about expected outcomes.
While “lack of coordination and collaboration” was ranked as a low-impact barrier, participants acknowledged that information sharing, and relationship management are crucial to operational success in an increasingly competitive environment. Strengthening collaboration across departments and with supply chain partners can significantly improve the effectiveness of new technologies. Moreover, the barrier of unclear perception of benefits was noted by some participants, especially in relation to company-specific expectations. This highlights the need for retailers to establish clear performance metrics—such as improved forecasting, reduced waste, and faster turnaround times—to demonstrate the value of adopting Industry 4.0 technologies.
A notable barrier raised by multiple participants was government reluctance. In Australia, for example, government agencies have not provided sufficient support or guidance for retailers seeking to adopt these technologies, instead focusing on sectors like manufacturing. This policy gap creates uncertainty and deters investment. Retailers are encouraged to engage with industry associations and policymakers to advocate for tailored support, including funding schemes, training programmes, and sector-specific guidelines.
Importantly, retailers must ensure that any new technological solution is aligned with their existing capabilities. While Industry 4.0 tools are considered mature and ready for use, their success depends on whether they complement operational realities. Rather than copying competitors, firms should conduct internal assessments to select and customise technologies that address their specific inventory challenges.
Additional barriers raised by participants suggest areas for further consideration. These include the absence of standardised implementation guidelines, a general lack of urgency across organisations, and the persistence of transactional management styles that do not suit a tech-savvy workforce. The transition to Industry 4.0 requires leadership to adopt more adaptive, inclusive approaches and prioritise projects that are strategically aligned with organisational goals. Retailers should focus not only on what technologies to adopt, but also on how and why these innovations can transform their inventory systems for long-term competitiveness.
5.7 Solutions to overcome barriers to Industry 4.0 adoption
While identifying barriers is a critical first step, overcoming them is essential for the successful adoption of Industry 4.0 technologies in retail inventory management. Based on participant insights and support from the literature, several practical and strategic solutions are proposed.
A key recommendation from participants is the development of an industry-wide whitepaper aimed at enhancing the knowledge and capability of operations managers. This document would serve as a centralised source of standardised guidelines, offering clear and consistent practices that can be applied across all retail organisations. Such a resource would support decision-makers in navigating the complexities of digital transformation and provide a shared foundation for implementation efforts. To address financial constraints—identified as an independent and significant barrier—retailers are encouraged to explore government grants, tax incentives, and public funding programmes aimed at supporting digital innovation. In parallel, companies should consider adopting scalable, modular technologies that allow for incremental investment, reducing financial risk. Forming strategic partnerships or consortia with other retailers or technology providers can further distribute costs and share expertise.
Management commitment, often lacking in early stages of technological transformation, can be strengthened by building a strong business case. This should emphasise the long-term return on investment, competitive advantage, and operational improvements associated with Industry 4.0 technologies. Success stories from pilot projects and benchmarking against industry leaders can be effective tools for gaining executive buy-in and promoting internal support.
Organisational inadaptability remains a major barrier, especially for retailers still reliant on traditional operational methods. Participants suggested retraining middle managers in transformational leadership styles to help drive change from within. A change-ready culture can be fostered by involving employees in decision-making processes, implementing structured change management programmes, and promoting agile organisational structures that support innovation and adaptability.
Workforce readiness is another crucial area. Addressing the digital skills gap requires ongoing investment in training and development. Collaborating with educational institutions to design targeted programmes can help build a future-ready workforce capable of managing and optimising new technologies. Moreover, participants emphasised that any new technological initiatives should align closely with the organisation’s existing capabilities. This approach ensures that technology adoption complements rather than overwhelms current systems, leading to more sustainable outcomes.
The COVID-19 pandemic has also been seen as a catalyst for change, shifting professional mindsets towards greater acceptance of technological solutions. Retailers should leverage such momentum by prioritising digital transformation and integrating lessons learned from pandemic-related disruptions into future planning.
Further solutions include modernising legacy infrastructure through cloud-based or outsourced technologies to reduce capital expenditure. Cybersecurity concerns must be tackled proactively by developing robust frameworks aligned with national standards, training staff in cyber hygiene, and conducting regular system audits. Legal complexities should be managed by involving legal experts early in the process to ensure data protection, compliance, and regulatory alignment.
Technical challenges such as integration and interoperability can be addressed through the use of open standards, APIs, and partnerships with vendors offering compatible, Industry 4.0-compliant platforms. To enhance coordination and collaboration, forming cross-functional teams and participating in innovation forums are recommended, as is improving internal communication and supply chain integration.
In cases where the benefits of Industry 4.0 adoption are unclear, organisations should implement clear performance indicators, share real-world case studies, and highlight sector-specific success stories. These actions can help demonstrate tangible outcomes and reduce uncertainty among stakeholders.
To overcome government reluctance and policy gaps, retailers should engage in public-private dialogues and align their transformation efforts with broader national goals, such as economic development or sustainability. Advocating for targeted support, including funding and sector-specific guidelines, can also help bridge the gap.
Finally, the lack of internal research and development (R&D) should be addressed by allocating dedicated resources to innovation and collaborating with universities, research institutes, and startups. Retailers are also encouraged to begin with low-risk, high-impact pilot projects, supported by experienced consultants or technology providers, to build confidence and demonstrate early success.
Together, these solutions offer a multifaceted roadmap for overcoming the complex and interrelated barriers to Industry 4.0 adoption in the retail sector. They highlight the importance of strategic planning, stakeholder engagement, workforce development, and institutional support to enable a smooth and effective transition.
6. Conclusion
This paper conducted empirical research to identify the barriers to adopting industry 4.0 technologies in retailers’ inventory management. In this regard, three research questions are proposed in Section 1. After an extensive review of the corresponding literature, 5 industry 4.0 technologies and 13 barriers are identified. Thereafter, an analytical approach is employed through interviews that examine these technologies and barriers in Australian retail industries. A combination of ISM and MICMAC analysis is used for analysing the collected data to shed light on the barriers’ interrelationships, driving power, and dependence power.
In order to analyse the collected data, interviews are conducted which are based on a combination of comparison matrices and open-ended questions. It is shown that four barriers are identified as the most influential in adopting industry 4.0 technologies in inventory systems. These barriers are “financial constraints”, “lack of management”, “organizational inadaptability”, and “governmental reluctancy”. Financial constraints which are known as a driving barrier to a retailer’s profit margin do not allow the company to invest in industry 4.0 technologies. The least consequential barrier recognized in this study is “skill and training requirements” because mistakes due to lack of skills are not being addressed accurately in inventory systems.
Two out of four participants identified “lack of infrastructure” and “unclear perception of benefits” as significant barriers which are classified in cluster IV of MICMAC analysis; however, further studies are required to determine a better realistic impact of the mentioned barriers on inventory systems. The effect of the rest of the barriers on inventory systems is considered different from the perspective of each participant. However, MICMAC analysis illustrated that cyber security issues, legal complexities, integration and interoperability, lack of coordination and collaboration, lack of R&D, and technological complications are the most important barriers which are classified in the first and second clusters.
The topic of this study is an emerging discussion as more companies uncover the potential of technology in operations. Similar to the manufacturing sector, this trend will receive more attention from government regulators, non-governmental organisations, and customers who expect better inventory-related performance from retailers. This study can assist retailers in implementing better practices in inventory systems as well as contributing to academic understanding. An empirical study on a variety of barriers to adopting industry 4.0 technologies has not been investigated before. The results obtained from data analysis show that retailers need to consider the interrelationship between barriers when adopting industry 4.0 technologies to improve their performance.
By analysing different industry 4.0 technologies, retailers develop an insight into which technology best fits their inventory system to increase the effectiveness of operations. After identifying the interrelationship between barriers, the retailer will be aware that from which barrier they should avoid. Lower-tier barriers which can trigger other barriers to happen, can be the main focus of retailers. Addressing these major barriers can help managers to improve inventory management operations within the company. For instance, due to the significance of financial constraints, managers can optimally assign resources before making use of technologies. Besides, disruptions due to implementing industry 4.0 technologies can be alleviated using a proper change management approach such as transformational leadership. This study also provides an argument for governmental authorities that can adjust rules that can facilitate the process of implementing technologies in practice.
This study has its limitations as well. First, this study identified barriers that are shortlisted in the literature but selecting the barriers and technologies has been done separately because no prior surveys have been proposed in the corresponding literature. Second, the sampling technique to identify the participants which is called quota sampling is limited in representing the sample as it involves predefined criteria in selecting the participants. A limited number of participants is another limitation of this study who all have a background in management and none of them came from planning or coordination departments. The data analysis method which uses a combination of ISM and MICMAC analysis relies on the experts’ opinions, while the data obtained from these methods can tamper with. Human bias can also be another factor that is not considered in the data collection process.
The future researcher can choose certain technologies such as IoT and blockchain to investigate the requirement of their receptive topic. Therefore, this study can act as a building block for deeper industry 4.0-related examination across different supply chains. The implementation of unmanned aerial vehicles (UAVs) in warehouses can be studied in future research works. This study can be also used for the application of small and middle-size enterprises (SMEs).
Appendix 1
Final reachability matrix after checking the transitivity for participants 2, 3, and 4
| Participant 2 | ||||||||||||||
|---|---|---|---|---|---|---|---|---|---|---|---|---|---|---|
| Barriers | 1 (j) | 2 | 3 | 4 | 5 | 6 | 7 | 8 | 9 | 10 | 11 | 12 | 13 | Driver power |
| 1 (i) | 1 | 1 | 1 | 1 | 1 | 1 | 1 | 1 | 0 | 0 | 0 | 1 | 1 | 10 |
| 2 | 1 | 1 | 1 | 1 | 1 | 1 | 1 | 1 | 1 | 1 | 0 | 1 | 0 | 11 |
| 3 | 0 | 1 | 1 | 1* | 1* | 1 | 1 | 1 | 1 | 1 | 0 | 1 | 0 | 10 |
| 4 | 1 | 1 | 1 | 1 | 1* | 1 | 1 | 1 | 1 | 1* | 0 | 1 | 1* | 12 |
| 5 | 0 | 0 | 0 | 1 | 1 | 1* | 1* | 1 | 1 | 0 | 0 | 1 | 1 | 8 |
| 6 | 1 | 1* | 1* | 1* | 1* | 1 | 1 | 1* | 0 | 0 | 1 | 0 | 1 | 10 |
| 7 | 1 | 1* | 1* | 1* | 1* | 1 | 1 | 1* | 0 | 0 | 1 | 0 | 1* | 10 |
| 8 | 1* | 1 | 1 | 1 | 1* | 1* | 1 | 1 | 1 | 1* | 1* | 1* | 1 | 13 |
| 9 | 1 | 1 | 1 | 1* | 1* | 1* | 1* | 1 | 1 | 1 | 1 | 1 | 1 | 13 |
| 10 | 1 | 1 | 1 | 1 | 1 | 1* | 1* | 1 | 1 | 1 | 0 | 1 | 0 | 11 |
| 11 | 1 | 1* | 1* | 1* | 1 | 1* | 1 | 1* | 0 | 0 | 1 | 0 | 1 | 10 |
| 12 | 1 | 1* | 1 | 1 | 1 | 1 | 1* | 1 | 0 | 1 | 1 | 1 | 1* | 12 |
| 13 | 1 | 1* | 1* | 1* | 1* | 1 | 1 | 1 | 1 | 1* | 1 | 1 | 1 | 13 |
| Dependence | 11 | 12 | 12 | 13 | 13 | 13 | 13 | 13 | 8 | 8 | 7 | 10 | 10 | |
| Participant 3 | ||||||||||||||
| Barriers | 1 (j) | 2 | 3 | 4 | 5 | 6 | 7 | 8 | 9 | 10 | 11 | 12 | 13 | Driver power |
| 1 (i) | 1 | 1* | 1 | 1* | 1 | 1* | 1* | 1 | 1* | 1* | 1* | 1 | 1 | 13 |
| 2 | 1 | 1 | 1* | 1 | 1 | 1* | 1* | 1 | 1 | 1 | 1* | 1 | 1* | 13 |
| 3 | 1* | 1 | 1 | 1 | 1 | 0 | 1 | 1* | 1 | 0 | 1* | 1* | 1 | 11 |
| 4 | 1 | 1 | 1* | 1 | 1* | 1 | 1 | 1* | 1 | 1 | 0 | 1 | 1* | 12 |
| 5 | 1 | 1 | 1 | 1 | 1 | 0 | 1 | 1* | 0 | 0 | 1 | 1* | 1 | 10 |
| 6 | 1 | 1* | 1 | 1* | 1* | 1 | 1 | 1* | 1 | 1* | 1 | 1 | 1 | 13 |
| 7 | 1 | 1 | 1* | 0 | 1 | 1 | 1 | 1* | 1 | 0 | 1 | 1* | 1* | 11 |
| 8 | 1 | 1 | 1* | 1 | 1 | 0 | 1 | 1 | 1 | 1 | 0 | 1 | 1 | 11 |
| 9 | 1 | 1* | 1 | 1 | 1 | 1 | 1 | 1* | 1 | 1 | 0 | 1* | 1* | 12 |
| 10 | 1 | 1 | 1* | 1* | 1* | 1* | 1* | 1 | 1 | 1 | 0 | 1 | 1 | 12 |
| 11 | 1 | 1* | 1 | 1 | 1 | 1 | 1 | 1* | 1* | 1* | 1 | 1 | 1 | 13 |
| 12 | 1 | 0 | 1* | 1 | 1 | 1 | 1 | 1 | 1* | 1* | 0 | 1 | 1 | 11 |
| 13 | 1 | 1* | 1 | 1* | 1* | 1 | 1 | 1* | 1 | 0 | 1 | 1 | 1 | 12 |
| Dependence | 13 | 12 | 13 | 12 | 13 | 10 | 13 | 13 | 12 | 9 | 8 | 13 | 13 | |
| Participant 4 | ||||||||||||||
| Barriers | 1 (j) | 2 | 3 | 4 | 5 | 6 | 7 | 8 | 9 | 10 | 11 | 12 | 13 | Driver power |
| 1 (i) | 1 | 1 | 1* | 1 | 1 | 1 | 1 | 1* | 1 | 1 | 1* | 1 | 1* | 13 |
| 2 | 1 | 1 | 1 | 1 | 1 | 1 | 1* | 1* | 1 | 1 | 0 | 1 | 1 | 12 |
| 3 | 1 | 1* | 1 | 1 | 1* | 1* | 1* | 1 | 1 | 1* | 0 | 1 | 0 | 11 |
| 4 | 1 | 1 | 1 | 1 | 1 | 1 | 1* | 1 | 1 | 1 | 0 | 1 | 1 | 12 |
| 5 | 1* | 0 | 1 | 1 | 1 | 1 | 1* | 1 | 1 | 1 | 1 | 1 | 1* | 12 |
| 6 | 1* | 0 | 1 | 1* | 1 | 1 | 1 | 1 | 1 | 1* | 1* | 1* | 1 | 12 |
| 7 | 1 | 1* | 1 | 1* | 1* | 1* | 1 | 1 | 1* | 1 | 1 | 1 | 1 | 13 |
| 8 | 1 | 1* | 1* | 1 | 0 | 1 | 1* | 1 | 1 | 1* | 0 | 1 | 1* | 11 |
| 9 | 1 | 1* | 1* | 1 | 1* | 1* | 1 | 1* | 1 | 1* | 0 | 1 | 1* | 12 |
| 10 | 1 | 1* | 0 | 1 | 1 | 1* | 1 | 1 | 1* | 1 | 1 | 1 | 1 | 12 |
| 11 | 1 | 1* | 0 | 1* | 1 | 1 | 1 | 0 | 1* | 1 | 1 | 1 | 1 | 11 |
| 12 | 1 | 1* | 1 | 1 | 1 | 1 | 1 | 0 | 1* | 1 | 1 | 1 | 1 | 12 |
| 13 | 1* | 1* | 1* | 1 | 1 | 1 | 1 | 1 | 1* | 1* | 1 | 1 | 1 | 13 |
| Dependence | 13 | 11 | 11 | 13 | 12 | 13 | 13 | 11 | 13 | 13 | 8 | 13 | 12 | |
Appendix 2
Partitioning of the reachability matrix for participant 2
| Iteration | Barrier | Reachability set | Antecedent set | Intersection set | Level |
|---|---|---|---|---|---|
| Iteration 1 | BA1 | 1,2,3,4,5,6,7,8,12,13 | 1,2,4,6,7,8,9,10,11,12,13 | 1,2,4,6,7,8,12,13 | I |
| BA2 | 1,2,3,4,5,6,7,8,9,10,12 | 1,2,3,4,6,7,8,9,10,11,12,13 | 1,2,3,4,6,7,8,9,10,12 | ||
| BA3 | 2,3,4,5,6,7,8,9,10,12 | 1,2,3,4,6,7,8,9,10,11,12,13 | 2,3,4,6,7,8,9,10,12 | ||
| BA4 | 1,2,3,4,5,6,7,8,9,10,12,13 | 1,2,3,4,5,6,7,8,9,10,11,12,13 | 1,2,3,4,5,6,7,8,9,10,12,13 | ||
| BA5 | 4,5,6,7,8,9,12,13 | 1,2,3,4,5,6,7,8,9,10,11,12,13 | 4,5,6,7,8,9,12,13 | ||
| BA6 | 1,2,3,4,5,6,7,8,11,13 | 1,2,3,4,5,6,7,8,9,10,11,12,13 | 1,2,3,4,5,6,7,8,11,13 | ||
| BA7 | 1,2,3,4,5,6,7,8,11,13 | 1,2,3,4,5,6,7,8,9,10,11,12,13 | 1,2,3,4,5,6,7,8,11,13 | ||
| BA8 | 1,2,3,4,5,6,7,8,9,10,11,12,13 | 1,2,3,4,5,6,7,8,9,10,11,12,13 | 1,2,3,4,5,6,7,8,9,10,11,12,13 | ||
| BA9 | 1,2,3,4,5,6,7,8,9,10,11,12,13 | 2,3,4,5,8,9,10,13 | 2,3,4,5,8,9,10,13 | ||
| BA10 | 1,2,3,4,5,6,7,8,9,10,12 | 2,3,4,8,9,10,12,13 | 2,3,4,8,9,10,12 | ||
| BA11 | 1,2,3,4,5,6,7,8,11,13 | 6,7,8,9,11,12,13 | 6,7,8,11,13 | ||
| BA12 | 1,2,3,4,5,6,7,8,10,11,12,13 | 1,2,3,4,5,8,9,10,12,13 | 1,2,3,4,5,8,10,12,13 | ||
| BA13 | 1,2,3,4,5,6,7,8,9,10,11,12,13 | 1,4,5,6,7,8,9,11,12,13 | 1,4,5,6,7,8,9,11,12,13 | ||
| Iteration 2 | BA1 | 1,2,3,12,13 | 1,2,9,10,11,12,13 | 1,2,12,13 | II |
| BA2 | 1,2,3,9,10,12 | 1,2,3,9,10,11,12,13 | 1,2,3,9,10,12 | ||
| BA3 | 2,3,9,10,12 | 1,2,3,9,10,11,12,13 | 2,3,9,10,12 | ||
| BA9 | 1,2,3,9,10,11,12,13 | 2,3,9,10,13 | 2,3,9,10,13 | ||
| BA10 | 1,2,3,9,10,12 | 2,3,9,10,12,13 | 2,3,9,10,12 | ||
| BA11 | 1,2,3,11,13 | 9,11,12,13 | 11,13 | ||
| BA12 | 1,2,3,10,11,12,13 | 1,2,3,9,10,12,13 | 1,2,3,10,12,13 | ||
| BA13 | 1,2,3,9,10,11,12,13 | 1,9,11,12,13 | 1,9,11,12,13 | ||
| Iteration 3 | BA1 | 1,12,13 | 1,9,10,11,12,13 | 1,12,13 | III |
| BA9 | 1,9,10,11,12,13 | 9,10,13 | 9,10,13 | ||
| BA10 | 1,9,10,12 | 9,10,12,13 | 9,10,12 | ||
| BA11 | 1,11,13 | 9,11,12,13 | 11,13 | ||
| BA12 | 1,10,11,12,13 | 1,9,10,12,13 | 1,10,12,13 | ||
| BA13 | 1,9,10,11,12,13 | 1,9,11,12,13 | 1,9,11,12,13 | ||
| Iteration 4 | BA9 | 9,10,11,12,13 | 9,10,13 | 9,10,13 | IV |
| BA10 | 9,10,12 | 9,10,12,13 | 9,10,12 | ||
| BA11 | 11,13 | 9,11,12,13 | 11,13 | ||
| BA12 | 10,11,12,13 | 9,10,12,13 | 10,12,13 | ||
| BA13 | 9,10,11,12,13 | 9,11,12,13 | 9,11,12,13 | ||
| Iteration 5 | BA9 | 9,11,12,13 | 9,13 | 9,13 | V |
| BA11 | 11,13 | 9,11,12,13 | 11,13 | ||
| BA12 | 11,12,13 | 9,12,13 | 12,13 | ||
| BA13 | 9,11,12,13 | 9,11,12,13 | 9,11,12,13 | ||
| Iteration 6 | BA9 | 9,11,12 | 9 | 9 | VI |
| BA11 | 11 | 9,11,12 | 11 | ||
| BA12 | 11,12 | 9,12 | 12 | ||
| Iteration 7 | BA9 | 9,12 | 9 | 9 | VII |
| BA12 | 12 | 9,12 | 12 | ||
| Iteration 8 | BA9 | 9 | 9 | 9 | VIII |
Partitioning of the reachability matrix for participant 3
| Iteration | Barrier | Reachability set | Antecedent set | Intersection set | Level |
|---|---|---|---|---|---|
| Iteration 1 | BA1 | 1,2,3,4,5,6,7,8,9,10,11,12,13 | 1,2,3,4,5,6,7,8,9,10,11,12,13 | 1,2,3,4,5,6,7,8,9,10,11,12,13 | I |
| BA2 | 1,2,3,4,5,6,7,8,9,10,11,12,13 | 1,2,3,4,5,6,7,8,9,10,11,13 | 1,2,3,4,5,6,7,8,9,10,11,13 | ||
| BA3 | 1,2,3,4,5,7,8,9,11,12,13 | 1,2,3,4,5,6,7,8,9,10,11,12,13 | 1,2,3,4,5,7,8,9,11,12,13 | ||
| BA4 | 1,2,3,4,5,6,7,8,9,10,12,13 | 1,2,3,4,5,6,8,9,10,11,12,13 | 1,2,3,4,5,6,8,9,10,12,13 | ||
| BA5 | 1,2,3,4,5,7,8,11,12,13 | 1,2,3,4,5,6,7,8,9,10,11,12,13 | 1,2,3,4,5,7,8,11,12,13 | ||
| BA6 | 1,2,3,4,5,6,7,8,9,10,11,12,13 | 1,2,4,6,7,9,10,11,12,13 | 1,2,4,6,7,9,10,11,12,13 | ||
| BA7 | 1,2,3,5,6,7,8,9,11,12,13 | 1,2,3,4,5,6,7,8,9,10,11,12,13 | 1,2,3,5,6,7,8,9,11,12,13 | ||
| BA8 | 1,2,3,4,5,7,8,9,10,12,13 | 1,2,3,4,5,6,7,8,9,10,11,12,13 | 1,2,3,4,5,7,8,9,10,12,13 | ||
| BA9 | 1,2,3,4,5,6,7,8,9,10,12,13 | 1,2,3,4,6,7,8,9,10,11,12,13 | 1,2,3,4,6,7,8,9,10,12,13 | ||
| BA10 | 1,2,3,4,5,6,7,8,9,10,12,13 | 1,2,4,6,8,9,10,11,12 | 1,2,4,6,8,9,10,12 | ||
| BA11 | 1,2,3,4,5,6,7,8,9,10,11,12,13 | 1,2,3,5,6,7,11,13 | 1,2,3,5,6,7,11,13 | ||
| BA12 | 1,3,4,5,6,7,8,9,10,12,13 | 1,2,3,4,5,6,7,8,9,10,11,12,13 | 1,3,4,5,6,7,8,9,10,12,13 | ||
| BA13 | 1,2,3,4,5,6,7,8,9,11,12,13 | 1,2,3,4,5,6,7,8,9,10,11,12,13 | 1,2,3,4,5,6,7,8,9,11,12,13 | ||
| Iteration 2 | BA2 | 2,4,6,9,10,11 | 2,4,6,9,10,11 | 2,4,6,9,10,11 | II |
| BA4 | 2,4,6,9,10 | 2,4,6,9,10,11 | 2,4,6,9,10 | ||
| BA6 | 2,4,6,9,10,11 | 2,4,6,9,10,11 | 2,4,6,9,10,11 | ||
| BA9 | 2,4,6,9,10 | 2,4,6,9,10,11 | 2,4,6,9,10 | ||
| BA10 | 2,4,6,9,10 | 2,4,6,9,10,11 | 2,4,6,9,10 | ||
| BA11 | 2,4,6,9,10,11 | 2,6,11 | 2,6,11 | ||
| Iteration 3 | BA11 | 11 | 11 | 11 | III |
Partitioning of the reachability matrix for participant 4
| Iteration | Barrier | Reachability set | Antecedent set | Intersection set | Level |
|---|---|---|---|---|---|
| Iteration 1 | BA1 | 1,2,3,4,5,6,7,8,9,10,11,12,13 | 1,2,3,4,7,8,9,10,11,12,13 | 1,2,3,4,7,8,9,10,11,12,13 | I |
| BA2 | 1,2,3,4,5,6,7,8,9,10,12,13 | 1,2,3,4,7,8,9,10,11,12,13 | 1,2,3,4,7,8,9,10,12,13 | ||
| BA3 | 1,2,3,4,5,6,7,8,9,10,12 | 1,2,3,4,5,6,7,8,9,12,13 | 1,2,3,4,5,6,7,8,9,12 | ||
| BA4 | 1,2,3,4,5,6,7,8,9,10,12,13 | 1,2,3,4,5,6,7,8,9,10,11,12,13 | 1,2,3,4,5,6,7,8,9,10,12,13 | ||
| BA5 | 1,3,4,5,6,7,8,9,10,11,12,13 | 1,2,3,4,5,6,7,9,10,11,12,13 | 1,3,4,5,6,7,8,10,11,12,13 | ||
| BA6 | 1,3,4,5,6,7,8,9,10,11,12,13 | 1,2,3,4,5,6,7,8,9,10,11,12,13 | 1,3,4,5,6,7,8,9,10,11,12,13 | ||
| BA7 | 1,2,3,4,5,6,7,8,9,10,11,12,13 | 1,2,3,4,5,6,7,8,9,10,11,12,13 | 1,2,3,4,5,6,7,8,9,10,11,12,13 | ||
| BA8 | 1,2,3,4,6,7,8,9,10,12,13 | 1,2,3,4,5,6,7,8,9,10,13 | 1,2,3,4,6,7,8,9,10,13 | ||
| BA9 | 1,2,3,4,5,6,7,8,9,10,12,13 | 1,2,3,4,5,6,7,8,9,10,11,12,13 | 1,2,3,4,5,6,7,8,9,10,12,13 | ||
| BA10 | 1,2,4,5,6,7,8,9,10,11,12,13 | 1,2,3,4,5,6,7,8,9,10,11,12,13 | 1,2,4,5,6,7,8,9,10,11,12,13 | ||
| BA11 | 1,2,4,5,6,7,9,10,11,12,13 | 1,5,6,7,10,11,12,13 | 1,5,6,7,10,11,12,13 | ||
| BA12 | 1,2,3,4,5,6,7,9,10,11,12,13 | 1,2,3,4,5,6,7,8,9,10,11,12,13 | 1,2,3,4,5,6,7,9,10,11,12,13 | ||
| BA13 | 1,2,3,4,5,6,7,8,9,10,11,12,13 | 1,2,4,5,6,7,8,9,10,11,12,13 | 1,2,4,5,6,7,8,9,10,11,12,13 | ||
| Iteration 2 | BA1 | 1,2,3,5,8,11,13 | 1,2,3,8,11,13 | 1,2,3,8,11,13 | II |
| BA2 | 1,2,3,5,8,13 | 1,2,3,8,11,13 | 1,2,3,8,13 | ||
| BA3 | 1,2,3,5,8 | 1,2,3,5,8,13 | 1,2,3,5,8 | ||
| BA5 | 1,3,5,8,11,13 | 1,2,3,5,11,13 | 1,3,5,11,13 | ||
| BA8 | 1,2,3,8,13 | 1,2,3,5,8,13 | 1,2,3,8,13 | ||
| BA11 | 1,2,5,11,13 | 1,5,11,13 | 1,5,11,13 | ||
| BA13 | 1,2,3,5,8,11,13 | 1,2,5,8,11,13 | 1,2,5,8,11,13 | ||
| Iteration 3 | BA1 | 1,2,5,11,13 | 1,2,11,13 | 1,2,11,13 | III |
| BA2 | 1,2,5,13 | 1,2,11,13 | 1,2,13 | ||
| BA5 | 1,5,11,13 | 1,2,5,11,13 | 1,5,11,13 | ||
| BA11 | 1,2,5,11,13 | 1,5,11,13 | 1,5,11,13 | ||
| BA13 | 1,2,5,11,13 | 1,2,5,11,13 | 1,2,5,11,13 | ||
| Iteration 4 | BA1 | 1,2,11 | 1,2,11 | 1,2,11 | IV |
| BA2 | 1,2 | 1,2,11 | 1,2 | ||
| BA11 | 1,2,11 | 1,11 | 1,11 | ||
| Iteration 5 | BA11 | 11 | 11 | 11 | V |
Appendix 3
Direct matrix “A” for participant 2
| Barriers | 1 | 2 | 3 | 4 | 5 | 6 | 7 | 8 | 9 | 10 | 11 | 12 | 13 |
|---|---|---|---|---|---|---|---|---|---|---|---|---|---|
| 1 | 0 | 1 | 1 | 0 | 0 | 0 | 0 | 0 | 0 | 0 | 0 | 0 | 0 |
| 2 | 0 | 0 | 1 | 1 | 1 | 1 | 1 | 1 | 0 | 0 | 0 | 0 | 0 |
| 3 | 0 | 1 | 0 | 1 | 1 | 1 | 1 | 1 | 0 | 0 | 0 | 0 | 0 |
| 4 | 0 | 0 | 0 | 0 | 1 | 0 | 0 | 0 | 0 | 0 | 0 | 0 | 0 |
| 5 | 0 | 0 | 0 | 1 | 0 | 1 | 0 | 0 | 0 | 0 | 0 | 0 | 0 |
| 6 | 0 | 0 | 0 | 0 | 1 | 0 | 1 | 0 | 0 | 0 | 0 | 0 | 0 |
| 7 | 0 | 0 | 0 | 0 | 0 | 1 | 0 | 1 | 0 | 0 | 0 | 0 | 0 |
| 8 | 0 | 0 | 0 | 0 | 0 | 0 | 1 | 0 | 0 | 0 | 0 | 0 | 0 |
| 9 | 0 | 0 | 0 | 0 | 0 | 0 | 0 | 0 | 0 | 0 | 0 | 1 | 0 |
| 10 | 1 | 0 | 0 | 0 | 0 | 0 | 0 | 0 | 0 | 0 | 0 | 0 | 0 |
| 11 | 0 | 0 | 0 | 0 | 0 | 0 | 0 | 0 | 0 | 0 | 0 | 0 | 1 |
| 12 | 0 | 0 | 0 | 0 | 0 | 0 | 0 | 0 | 0 | 0 | 1 | 0 | 0 |
| 13 | 0 | 0 | 0 | 0 | 0 | 0 | 0 | 0 | 0 | 1 | 0 | 0 | 0 |
Direct matrix “A” for participant 3
| Barriers | 1 | 2 | 3 | 4 | 5 | 6 | 7 | 8 | 9 | 10 | 11 | 12 | 13 |
|---|---|---|---|---|---|---|---|---|---|---|---|---|---|
| 1 | 0 | 0 | 0 | 0 | 0 | 0 | 0 | 1 | 0 | 0 | 0 | 0 | 1 |
| 2 | 1 | 0 | 1 | 1 | 1 | 1 | 1 | 1 | 0 | 0 | 0 | 1 | 1 |
| 3 | 0 | 0 | 0 | 0 | 0 | 0 | 1 | 0 | 0 | 0 | 0 | 0 | 0 |
| 4 | 1 | 1 | 1 | 0 | 1 | 0 | 1 | 1 | 0 | 0 | 0 | 1 | 1 |
| 5 | 0 | 0 | 0 | 0 | 0 | 0 | 0 | 0 | 0 | 0 | 0 | 1 | 0 |
| 6 | 1 | 1 | 1 | 0 | 1 | 0 | 1 | 1 | 1 | 0 | 0 | 1 | 1 |
| 7 | 0 | 0 | 1 | 0 | 0 | 0 | 0 | 1 | 0 | 0 | 0 | 0 | 0 |
| 8 | 1 | 0 | 0 | 0 | 0 | 0 | 1 | 0 | 0 | 0 | 0 | 0 | 0 |
| 9 | 1 | 0 | 1 | 0 | 1 | 1 | 1 | 1 | 0 | 1 | 0 | 1 | 1 |
| 10 | 1 | 0 | 1 | 0 | 1 | 0 | 1 | 1 | 1 | 0 | 0 | 1 | 1 |
| 11 | 0 | 1 | 0 | 1 | 0 | 1 | 0 | 0 | 1 | 1 | 0 | 0 | 0 |
| 12 | 0 | 0 | 0 | 0 | 1 | 0 | 0 | 0 | 0 | 0 | 0 | 0 | 1 |
| 13 | 1 | 0 | 0 | 0 | 0 | 0 | 0 | 0 | 0 | 0 | 0 | 1 | 0 |
Direct matrix “A” for participant 4
| Barriers | 1 | 2 | 3 | 4 | 5 | 6 | 7 | 8 | 9 | 10 | 11 | 12 | 13 |
|---|---|---|---|---|---|---|---|---|---|---|---|---|---|
| 1 | 0 | 1 | 0 | 0 | 1 | 0 | 0 | 0 | 0 | 0 | 0 | 0 | 0 |
| 2 | 1 | 0 | 0 | 0 | 0 | 0 | 0 | 0 | 0 | 0 | 0 | 0 | 1 |
| 3 | 0 | 0 | 0 | 1 | 0 | 1 | 1 | 1 | 1 | 1 | 0 | 1 | 0 |
| 4 | 0 | 0 | 0 | 0 | 0 | 1 | 0 | 0 | 0 | 0 | 0 | 0 | 0 |
| 5 | 0 | 0 | 1 | 0 | 0 | 0 | 0 | 0 | 0 | 0 | 0 | 0 | 1 |
| 6 | 0 | 0 | 0 | 1 | 0 | 0 | 1 | 0 | 0 | 0 | 0 | 0 | 0 |
| 7 | 0 | 0 | 0 | 0 | 0 | 1 | 0 | 0 | 1 | 0 | 0 | 0 | 0 |
| 8 | 0 | 0 | 1 | 1 | 0 | 1 | 1 | 0 | 1 | 1 | 0 | 1 | 0 |
| 9 | 0 | 0 | 0 | 0 | 0 | 0 | 1 | 0 | 0 | 1 | 0 | 0 | 0 |
| 10 | 0 | 0 | 0 | 0 | 0 | 0 | 0 | 0 | 1 | 0 | 0 | 1 | 0 |
| 11 | 1 | 1 | 0 | 0 | 0 | 0 | 0 | 0 | 0 | 0 | 0 | 0 | 0 |
| 12 | 0 | 0 | 0 | 0 | 0 | 0 | 0 | 0 | 0 | 1 | 0 | 0 | 0 |
| 13 | 0 | 0 | 0 | 0 | 1 | 0 | 0 | 1 | 0 | 0 | 0 | 0 | 0 |
Appendix 4
Driving power and dependence power ranks for participant 2
| Barriers | ||||||||||||||
|---|---|---|---|---|---|---|---|---|---|---|---|---|---|---|
| Driving | Dependence | Driving | Dependence | Driving | Dependence | Driving | Dependence | Driving | Dependence | Driving | Dependence | Driving | Dependence | |
| 1 | 2 | 2 | 5 | 2 | 8 | 2 | 10 | 1 | 10 | 1 | 10 | 1 | 10 | 1 |
| 2 | 3 | 3 | 6 | 3 | 7 | 3 | 9 | 2 | 9 | 2 | 9 | 2 | 9 | 2 |
| 3 | 3 | 3 | 6 | 3 | 7 | 3 | 9 | 2 | 9 | 2 | 9 | 2 | 9 | 2 |
| 4 | 1 | 4 | 2 | 4 | 3 | 4 | 3 | 3 | 2 | 3 | 2 | 3 | 2 | 3 |
| 5 | 2 | 5 | 3 | 5 | 4 | 5 | 4 | 4 | 4 | 4 | 4 | 4 | 4 | 4 |
| 6 | 2 | 5 | 4 | 6 | 5 | 6 | 6 | 5 | 6 | 5 | 5 | 5 | 5 | 5 |
| 7 | 2 | 5 | 3 | 5 | 4 | 5 | 4 | 4 | 4 | 4 | 4 | 4 | 4 | 4 |
| 8 | 1 | 4 | 2 | 4 | 3 | 4 | 3 | 3 | 2 | 3 | 2 | 3 | 2 | 3 |
| 9 | 1 | 1 | 1 | 1 | 1 | 1 | 1 | 1 | 1 | 1 | 1 | 1 | 1 | 1 |
| 10 | 1 | 2 | 2 | 2 | 6 | 2 | 8 | 1 | 8 | 1 | 8 | 1 | 8 | 1 |
| 11 | 1 | 2 | 1 | 2 | 2 | 1 | 5 | 1 | 5 | 1 | 6 | 1 | 6 | 1 |
| 12 | 1 | 2 | 1 | 1 | 1 | 1 | 2 | 1 | 3 | 1 | 3 | 1 | 3 | 1 |
| 13 | 1 | 2 | 1 | 2 | 5 | 1 | 7 | 1 | 7 | 1 | 7 | 1 | 7 | 1 |
Driving power and dependence power ranks for participant 3
| Barriers | ||||||||
|---|---|---|---|---|---|---|---|---|
| Driving | Dependence | Driving | Dependence | Driving | Dependence | Driving | Dependence | |
| 1 | 2 | 5 | 3 | 7 | 3 | 8 | 3 | 8 |
| 2 | 5 | 3 | 5 | 3 | 5 | 3 | 5 | 3 |
| 3 | 1 | 4 | 1 | 5 | 1 | 5 | 1 | 5 |
| 4 | 4 | 2 | 4 | 2 | 4 | 2 | 4 | 2 |
| 5 | 1 | 4 | 1 | 5 | 1 | 5 | 1 | 5 |
| 6 | 5 | 3 | 6 | 4 | 6 | 4 | 6 | 4 |
| 7 | 2 | 5 | 2 | 6 | 2 | 6 | 2 | 6 |
| 8 | 2 | 5 | 3 | 7 | 3 | 7 | 3 | 7 |
| 9 | 5 | 3 | 5 | 3 | 5 | 3 | 5 | 3 |
| 10 | 4 | 2 | 4 | 2 | 4 | 2 | 4 | 2 |
| 11 | 3 | 1 | 7 | 1 | 7 | 1 | 7 | 1 |
| 12 | 2 | 5 | 2 | 6 | 2 | 6 | 2 | 6 |
| 13 | 2 | 5 | 3 | 7 | 3 | 7 | 3 | 7 |
Driving power and dependence power ranks for participant 4
| Barriers | ||||||||||||||
|---|---|---|---|---|---|---|---|---|---|---|---|---|---|---|
| Driving | Dependence | Driving | Dependence | Driving | Dependence | Driving | Dependence | Driving | Dependence | Driving | Dependence | Driving | Dependence | |
| 1 | 2 | 2 | 3 | 2 | 5 | 2 | 5 | 2 | 7 | 2 | 6 | 2 | 6 | 2 |
| 2 | 2 | 2 | 3 | 2 | 5 | 2 | 5 | 2 | 7 | 2 | 6 | 2 | 6 | 2 |
| 3 | 3 | 2 | 5 | 3 | 7 | 4 | 6 | 4 | 4 | 4 | 4 | 4 | 4 | 4 |
| 4 | 1 | 3 | 1 | 4 | 1 | 5 | 1 | 5 | 1 | 5 | 1 | 5 | 1 | 5 |
| 5 | 2 | 2 | 4 | 3 | 6 | 3 | 7 | 3 | 5 | 3 | 5 | 3 | 5 | 3 |
| 6 | 2 | 4 | 2 | 5 | 2 | 6 | 2 | 6 | 2 | 6 | 2 | 6 | 2 | 6 |
| 7 | 2 | 4 | 3 | 6 | 3 | 7 | 3 | 7 | 3 | 7 | 3 | 7 | 3 | 7 |
| 8 | 3 | 2 | 5 | 3 | 7 | 4 | 6 | 4 | 4 | 4 | 4 | 4 | 4 | 4 |
| 9 | 2 | 4 | 3 | 6 | 3 | 7 | 3 | 7 | 3 | 7 | 3 | 7 | 3 | 7 |
| 10 | 2 | 4 | 2 | 5 | 2 | 6 | 2 | 6 | 2 | 6 | 2 | 6 | 2 | 6 |
| 11 | 2 | 1 | 3 | 1 | 4 | 1 | 4 | 1 | 6 | 1 | 7 | 1 | 7 | 1 |
| 12 | 1 | 3 | 1 | 4 | 1 | 5 | 1 | 5 | 1 | 5 | 1 | 5 | 1 | 5 |
| 13 | 2 | 2 | 4 | 3 | 6 | 3 | 7 | 3 | 5 | 3 | 5 | 3 | 5 | 3 |
Appendix 5
Indirect relationship matrix for participant 2
| Barriers | 1 | 2 | 3 | 4 | 5 | 6 | 7 | 8 | 9 | 10 | 11 | 12 | 13 | Driving power | Rank |
|---|---|---|---|---|---|---|---|---|---|---|---|---|---|---|---|
| 1 | 0 | 1 | 1 | 242 | 402 | 482 | 402 | 242 | 0 | 0 | 0 | 0 | 0 | 1772 | 10 |
| 2 | 0 | 1 | 0 | 202 | 363 | 403 | 363 | 202 | 0 | 0 | 0 | 0 | 0 | 1,534 | 9 |
| 3 | 0 | 0 | 1 | 202 | 363 | 403 | 363 | 202 | 0 | 0 | 0 | 0 | 0 | 1,534 | 9 |
| 4 | 0 | 0 | 0 | 41 | 0 | 81 | 0 | 40 | 0 | 0 | 0 | 0 | 0 | 162 | 2 |
| 5 | 0 | 0 | 0 | 0 | 122 | 0 | 121 | 0 | 0 | 0 | 0 | 0 | 0 | 243 | 4 |
| 6 | 0 | 0 | 0 | 81 | 0 | 162 | 0 | 81 | 0 | 0 | 0 | 0 | 0 | 324 | 5 |
| 7 | 0 | 0 | 0 | 0 | 121 | 0 | 122 | 0 | 0 | 0 | 0 | 0 | 0 | 243 | 4 |
| 8 | 0 | 0 | 0 | 40 | 0 | 81 | 0 | 41 | 0 | 0 | 0 | 0 | 0 | 162 | 2 |
| 9 | 0 | 1 | 1 | 14 | 24 | 26 | 24 | 14 | 0 | 0 | 0 | 0 | 0 | 104 | 1 |
| 10 | 0 | 1 | 1 | 134 | 240 | 266 | 240 | 134 | 0 | 0 | 0 | 0 | 0 | 1,016 | 8 |
| 11 | 0 | 1 | 1 | 44 | 78 | 86 | 78 | 44 | 0 | 0 | 0 | 0 | 0 | 332 | 6 |
| 12 | 0 | 1 | 1 | 26 | 42 | 50 | 42 | 26 | 0 | 0 | 0 | 0 | 0 | 188 | 3 |
| 13 | 0 | 1 | 1 | 80 | 132 | 158 | 132 | 80 | 0 | 0 | 0 | 0 | 0 | 584 | 7 |
| Dependence power | 0 | 7 | 7 | 1,106 | 1887 | 2,198 | 1887 | 1,106 | 0 | 0 | 0 | 0 | 0 | ||
| Rank | 1 | 2 | 2 | 3 | 4 | 5 | 4 | 3 | 1 | 1 | 1 | 1 | 1 |
Indirect relationship matrix for participant 3
| Barriers | 1 | 2 | 3 | 4 | 5 | 6 | 7 | 8 | 9 | 10 | 11 | 12 | 13 | Driving power | Rank |
|---|---|---|---|---|---|---|---|---|---|---|---|---|---|---|---|
| 1 | 6 | 0 | 0 | 0 | 0 | 0 | 4 | 0 | 0 | 0 | 0 | 4 | 0 | 14 | 3 |
| 2 | 28 | 5 | 16 | 0 | 16 | 0 | 24 | 27 | 4 | 0 | 0 | 24 | 27 | 171 | 5 |
| 3 | 0 | 0 | 2 | 0 | 0 | 0 | 0 | 3 | 0 | 0 | 0 | 0 | 1 | 6 | 1 |
| 4 | 19 | 0 | 10 | 2 | 10 | 3 | 16 | 18 | 0 | 1 | 0 | 16 | 18 | 113 | 4 |
| 5 | 0 | 0 | 0 | 0 | 2 | 0 | 0 | 1 | 0 | 0 | 0 | 0 | 3 | 6 | 1 |
| 6 | 30 | 0 | 17 | 3 | 17 | 6 | 26 | 29 | 0 | 3 | 0 | 26 | 29 | 186 | 6 |
| 7 | 4 | 0 | 0 | 0 | 0 | 0 | 5 | 0 | 0 | 0 | 0 | 1 | 0 | 10 | 2 |
| 8 | 0 | 0 | 3 | 0 | 1 | 0 | 0 | 6 | 0 | 0 | 0 | 0 | 4 | 14 | 3 |
| 9 | 28 | 4 | 16 | 0 | 16 | 0 | 24 | 27 | 5 | 0 | 0 | 24 | 27 | 171 | 5 |
| 10 | 19 | 0 | 10 | 1 | 10 | 3 | 16 | 18 | 0 | 2 | 0 | 16 | 18 | 113 | 4 |
| 11 | 50 | 6 | 32 | 3 | 32 | 6 | 45 | 50 | 6 | 3 | 0 | 45 | 50 | 328 | 7 |
| 12 | 4 | 0 | 0 | 0 | 0 | 0 | 1 | 0 | 0 | 0 | 0 | 5 | 0 | 10 | 2 |
| 13 | 0 | 0 | 1 | 0 | 3 | 0 | 0 | 4 | 0 | 0 | 0 | 0 | 6 | 14 | 3 |
| DPa | 188 | 15 | 107 | 9 | 107 | 18 | 161 | 183 | 15 | 9 | 0 | 161 | 183 | ||
| Rank | 8 | 3 | 5 | 2 | 5 | 4 | 6 | 7 | 3 | 2 | 1 | 6 | 7 |
Indirect relationship matrix for participant 4
| Barriers | 1 | 2 | 3 | 4 | 5 | 6 | 7 | 8 | 9 | 10 | 11 | 12 | 13 | Driving power | Rank |
|---|---|---|---|---|---|---|---|---|---|---|---|---|---|---|---|
| 1 | 1 | 0 | 45 | 361 | 0 | 619 | 750 | 0 | 750 | 619 | 0 | 361 | 10 | 3,516 | 6 |
| 2 | 0 | 1 | 0 | 361 | 10 | 619 | 750 | 45 | 750 | 619 | 0 | 361 | 0 | 3,516 | 6 |
| 3 | 0 | 0 | 1 | 244 | 0 | 440 | 547 | 0 | 547 | 440 | 0 | 244 | 0 | 2,463 | 4 |
| 4 | 0 | 0 | 0 | 42 | 0 | 0 | 89 | 0 | 0 | 66 | 0 | 0 | 0 | 197 | 1 |
| 5 | 0 | 0 | 0 | 303 | 1 | 537 | 664 | 10 | 664 | 537 | 0 | 303 | 0 | 3,019 | 5 |
| 6 | 0 | 0 | 0 | 0 | 0 | 131 | 0 | 0 | 155 | 0 | 0 | 66 | 0 | 352 | 2 |
| 7 | 0 | 0 | 0 | 89 | 0 | 0 | 197 | 0 | 0 | 155 | 0 | 0 | 0 | 441 | 3 |
| 8 | 0 | 0 | 0 | 244 | 0 | 440 | 547 | 1 | 547 | 440 | 0 | 244 | 0 | 2,463 | 4 |
| 9 | 0 | 0 | 0 | 0 | 0 | 155 | 0 | 0 | 197 | 0 | 0 | 89 | 0 | 441 | 3 |
| 10 | 0 | 0 | 0 | 66 | 0 | 0 | 155 | 0 | 0 | 131 | 0 | 0 | 0 | 352 | 2 |
| 11 | 1 | 1 | 36 | 388 | 9 | 650 | 778 | 36 | 778 | 650 | 0 | 388 | 9 | 3,724 | 7 |
| 12 | 0 | 0 | 0 | 0 | 0 | 66 | 0 | 0 | 89 | 0 | 0 | 42 | 0 | 197 | 1 |
| 13 | 0 | 0 | 10 | 303 | 0 | 537 | 664 | 0 | 664 | 537 | 0 | 303 | 1 | 3,019 | 5 |
| DPa | 2 | 2 | 92 | 2,401 | 20 | 4,194 | 5,141 | 92 | 5,141 | 4,194 | 0 | 2,401 | 20 | ||
| Rank | 2 | 2 | 4 | 5 | 3 | 6 | 7 | 4 | 7 | 6 | 1 | 5 | 3 |

