This study reports the use of second-order function on the basis of Taguchi method for plasma-based spray processes to enhance the surface wear resistance of zirconia ceramic coatings. The L18 orthogonal array with eight control factors is used, and the antiwear properties of the deposits are implemented. Small granules are distributed evenly and closely in the fully melted coatings, while surface features show porous structures, cavities, macropores and unmelted zirconium dioxide particles in the partially melted coatings. A dense texture in the coatings is found, which provides good wear resistance, and the polynomial model for the surface wear-resistant properties is constructed. The results of the present study show that the proposed quadratic model, based on orthogonal array design, can obtain the conditions for process optimization and predict wear volume losses to yield desired results. These results provide useful information for the control of wear volume losses for plasma-sprayed coatings and ensure good wear-resistant properties.
Notation
- B
(k × k) symmetric matrix
- b
(k × 1) vector of the first-order regression coefficients
- W
canonical matrix
- X
(n × p) matrix of the levels
- Y
vector of observation value
- β
(p × 1) vector of the regression coefficients
- ϵ
experimental error
- Λ
diagonal matrix
- λ
eigenvalues of the matrix B
- ω
transformed independent variables
1 Introduction
Wear has become the key to progress in surface tribosystems due to damage to contacting surfaces of materials and equipment and exists in many industrial products. Several reports show that wear damage leads to huge economic costs of hundreds of billions of dollars annually in the USA. Notably, 40% of the total cost to the industry is due to proper wear prevention.1 Poor wear resistance is of significant concern, particularly for many mechanical components in industrial environments, because it can bring huge economic losses to the global industry and sometimes lead to catastrophic events. Therefore, reduction in tribosystem effects on materials is very much required. Although much study has been performed on this problem, effective advanced technologies are still needed.
Recently, hard coatings deposited to protect materials from severe abrasion have been widely used to improve wear and friction in materials. Candidate materials for thermal spraying include ceramics, metals and their combinations as well. Composite coatings are prepared by various thermal techniques as well as plasma arc, induction heating, thermal spraying and plasma spraying. They have been the subject of much study and are frequently designed to enhance the surface properties of substrates to protect against wear and corrosion. For example, Bartuli et al.2 studied the formation of amorphous films by plasma spraying technology. They successively confirmed lower adhesion strength between the ceramic and the bond coat in the case of thermal barrier coatings (TBCs) produced at low deposition temperatures. Beauvais et al.3 studied the relationships between the process and microstructure in ceramics. Cizek and Khor4 used statistical technique to conduct thermal spraying of hydroxyapatite (HA) coatings and to optimize all stages of layer deposition. He et al.5 studied the tribological properties of nickel-based composite ceramic coatings fabricated on austenitic substrate by laser cladding. Sharafat et al.6 studied the development of microcomposite TBC in the application of plasma spraying technology. Liu et al.7 prepared the addition of sulfanylidene tungsten (WS2) and sulfanylidene tungsten/nickel (Ni)–phosphorus (P) on composite coatings to improve the high-temperature lubricant on engine parts that are encapsulated by laser cladding. Varacalle Jr et al.8 applied vacuum plasma spray to deposit zirconium carbide on graphite substrates. Bai et al.9 studied the effects of yttria-stabilized zirconia on the mechanical properties of spraying deposits coated by a supersonic atmospheric plasma spray (Saps). The results showed that the nanostructured Saps coating provided better oxidation resistance and thermal insulation properties, but the bonding adhesion still needs to be improved.9 Due to their low costs, the feasibility of fabrication, unique features and the high quality of their deposits, plasma spraying is the most popular technique for deposition and is frequently used in industrial areas where wear, thermal and corrosion protection are required. However, because of the feasibility and good surface properties, plasma-based spray deposits provide solutions for many industrial problems and also have interesting and technologically attractive properties. Many studies have dealt with the microstructural characteristics of these coatings with analyses of the properties of wear resistance, but few studies have examined the optimization of the wear behavior of plasma-sprayed coatings.3,10,11 Therefore, an alternative approach for coatings of plasma spray is required.
Response surface methodology (RSM) has important applications in the modeling and simulation of processes. RSM is widely used in analyzing various manufacturing processes; it uses experimental strategy to explore the influence of experimental parameters and to construct an empirically predicted model and searches for optimization methods to give desirable responses and reduce the number of experiments, resulting in higher production yields. Several researchers have prepared ceramic wear-resistant coatings utilizing numerical analysis techniques for thermal barrier technology. For example, Dong et al.12 studied the optimization of the thermal cycling behavior of lanthanum cerate (La2Ce2O7) TBCs. Tu et al.13 studied a robust design using a fractional factorial design in hardfacing by a plasma transfer arc. Wachter and Cordery14 applied RSM to optimize plasma-enhanced carbon films. Several authors used design experiments along with RSM to improve the performance of plasma spray coatings.10,14–20 Saikaew et al.21 used design experiments to optimize carbon-doped molybdenum oxide thin film coatings. Zois et al.22 studied the mechanical properties, annealing behavior and statistical optimization methods for finding spray parameters using partially amorphous stainless steel coatings. The brief review above shows that RSM has important applications in dealing with the exploration and optimization for quality and productivity improvement in industry and in the improvement of existing productivity problems in practice.
In this paper, 18 factorial designs, based on an orthogonal array, are used, and a second-order polynomial is constructed. Further, validation experiments are performed to verify the availability and the accuracy of the models, and the wear properties of the plasma-sprayed zirconium dioxide (ZrO2)/yttrium oxide (Y2O3) coatings are examined. In summary, on the basis of the Taguchi experiments from plasma spray coatings, a reliable prediction is expected to develop films with good wear-resistant properties further.
2 Materials and preparation
In this study, partially yttrium oxide-stabilized zirconium dioxide powders (Sulzer Metco) with a 7·52 wt.% yttrium oxide are used. Powder particles were mostly spherical, within a range of 30–80 μm, in morphology. An aluminum sheet, of dimensions 150 mm × 100 mm × 10 mm and surface roughness (Ra) of 0·5 μm, measured using a profilometer, was used as a substrate for coating. The substrates were cleaned in acetone for 5 min using ultrasonic equipment and were then grit blasted by 60 mesh aluminum oxide (Al2O3) at a pressure of 400 kPa. A commercially available partially yttrium oxide-stabilized zirconium dioxide powder was coated on aluminum-based alloy substrates by using an atmospheric pressure plasma spray A-3000 thermal spraying equipment with an F4 plasma torch and mass flow meters. Wear tests on the as-sprayed ceramic deposits were performed by utilizing a pin-on-disk apparatus. The wear tests were performed under 10 N load with sliding speed of 30 cm/s and wear track diameters of 20 mm. After wear tests, the worn surface was examined by scanning electron microscopy (SEM), and the phase composition of the deposits were determined using a Philips X-ray diffractometer with copper (Cu) Kα radiation over a 2θ range of 20–80°. In addition, the morphology and the wear volume of the wear tracks were measured by TalyScan 150. The experimental factors and levels for the plasma-based spray deposits are shown in Table 1, where eight factors are utilized in accordance with the technical manual information. Since numerous spray factors can potentially impact the mechanical properties of deposits, process optimization involving statistical experimental design procedures is needed.
3 Experimental details
3.1 Experimental design
A robust design, reported by Wu and Wu,23 also called the Taguchi method, is a statistical method developed by Genichi Taguchi to assess various causes for variation in the performance of manufactured products and gives parameter design with optimization of control factors to obtain the best manufacturable products. Mixed (two-level–three-level) orthogonal arrays L18 (21 × 37) are used. A two-level control factor SL (spraying layers) and seven three-level control factors, AV (accelerating voltage), AC (arc current), TS (travel speed), SS (spray stand-off), PF (powder feeder rate), CG (carrier gas) and PG (primary gas), are utilized. There are 18 experiments to be conducted in total, and each experiment is based on the combination of factors and levels as shown in Table 1. Based on loss functions, the signal/noise (S/N) ratio for the smaller and the best type is maximized in this experiment such as wear volume losses. Therefore, for this case, the S/N ratio is computed as
which is measured in decibels, in accordance with Equation 1. The S/N ratios were computed, and their average values and standard deviations are estimated in Table 1. The S/N ratios were replicated twice for worn volume losses in each trial, and variance analysis was implemented to identify the weak/strong factors. These strong factors were then used to analyze the predictors.
3.2 Building model
RSM, developed by Myers and Montgomery,24 is a very useful tool for quality and productivity improvement in the industry. It is a statistical technique that is useful for finding the functional relationship in which a response of interest is influenced by several variables, and the objective is to optimize the response. It is an efficient experimental strategic tool for determining the optimum conditions for the interest response surface of a multivariable system based on statistical methods. Because many control factors are involved in the antiwear behaviors in thermal-sprayed processes, RSM is employed as an alternative approach to analyze the antiwear formation processes. Based on RSM with a Taguchi design as shown in Table 2, the parameters X i were coded as x i according to the following equation
where X i is the uncoded value of the ith control factor (i = 1, 2,…,4), X i c is the value of X i at the center point of experimental domain and ΔX is the step width. However, in this case, the true functional relationship is unknown, because of the nature of the noise and the complex multivariable system. Then low-order polynomial models are widely used. In this experiment, a second-order model for the interest of the experimental domain is used, since it is flexible. The predicted second-order function is computed as
By minimizing the sum of squared errors, the vector of least squares estimators β is obtained. In addition, the regression coefficients are determined. Furthermore, the fitted regression model is evaluated, and the least squares fit for this model is established. Then, the first-order model can be formed as
The second-order model is formed as
To optimize the predicted response in Equations 4 and 5, the partial derivatives must be equal to zero. This point, say, x 0 = (x 10, x 20,…,x k0), is called as the stationary point. A point of maximum response or a point of minimum or a saddle point is determined. The stationary point is the solution to the following
RSM is a sequential procedure. The method of steepest ascent is used, and the optimum set of operating factors and levels is identified. The prediction for Y is reasonably close to the observed values. In addition, a contour plot of the fitted model in Equation 7 around the stationary point is examined. The canonical form of the fitted response model is determined as
where y 0 is the predicted value of y at the stationary point and W is a canonical matrix; are the eigenvalues of matrix B, and Λ is a diagonal matrix. In Equation 7, the canonical form of the second-order response model is established. Then, the signs and magnitudes of are used and then the contour plot nature of the response surface can be determined.
4 Experimental results and discussion
4.1 Experimental analysis for zirconia coatings
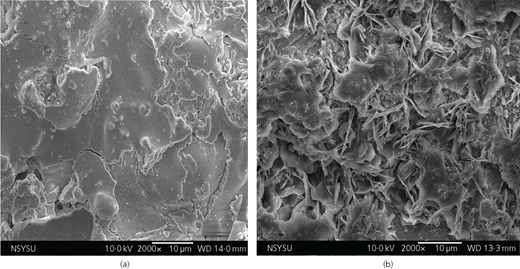
Table 1 shows that the worn volume losses of coatings for each trial are computed by S/N ratios. The mean worn volume losses for zirconium dioxide coatings are significantly lower compared to the substrate. This indicates the superior antiwear properties of the zirconia coatings. In Table 1, with a greater S/N ratio, worn volume losses were lesser for the zirconia coatings. Trial 15 has the highest S/N ratio of −2·49 db. This is due to a melted feature with a small amount of porosity, resulting in a small worn volume loss and a little deviation for the deposited trials. SEM surface micrographs of the plasma-sprayed coatings are shown in Figure 1. The surface morphologies of different ceramic coatings are seen in this figure. The deposited surfaces of L18 orthogonal array experiments have similar features. Figure 1(a) shows the coatings in test 15 and appears to be melted, whereas Figure 1(b) shows the surface of the zirconium dioxide coating in test 6 and appears to be partially melted and contains mostly particles. In addition, trial 6 has the larger worn volume losses, while trial 15 is the smallest in the overall trials. In Figure 1(a), there is no apparent indication of the presence of cavities, and most particles are melted by spray deposition. Small granules are distributed evenly and closely, while the SEM picture in Figure 1(b) shows a porous structure, numerous cavities, macropores and partially melted and unmelted zirconium dioxide on the coating surface, where the surface feature of the deposition is much looser. Clearly, the melted structures of the zirconia coatings display the high wear resistance than their porous surface features.
4.2 Wear properties
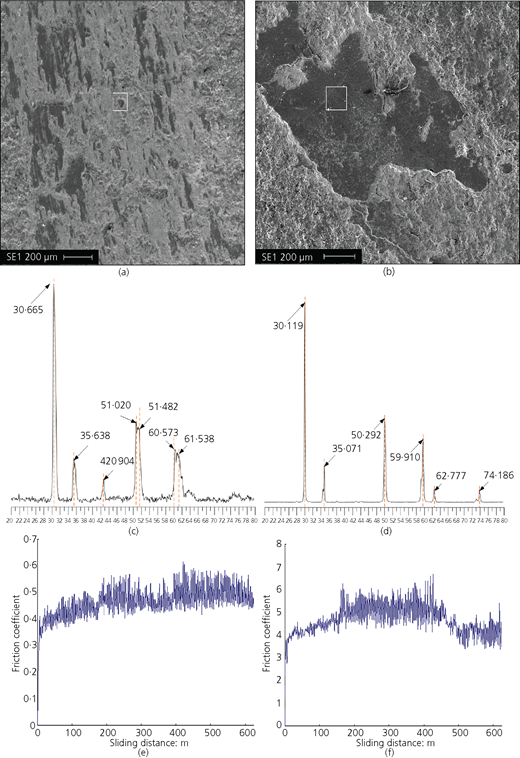
Wear textures on the zirconia coatings at 10 N loads were observed using SEM, as shown in Figures 2(a) and 2(b). After a zirconium dioxide-reinforced composite is deposited and tested, the deposits show lower average wear losses. In addition, the deposits by plasma-sprayed treatment exhibited excellent wear performance resistance compared with substrate under similar conditions. Similar results were reported in an earlier study.1,6,8,13,21,24 In Figure 2(a), a little scratch appeared in zirconium dioxide deposits on a substrate, and its worn-generated track profile contained very small worn zones. The worn surface is relatively featureless, and the development of scuffing is present. Due to microchipping and the highly anisotropic texture of original traces, the scratch traces are not significant, indicating a slight weight loss in trial 15, while Figure 2(b) shows the severely fragmented regions in trial 6 that produce several microcracks and peeling of the coating occurs. When the deformation of the deposits is further intensified, the warped parts are easily delaminated from the coatings. This results in a chipping mechanism, and some of the wear debris are lost from the coating surface, but numerous fine debris of particles are entrapped between contact surfaces by abrasive wear. Furthermore, Figures 2(c) and 2(d) illustrate the X-ray powder diffraction pattern of zirconium dioxide coatings on the substrate. Some unstable crystallized phases in the ceramic coatings are observed. The diffraction peaks of crystallized phases at 30·665, 50·255 and 62·821° for trial 15 and 30·119, 50·292 and 59·910° for trial 6 are mainly attributed to (1 0 1), (1 2 2) and (−3 1 2) planes, and the tetragonal zirconium dioxide phase includes (1 0 1), (1 2 2) and (−3 1 2) planes. A small peak, which is assigned to the monoclinic phase such as the (−1 0 2) and (1 1 2) planes and (−1 0 2), (−3 1 1) and (0 4 1) planes, appears, as marked in Figures 2(c) and 2(d). Moreover, as shown in Figures 2(e) and 2(f ), the friction coefficient curves for the worn tracks of the zirconium dioxide coatings is presented when tested against tungsten carbide (WC) balls. The results of the behavior in both tests are similar for tests performed with tungsten carbide balls after running-in stages (450 m), which were slightly lower for the coating material here (0·45 and 0·48, for trials 15 and 6, respectively). No differences were found between the friction coefficient curves, but the features found in the wear tracks are significantly different. In other words, for trial 15, the region of the tracks presented flat compacted surfaces, exhibiting good tribological properties. Conversely, for trial 6, the region of the tracks revealed heavily smeared surfaces with abrasion grooves under similar conditions.
4.3 Analysis of variance
The significant control factors affecting S/N ratios are determined using a variance analysis. Analysis of variance (Anova) is implemented using S/N ratios in Table 1, and the results are shown in Table 2. It uses S/N ratios to analyze the effects of control factors for the worn volume losses and is used to efficiently determine the significant plasma spray parameters that affect the quality of coatings. However, the significant control factors associated with variance analysis were rapidly optimized using an orthogonal array and the S/N ratio. Table 2 shows that the important control factors are TS, SS, PF and PG; these factors greatly affect the wear volume losses of the ceramic coatings. SL, AV, AC and CG are less significant in this study. The factors with significant influence are identified by means of per cent contribution in Anova. Clearly, priorities of their influence on wear volume losses are as follows: PF > PG > TS > SS > AV > SL > AC > CG. In other words, the best impact parameter is the PF, variance analysis, TS and SS on the wear volume losses. These strong parameters account for approximately 74% of the total variation. The strong impact factors are then considered as the predictors for the response model of the spraying processes.
4.4 The Rockwell-C cohesive strength
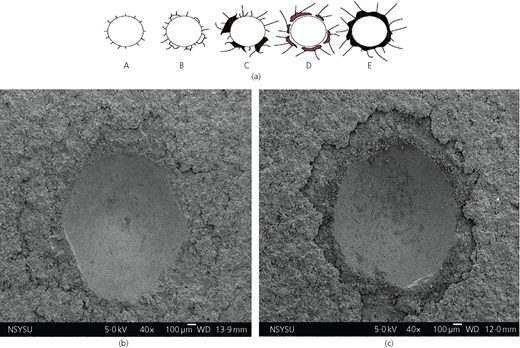
A standard Rockwell-C hardness tester was used, and the adhesive properties of the coatings were examined by Rockwell-C indentation. Figure 3(a) shows a comparison of these typical figures with a defined quality for the adhesion strength, in which an adhesion strength quality of grades A–C defines sufficient adhesion, but a D grade or an E grade represents insufficient adhesion. Figure 3(b) shows the crater morphology for the trial 15 specimen (larger S/N ratio) by Rockwell-C indentation. There is a peripheral zone with circular cracks around the indentation region, which corresponds to B grade. In comparison, Figure 3(c) also shows lateral cracking for trial 14 (smaller S/N ratio), which forms circumferentially around the indentation and leads to large circular delaminations because of the agglomeration of material. This indentation signifies an E grade, and the adhesion strength is poor. Based on these results, the obtained results in trial 15 are classified into adhesion level B grade of delamination faults as acceptable failures, and thereby, the adhesion of the coatings proves to be desirable and also represents a more highly resistant wear surface.
4.5 Empirical model analysis
The linear, interaction and quadratic items of RSM were assigned on the basis of the results of orthogonal array experiments and variance analysis tables. Using RSM model, an Anova table with linear, interaction and quadratic items was made. Table 3 shows Anova results for RSM models based on Taguchi’s experiments. The Anova table shows the second-order model’s ‘Prob > F’ values of 0·0293 – that is, less than the 0·05 level, implying that the model is effective, while the linear and pairwise interaction models are less important. Therefore, the quadratic model is used in this experiment. A quadratic model is shown in Equation 11. Note that the region of interest is 8 ≤ TS ≤ 12, 20 ≤ SS ≤ 30, 20 ≤ PF ≤ 30 and 50 ≤ PG ≤ 60. The response surface analysis for the worn volume losses of the coatings is computed as follows.
where
It is seen that the first-order SS; the second-orders TS, SS and PF; and the pairwise interactions of TS and SS significantly affect the worn volume losses of the coatings. The equation for the fitted RSM model uses Equations 3–6 to establish the worn volume losses. Therefore, the fitted second-order equation is
To test the validity of the quadratic model, the value by the simulation using the above model is fitted to the experimental datum. The R 2 value is 0⋅887, indicating that RSM effectively forecasts the worn volume losses for the coatings. Clearly, the higher adjusted R 2, the better the RSM predictor. Then, the maximum or minimum response or a saddle point can be determined. The canonical form used for this experiment is
In Equation 11, the coefficient estimates for the canonical form have different signs. The stationary point (TS, SS, PF, PG) = (25, 10, 25, 53) in a saddle point is obtained. The estimated response at this point is . Clearly, the canonical analysis indicates that the RSM predictor can yield satisfactory results.
4.6 Confirmation experiments
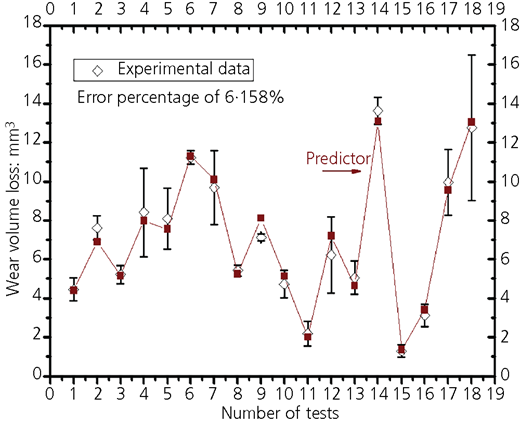
To verify the validity of the statistical models and to give a better understanding of the antiwear performance for the coatings, the contour of the RSM model is shown in Equation 10. Clearly, the response surface plots for the antiwear performance for the deposits yield for different settings of factors appear. According to Equation 11, the response contours including saddles and centric elliptical textures are obtained. The relationship between the responses and the control factors is shown, and these figures give the determination of the contour plot in the region of experimental domain according to the above equations. The contour plot of the fitted model information about the response surface nature of the antiwear properties can now be understand. Through the derivative of Equation 10, the optimal stationary point is determined as a TS of 30 standard cubic centimeters per minute, an SS of 10 cm, a PF of 20 g/min and a PG flow rate of 55 l/min. The estimated response at this point is . An additional experiment to determine the experimental wear volume losses gives a value of 2⋅683 mm3 for optimum conditions, confirming the agreement with the results from the models and the experiments in determining the wear volume losses for plasma-sprayed coatings. Clearly, the measured value for wear volume losses is approximately close to those predictors using the RSM model. This demonstrates that RSM accompanied with a Taguchi designed experiment can be used to optimize plasma-sprayed coatings to minimize the wear volume losses. In addition, as shown in Figure 4, the wear volume losses for all response parameters obtained from experiments and those estimated by models are in close agreement. Therefore, it can be concluded that quadratic regression models perform satisfactorily.
5 Conclusion
It was experimentally shown that using RSM on the basis of Taguchi’s experiments is an effective method for developing reliable wear-resistant performance for plasma spray ceramic coatings. Small granules are distributed evenly and closely in the fully melted coatings, while surface features show porous structures, cavities, macropores and unmelted zirconium dioxide particles in the partially melted coatings. From the microstructural observation of worn surface of coatings, serious debonding zone, weak scraping and caulking tracks with a large area are visible in the severely scuffed areas, whereas in the slightly worn region, small scuffed worn tracks with comparatively smooth and wear surface without obvious features of microcutting or plowing grooves are found on the worn surface. Having considered the Anova table, four important factors – that is, TS, SS, PF and PG – which can produce the minimum of the response, are identified; 73⋅7% of the total variation is assigned to these strong impact factors. In addition, 88⋅7% of the total experimental variance is explained by a second-order model with interaction terms. Clearly, the predictor using the RSM model provides a very approximate estimate for the measured value of the wear volume losses. Overall, the predicted values closely agree with the experimental values.
Acknowledgements
This work was financially supported by the Natural Science Foundation of Fujian Province (2015J01628), Fujian Provincial Department of Education Research Projects (JA14211), Fujian Province Industrial Technology Joint Innovation: research and development of key technology of intelligent rotary die cutting machine (2014) and the Foundation of Fujian Provincial Education Department (JA14208, JA14216).