Transportation-related greenhouse gas (GHG) emissions account for an increasing proportion of total emissions in the UK and globally. The provision of rail transit is popularly proposed to reduce transport GHG emissions, but the provision of new infrastructure is itself GHG intensive. Understanding of the GHG emissions impact of rail projects is limited and very few longitudinal studies have been carried out. Existing assessments are often limited both in their scope and the factors considered. A holistic understanding of GHG impacts must include an assessment of capital GHG emissions, operational energy and maintenance as well as an assessment of ridership mode shift and mode share impacts and the relationship between transit infrastructure and land use. This paper explores rail infrastructure projects and their associated GHG emissions. Guidance is given on the aspects of rail planning, design and construction that must be considered to more fully understand the associated GHG impacts.
1 Background
The UK has declared aggressive greenhouse gas (GHG) reduction goals for the next 35 years. The importance of the transportation and infrastructure sectors in addressing GHG emissions and associated climate change is increasing. Accordingly, civil and transportation engineers have a special and growing responsibility to understand the impact of design and construction of transportation infrastructure. Designing and developing infrastructure are within the purview of engineers, but there are often complicated trade-offs in the decision-making and design processes that are not within traditional engineering training. To be effective agents in the provision of sustainable transportation infrastructure, engineers must understand the wide-reaching impacts of their projects on local and global GHG emissions. Over the next 15 years, US$ 90 trillion will be spent globally on infrastructure (GCEC, 2014). Success in averting catastrophic climate change is dependent on ensuring that investment decisions incorporate sustainability considerations.
In 2012, the transport sector generated approximately 24% of total UK emissions – passenger cars dominated, generating 56% of total transport emissions (GCB, 2013). International air transport, a significant contributor of global anthropogenic emissions, is excluded from national GHG censuses but also needs to be addressed. Advances in the transport and infrastructure sectors are not keeping pace with reductions in other areas and are accounting for a growing percentage of all emissions (Thistlethwaite et al., 2012).
To this end, the UK Department for Transport (DfT) is promoting sustainable transport (DfT, 2011a). To achieve long-term sustainable transport goals, the following steps must be achieved
mode shift away from private cars
low GHG intensity for public transit
significant reductions in the GHG intensity of international travel.
This will require behavioural and policy change, as well as significant infrastructure investment to facilitate low-GHG travel choices. The provision of rail transit is a popular method of reducing car use and air travel and their associated GHG emissions (DfT, 2011a). To advance rail usage, new infrastructure investment is required in order to maintain service as populations and ridership grow, and to expand into currently underserved areas. New infrastructure, however, necessarily results in significant new emissions.
Together, automobiles and aviation present a large and growing challenge to GHG reduction. The increase in aviation in the past decade alone has had a serious impact. Aviation accounts for 12% of global transport emissions and for approximately 2% of all anthropogenic GHG emissions (ATAG, 2014). Aviation’s energy requirements make it unsuited for traditional GHG reduction efforts (MacKay, 2008) and its exclusion from national GHG inventories means aviation GHG emissions are often overlooked (Hale, 2010). In urban environments, metro rail has the potential to be a lower GHG option for travel, while high-speed rail (HSR) has the potential to be a lower GHG option for medium-distance trips currently travelled by aeroplane (DfT, 2012; DGMT, 2009). Both types of rail are currently being expanded in the UK as epitomised by Crossrail and High Speed 2 (HS2), both high-profile UK rail projects currently under development. In addition, expansion of these projects is already being discussed, with Crossrail 2 and High Speed 3 (HS3) being proposed.
Understanding of the GHG emissions impact of rail projects is limited and very few longitudinal studies have been carried out. There is a growing acceptance of life cycle thinking in construction (Chester et al., 2012a; Heijungs et al., 2012; Heinonen et al., 2012; Kellenberger et al., 2007; Menzies et al., 2007; Nichols and Kockelman, 2014; Ramaswami et al., 2008; Ramesh et al., 2010; Sharrard et al., 2008; Yung et al., 2013) and yet its application in rail projects is still limited. In most cases where GHG emissions are examined, emissions accounting is carried out only on operational emissions (Chester et al., 2010, 2012a) and does not account for the myriad impacts of new rail projects on travel choices and land use.
This paper explores rail infrastructure projects and their associated GHG emissions from construction through to development incentives. Harnessing rail infrastructure’s potential requires optimising planning and design to reflect holistic GHG impacts. The main objective here is to understand the wider impacts of design and planning decisions on urban heavy rail systems and HSR – both rail systems that are currently targeted for expansion in the UK. It is hypothesised that a careful design, planning and construction process will best facilitate meaningful GHG reductions in transport and infrastructure. In order to fully assess the GHG impact on rail projects, the evaluation must include the contributions from construction and operation, real mode shift patterns, the long-term impacts on mode share, the impacts of increased rail capacity and auxiliary impacts such as the relationship between transportation infrastructure and land use.
2 Life cycle carbon dioxide assessments
The first step in understanding the full impact of rail projects is assessing the GHG emissions associated with construction, operation and maintenance of infrastructure. Life cycle carbon dioxide assessment (LCCA) has gained prominence as the preferred method for accounting for the GHG impacts of building and operating a rail system (Cano and Chester, 2015; Gallivan et al., 2014). LCCAs evaluate the impact of a product from cradle to grave – from gathering of the raw materials through to final disposal (SAIC, 2006). In building and infrastructure projects, the disposal phase of an LCCA is often excluded, as the useful life of the product is long. Accordingly, assessments of such projects are often cradle-to-site rather than cradle-to-grave.
In the UK, a widely used embodied energy and GHG database for construction materials was produced by researchers at the University of Bath (Hammond and Jones, 2011; Jones and Hammond, 2008). This database provides factors for a cradle-to-site analysis. In order to carry out a complete LCCA analysis, other factors such as construction site energy, maintenance energy and operational energy must be analysed separately. To be effective, the LCCA calculation must be carried out in parallel with the planning and design process so that the GHG impacts inform decision-making and design.
Calculating the lifetime GHG emissions of a project is dependent on very detailed record keeping – everything from the amount of concrete used to the shipping distance of construction materials and the fuel use of on-site equipment has an impact. However, as LCCAs are relatively new to rail infrastructure projects, there is a paucity of published data. Future projects would benefit from the establishment of a database with material and energy use for rail infrastructure.
2.1 Capital GHGs
Capital GHGs are the emissions accrued as a result of the infrastructure’s construction. In rail projects the infrastructure required is significant, and the stations, bridges, viaducts, tunnels, tracks, rolling stock, temporary facilities, access roads, power supply infrastructure and earthworks all have substantial GHG costs. Life cycle GHG assessments of infrastructure projects are becoming more common, as evidenced by the recent assessment of Crossrail in London (Paris and de Silva, 2010) and the four HSR case studies discussed later in the paper (UIC, 2011). LCCAs completed in advance of a project are necessarily based on projections; careful documentation of materials use, shipping distances, site energy use and waste should be carried out to allow confirmation of the analysis and to facilitate more accurate future work.
2.1.1 Embodied material GHGs
The largest GHG cost is associated with the GHGs embodied in the materials themselves plus the emissions during their placement (e.g. Chau et al., 2011; Hughes et al., 2011; Inui et al., 2011). The construction industry consumes massive amounts of both new and recycled materials (e.g. concrete, steel, wood and plastics) and each material must be extracted, processed and transported to site. Each stage in the process has GHG impacts.
The three main construction materials used in rail projects are track ballast, concrete and steel. Reinforced concrete is used in the tunnel sections, retaining walls and floor slabs. Steel reinforcing bars are used in most concrete elements, and steel beams and columns often form the skeleton of permanent station structures. Reductions in total materials use, particularly concrete and steel, should thus be examined to reduce the GHG impact of metro rail and HSR construction. For illustration, the embodied GHGs in a 170 m span viaduct total around 220 000 tonnes carbon dioxide (tCO2) (Hughes, 2012), similar to the yearly tail pipe emissions from 90 000 cars in the UK (DfT, 2013). In addition to permanent structure materials, temporary works and waste should also be considered. For example, in buildings, up to 22 m3 of waste materials are generated for every 100 m2 of constructed floor area (Hammond and Jones, 2011), and similar levels of wastage would be expected on rail projects.
2.1.2 Construction site energy
Construction site energy is frequently excluded from built environment LCCAs (Iddon and Firth, 2013). On a heavy construction project (such as metro urban rail infrastructure or HSR) the energy cost accounts for approximately 4% of the total construction expenditure and can account for 5–30% of total emissions (Nicholson et al., 2012). Construction sites are usually powered by petrol, diesel, electricity and natural gas, producing significant quantities of GHGs on site (Sharrard et al., 2007). Petrol and diesel fuel form the largest contribution to construction site energy, accounting for 62–75% of site energy consumption (Sharrard et al., 2007). The actual emissions on any given site are dependent on equipment and fuel choices as well as the age of the machines and their usage (Waris et al., 2014).
2.2 Embodied GHGs in metro rail construction: examples
Few life cycle assessments have looked at public transit and fewer still have examined metro rail transit. This is starting to change, however, as understanding of the environmental impacts of infrastructure projects is gaining prevalence. For example, a detailed analysis of the expected GHG emissions of Crossrail – a new metro line under construction in London – has been carried out (Paris and de Silva, 2010). The predicted construction emissions for the underground section of Crossrail range from 8·6 to 13·5 MtCO2. Construction emissions are predicted to account for 15% of the life cycle emissions for Crossrail over 120 years. Of these, materials account for 58% and construction site activity accounts for 28% (Paris and de Silva, 2010). The Hong Kong mass transit railway (MTR) attributes 11% of total life cycle emissions for the railway to civil infrastructure embodied GHGs, assuming a 120 year life cycle (MTR Corporation, 2013).
Chester and co-workers investigated the GHG impacts of rail systems in the USA (Chester, 2008; Chester and Horvath, 2009; Chester et al., 2010, 2012a, 2012b) and found that the life cycle GHG emissions due to construction of rail projects were 0·8 to 1·5 times the emissions from operation (Chester and Horvath, 2009). The assessments of Chester et al. are broader in scope than those for Crossrail or the Hong Kong MTR – they include vehicle operation (active and inactive), maintenance and manufacturing, infrastructure construction, operation and maintenance, infrastructure insurance and fuel production. For Bart (Bay Area Rapid Transit), in and around San Francisco, the GHG intensity of travel was found to be 87 gCO2 per passenger kilometre travelled (PKT), while the Green Line in Boston was found to have life cycle carbon dioxide emissions of 142 gCO2/PKT (Chester, 2008).
The embodied GHGs of rail infrastructure are heavily dependent on the type of system built and the type of infrastructure. The systems studied by Chester and co-workers primarily run above ground, reducing their infrastructure requirements. Crossrail has underground stations and tunnels, requiring large infrastructure investment. The quantity of emissions is correlated to infrastructure requirements. Underground systems, with their tunnels and larger stations, have capital GHG emissions orders of magnitude higher than at-grade systems as a result of the greater material and energy demands of constructing underground.
2.3 Embodied GHGs in HSR construction
High-speed rail has stringent geometrical requirements. The horizontal and vertical alignment stipulation means that it is often difficult to adjust the line to local topography. A relatively small trade-off between vertical and horizontal alignments can be made, dependent on the type of HSR rolling stock used. For example, the French TGV Atlantique rolling stock tolerates relatively steep gradients with long-radius horizontal curves, in contrast to the Italian Pendolino rolling stock which tolerates shorter horizontal curves but with less steep gradients. Despite these potential contrasts, the relatively strict HSR geometry requirements will often result in an increased need for structures such as bridges or viaducts to allow for the required large-radii curvature. The GHG footprint of constructing such structures has been well documented in the literature (Soga et al., 2011). The GHG costs are directly related to the engineering challenges faced as a result of the tight geometric requirements of HSR. Therefore, each HSR line must be assessed in terms of its specific context.
The International Union of Railways (UIC) assessed the GHG emissions of four different HSR lines – the South Europe Atlantic, the LGV Mediterranée, Taipei–Kaohsiung and Beijing–Tianjin (UIC, 2011). For each of these lines, a cradle-to-grave analysis was carried out on earthworks, material transportation, structures, track, signalling equipment, stations and rolling stock. In a comparison of these lines in terms of tonnes of carbon dioxide due to construction per kilometre of line and year, the two French lines compare similarly, at around 60 tCO2/(km year). The Taipei–Kaohsiung and Beijing–Tianjin lines are considerably higher, at around 175 tCO2/(km year) and 140 tCO2/(km year) respectively. The large difference between these two lines and the two French lines is predominantly due to the use of bridges, tunnels and viaducts on the Taipei–Kaohsiung and Beijing–Tianjin lines.
In addition, the French national rail operator SNCF carried out an LCCA of a new 140 km TGV line from Rhine–Rhone in eastern France. It was calculated that the construction amounted to 750 000 tonnes carbon dioxide equivalent (tCO2e) (SNCF, 2011), roughly equating to 60 tCO2/(km year) assuming a 100 year lifespan (as per UIC, 2011). This is a similar value to those estimated by UIC for the LGV Mediterranée (≈68 tCO2/(km year)) and the South Europe Atlantic (≈60 tCO2/(km year)). The low GHG costs of the French lines are a result of few structures such as tunnels (e.g. 5% of LGV Mediterranée) and viaducts (e.g. 6·4% of LGV Mediterranée) (UIC, 2011). Conversely, the Taipei–Kaohsiung line in Taiwan travels through a mountain range in the densely populated west coast and is mainly run on viaducts (73%) and in tunnels (13%) (UIC, 2011).
The first phase of HS2 in the UK is a planned new 225 km HSR line from London to Birmingham. Projections of the scheme’s GHG credentials estimated that the capital GHGs would be approximately 5·59 MtCO2e (HS2, 2013). This value is very large in comparison to the studied existing projects, and is largely due to the tunnels that are intended to reduce noise pollution and improve visual amenity (HS2, 2013). Tunnels account for over 1·1 MtCO2e alone along the HS2 line. Research has found that using a 9·8 m diameter over a 10 km long tunnel for a 320 km/h train equates to 64% additional energy consumption when compared with an at-grade open line (HS2, 2009). Tunnels therefore pose two GHG challenges. Firstly, they increase the operational energy required by the rolling stock indefinitely. Secondly, they have a large GHG capital investment, primarily as a result of boring and embodied material energy. The preference for tunnels to mitigate environmental metrics such as noise and visual amenity may be reduced if a larger premium was put on the two-sided GHG environmental impacts they have. However, clearly the choice to utilise tunnels incorporates other considerations beyond a simple trade-off between GHG emissions and noise as well as other environmental impacts. For example, separating land has animal migration impacts and has other wider local connectivity implications that would need to be considered.
2.4 Operation and maintenance
The embodied GHGs of a rail system increase each year as more energy and materials are put into system operation and maintenance (Zapata and Gambatese, 2005) Feedback from asset managers to design practitioners also has significant importance to GHG emissions (Mohammed and Hassanain, 2010) A design that requires little maintenance resource investment over its lifetime, possibly at the cost of more capital investment, may be more advantageous in terms of GHGs. Conversely, a design that attempts to defer capital costs at the expense of increased maintenance may face significant cumulative GHG emissions.
Most metro rail systems operate using electricity. London Underground is the largest electricity consumer in London, using approximately 1 TWh of electricity per year accounting for 2·8% of all electricity use in London (TfL, 2008). For comparison, the Hong Kong MTR uses approximately 1·4 TWh of electricity per year (MTR Corporation, 2013). The GHG emissions associated with this energy are dependent on the GHG intensity of the electricity network.
As many countries continue to pursue GHG reductions for their energy supply, such operational GHG footprints will reduce accordingly. In the UK, the GHG intensity of electricity rapidly decreased in the early 1990s and has been approximately 500 gCO2e/kWh since 1997 (Defra and DECC, 2013). The residual electricity fuel mix in the UK is 46·8% from coal, a GHG-intensive energy source; accordingly, there is still room for improvement (DECC, 2014). The UK Pathways to 2050 (Climate Change Act 2008, 2008) calls for an increase in nuclear energy and investment in renewables to reduce the GHG intensity of electricity to 150 gCO2e/kWh (AEA, 2011). If progress is made towards this goal, the GHG intensity of electrified rail travel in the UK will fall accordingly. It is also important to note that arrangements with energy providers can be made to make use of lower carbon dioxide domestic energy sources. For example, Network Rail signed a deal with EDF Energy in 2013 for a 10 year supply of electricity 100% matched by low carbon dioxide energy from EDF Energy’s nuclear power stations (Network Rail, 2013).
When a line is supplied with low-GHG electricity, the GHG footprint for operation can be vastly reduced. Comparing the life cycle GHG emissions between HSR in France, Taiwan and China highlights the impact of electricity GHG intensity – HSR operation in France emits approximately one-fifth of the GHGs of the systems in Taiwan and China, and this is in large part dependent on the GHG intensity of electricity. Critically, the dominance of low-GHG nuclear energy in France (76·4% of electricity generation) reduces the impact of operating the trains while Taiwan’s electricity mix is dominated (52%) by coal-based electricity (UIC, 2011). On average, an HSR train consumes 24·1 kWh/km (Network Rail, 2009) and the emissions associated with this operation can be estimated by combining them with the emissions factors derived from the electricity mix of any country. In a simplistic comparison of a 100 km track, operational emissions using nuclear power would be around 0·04 tCO2e (assuming 16 gCO2/kWh) (SCECC, 2010) while those via coal would be 2·1 tCO2e (assuming 870 gCO2/kWh) (MacKay and Stone, 2013).
3 Ridership
It is a widely held view that the development of urban rail reduces urban GHG emissions by reducing road-based transport emissions. Studies have repeatedly shown that, per PKT, moving by public transport results in fewer GHG emissions than car travel at average occupancies (DfT, 2011b; Newman, 2000; USDoT, 2010). In 2011, the average UK car – with an average UK occupancy factor of 1·6 – produced 151·0 gCO2e/PKT while London Underground produced 83·3 gCO2e/PKT (DfT, 2011b). However, especially in cities with an existing transit system, the mode shift to new rail is complex as passengers do not necessarily switch from private to public transit – a large percentage of riders on the new line have often switched from other parts of the existing transit system (JLISU, 2002; Saxe et al., 2015). To understand the emissions benefits of new metro lines it is necessary to consider the actual mode shift achieved. This includes an analysis of ridership redistribution within the existing public transit system, the possibility of replacing active transportation trips (walking and cycling) and the effects of induced demand (both onto the new line and onto existing transportation infrastructure in response to the mode shift). The impacts of new urban rail lines vary. For example, the opening of a new metro in Copenhagen was accompanied by a 13% drop in vehicular traffic and a 40% decrease in bus use (Vuk and Ildensborg-Hansen, 2006). In Athens, the new metro saw 24% of its ridership come from cars and 53% from buses (Golias, 2002). However, on London’s Jubilee line extension, only 2% of initial riders came from cars and 7% from buses (TSGUW, 2004).
Rail infrastructure expansion also maintains and expands rail services for a growing population. Investments in transport infrastructure have long-term impacts on mode share (Henao et al., 2015). The GHG impacts of new rail capacity and its influence on long-term mode share trends can be a major contributor to the net GHG impact of a new rail system. Evidence indicates that increased rail accessibility correlates with reduced use of GHG-intensive modes such as car and air travel (Albalate et al., 2015; Murray et al., 1998; Saxe et al., 2015). In examining long-term mode share, GHG savings are calculated from trips that are avoided rather than trips that were previously taken by a different mode (mode shift). As populations grow, more trips are taken and, eventually, the initial ridership can be dwarfed. For example, ridership on the Jubilee line extension more than doubled from 2000 to 2011 (TfL, 2013). The calculation of long-term GHG savings due to mode share trends is sensitive to the variability of long-term predictions. Mode share is complex and difficult to predict, involving the individual decisions of millions of travellers interacting to bring about macro behaviour on the transport network (Lu and Shi, 2007).
As such, predictions for short- to medium-term demand have historically struggled to provide accurate predictions. For example, by 2010, the High Speed 1 (HS1) line in the UK was carrying less than a third of the projection at the time of tendering (Booz&Co., 2012). A study of 210 projects in 2006 found that, for nine out of ten rail projects, ridership was overestimated by an average of 106% (Flyvbjerg et al., 2006). Such a history of inaccuracy shows the difficulties associated with predicting user behaviour towards a new mode provision. This said, it is important to consider the longer term gains. The biggest criticism of HS1 was that the aviation sector solved the connectivity problem itself, primarily through low-cost carriers, thus impacting on the ability of HSR to compete (HCCPA, 2012). However, such low-cost aviation is unlikely to continue as global emissions regulations impact on the competitive pricing of aviation. Thus, although the savings projected were not made in the short term, they may come to fruition in coming decades.
The GHG savings of rail travel are also sensitive to the uncertainty surrounding the future GHG intensity of all travel modes. Over the past decade the GHG intensity of travel has been decreasing across modes. For example, the GHG intensity of cars in the UK dropped by 22% from 2001 to 2011 (RAC Foundation, 2012). As all modes become less GHG intensive the net benefit of rail travel will probably decrease. The GHG intensity of any travel mode is dependent on ridership and fuel type. In 2011, London Underground produced less GHGs/PKT than a car with average ridership (1·6 people/car). However, with an increase in car occupancy to three passengers, the car produced less GHGs/PKT (DfT, 2011b).
3.1 Ridership on metro rail
A study of the Sheppard subway line in Toronto, Canada, found that it produced more GHGs/PKT than the buses it replaced in its first 6 years of operation (Saxe et al., 2015). This was due to the replacement of a high-occupancy bus service with a low-occupancy metro. After 6 years, however, the metro surpassed the performance of the original buses through a combination of increasing ridership and a rapid reduction in the carbon dioxide emissions of the electrical grid (Saxe et al., 2015). A study of light rail in Los Angeles, USA, found that a minimum mode shift of 35% from cars was needed to pay back the GHG investment of building and operating the line (Chester et al., 2012b). This level of mode shift can be difficult to achieve in a city with an existing rail system because of established levels of transit usage. As noted earlier in the paper, early ridership on London’s Jubilee line extension was only a 2% modal shift from cars, with the vast majority of riders coming from other tube lines (JLISU, 2002). In this instance, GHG savings would only be achieved if the new line provided a more efficient route of travel (reducing travelled kilometres) or was a more efficient energy consumer than older parts of the system. In Toronto, the Sheppard line eventually saw significant savings from growing ridership, which replaced car trips. However, these saving were very sensitive to backfilling of car trips by other users (Saxe et al., 2015).
The low-GHG promise of rail transport is very appealing, but the GHG intensity of the electricity network, real ridership, actual mode shift and long-term mode share all determine the potential for GHG savings. Over the long term, metro rail benefits from the falling GHG intensity of urban electricity systems and growing ridership beyond the initial mode shift. In addition, any trips moved onto the new infrastructure may free up space on the existing network. This can have positive or negative impacts. On the one hand, increased capacity of the rail network can attract new riders or trips to the system as a whole but, on the other, drivers attracted to the new infrastructure may be quickly replaced by those drawn to the faster moving roads.
3.2 Ridership on HSR
For HSR, the load factor was found to be the most influential aspect on the GHG credentials in the four UIC case studies (UIC, 2011). The French TGV lines operate at an average load factor of 70%, in sharp contrast to the 46% achieved by the Taiwan HSR line. UIC carried out a sensitivity analysis of −20% and +20% of the central assumed load factor on an HSR. The low case (−20%) was calculated to emit 21 gCO2e/PKT and the high case (+20%) was found to emit 11 gCO2e/PKT (UIC, 2011) – this is a significant difference. HSR lines such as those in France have traditionally run at close to passenger capacity and therefore fare much better in terms of the GHGs/PKT metric (UIC, 2011).
3.2.1 HSR modal shift from aviation
Phase one of the HS2 line from London to Birmingham estimates that the line will annually save 23 907 tCO2e through modal shift onto HSR from aviation (HS2, 2013). In a comparison of European travel, aviation (164 gCO2/PKT) and cars (151·6 gCO2/PKT) produced the highest emissions per PKT (UIC, 2011). It is interesting to note that the higher load factors achieved by aviation bring its emissions to almost that of a car. HSR was significantly less GHG intensive at only 11 gCO2/PKT in operation. However, this belies the high infrastructure investment required for rail. In addition, the proliferation of low-cost airlines in Europe has stymied mode shift to rail. Comparison between rail and aviation in the UK by price found that it was cheaper to fly for the majority of domestic journeys (National Rail, 2014; Skyscanner, 2014).
4 Transport–land use interaction
A growing body of research highlights the dependent relationship between transportation infrastructure, real estate development and urban form (Cervero, 2001; Chen et al., 2007; Gospodini, 2005; King, 2011; Levinson, 2008; Polzin, 1999). Transportation infrastructure makes land accessible for development and development gives people reason to use the transportation infrastructure. While some development will be speculative in anticipation of a planned or promised new infrastructure, it takes years or even decades for the effects of new rail infrastructure to be fully realised (Cervero and Landis, 1993). The potential for rail infrastructure to influence spatial patterns of development can lead to significant GHG impacts; it is widely accepted that intensified land use results in lower GHG emissions (Newman and Kenworthy, 1989; Norman et al., 2006; Senbel et al., 2010).
4.1 Land use around metro rail
In their report on the land use impacts of rapid transit, Knight and Trygg (1977) note that metro development can be a driver of intensified land use given the right external conditions, including urban development pressure, availability of land and appropriate public policy. Increased land use intensity is associated with lower per capita GHG emissions (DECC, 2013; ONS, 2011). Metro development will not create new development but can redirect its location in the urban environment (Knight and Trygg, 1977). Accordingly, real estate developments around new metro stations can be taken as a concentration of development rather than induced development. However, this process can be long and the initial planning of metro rail must take the time delay inherent in this relationship into consideration.
It can be very difficult to pick out the impacts of a given rail system on the urban form of a city. However, the densification potential of metro rail infrastructure is a critical component of the GHG impact of metro rail. It influences both the footprint of the city – the lower the density the more land is required to support the same number of people – and the at-home energy use of urban residents. It will also influence the types of industry and employment suited to the newly connected area. The track record of new metro rail projects in achieving increased density is mixed. It is widely agreed that new metro is an important factor in achieving urban density but is insufficient alone.
In the decades following construction of the Yonge line, 90% of all office construction in Toronto was built within 5 min walk of the subway. Similarly, half of all new apartments built in Toronto between 1954 and 1984 were sited within walking distance of a subway station (Cervero, 1986). However, the next metro line in Toronto, the Bloor line, did not repeat this success and has much lower levels of density (TTC, 2001). A review of 20 years of operation of the Bart system in San Francisco and surrounding areas found that the impacts on land use had been very uneven (Cervero and Landis, 1997). The Bart system was found to be critical to supporting workplace density in downtown San Francisco and to the construction of multi-family homes or government offices around some stations. However, due to local opposition, existing land use and station locations, some parts of the Bart system saw very little land use change over 20 years. Government promotion was found to be key to the success of Bart stations, particularly outside the downtown core (Cervero and Landis, 1997). Other reports are available in the literature, but with limited information compared with the Toronto subway and San Francisco Bart. For example, in Mexico City, the expansion of line B resulted in significant increases in local residential density around the stations (Guerra, 2014). In a study of the Washington metro, Vinha (2005) found that the metro had a significant impact on attracting employment but an insignificant impact on residential density and that the effect of the metro took many years to manifest. An ex-post study of the metro in Stockholm found that the land use impact of the metro was small but the planning policies that accompanied the opening of the metro had had a significant effect (Börjesson et al., 2014).
4.2 Land use and HSR
The land use impacts of HSR compared with aviation are predominantly a comparison of land use near a train station and an airport. HSR stations often share services with local and regional services (e.g. King’s Cross–St Pancras) and so they share the same land use impacts discussed above. Airports are generally located on the outskirts of urban areas as they require a large amount of space and there must be sufficient buffer space between them and residents to protect from noise and other pollutants (Kussner, 2011). Airports are associated with negative pressures on nearby land use due to noise, safety, environmental degradation and economic concerns (Brockway, 2007). Conversely, train stations are generally found in central locations (e.g. St Pancras in London, Gare du Nord in Paris and Gare du Midi in Brussels). An assessment of HS1 – the link from London to the Channel Tunnel in the UK – found that the impact of developments at King’s Cross, Stratford and Ebbsfleet could be worth £10 billion as a present value over 60 years (LCR, 2009). There are now plans for a similar redevelopment of Euston station for HS2 in London. The land use impacts of aviation are generally limited to the airports themselves and the takeoff and landing corridors. Contrastingly, HSR involves the creation of rail corridors that impact land use over large and highly variable distances (Kussner, 2011). The land use implications of HSR are much more complex and interlink with a multitude of other land use considerations along their length. More research is needed on the land use impacts in relation to HSR versus aviation in terms of GHGs.
5 Discussion and conclusions
The transportation sector is responsible for a significant fraction of GHG emissions in the UK and globally. Diverting road and air passenger traffic to rail systems could result in significant reductions in overall GHG emissions. To achieve large-scale uptake of rail travel, new rail infrastructure will be needed, both to support natural growth in ridership and to extend rail services to currently underserved areas. The UK is currently pursuing large rail projects, particularly at the metro and HSR scales. However, the provision of rail infrastructure is GHG intensive in terms of materials used and energy expended, and the net GHG impacts of such projects are not well understood. A holistic assessment of GHG emissions should inform project design in an integrative/iterative process to ensure the long-term environmental success of these large engineering projects.
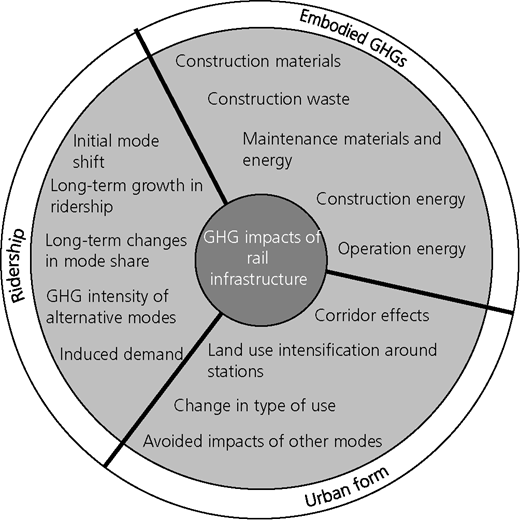
This paper has highlighted the importance of making a complete assessment of GHG impacts. Existing GHG assessments of transit infrastructure have thus far been piecemeal, excluding one or more of the important impacts highlighted here: embodied GHGs, ridership impacts and/or urban form. A holistic understanding of GHG impacts must include an assessment of capital GHGs, operational energy and maintenance, as well as an assessment of ridership mode shift and the relationship between transit and land use. This paper has proposed the key factors that should be considered in a holistic assessment of the GHG impact of rail infrastructure projects; these are summarised in Figure 1.
The embodied GHGs of a project can be assessed through detailed record keeping of on-site activities and ongoing maintenance, operation energy and materials. Calculating the impacts on ridership and changes in land use is more difficult to assess and involves investigating complex relationships between infrastructure and behaviour. Modelling of ridership changes, discussions with developers and policy makers, and post-project surveys can provide critical data for understanding the impact of a given project on behaviour. To date, few projects have reported on long-term ridership and land use impacts. In part this is because these can occur well after completion of a project. Efforts should now be made to accumulate construction, ridership and land use change data on ongoing and recent projects to inform future work.





Acknowledgements
Shoshanna Saxe is supported by the Commonwealth Scholarship Commission in the UK, and Gerard Casey is supported by an EPSRC Industrial Case grant in collaboration with Arup.