

The study aims to promote independent mobility for persons with visual impairment or legal blindness (VIB) by developing a Web-based wayfinding application using geographic information systems (GIS). While the literature mainly focuses on technical devices presenting results for wayfinding, a lack of integration of user needs is identified. The inclusive, participative developed application offers step-by-step directions for pre-trip planning through an accessible user interface.
The paper presents a semi-automated approach to extract a pedestrian routing network data set based on open government data and field survey. User profiles calculate different routes using a weighting scheme for landmarks, orientation hints, infrastructure of crossings and sidewalks. The adoption of ArcGIS Web AppBuilder widgets allows access of the user interface additionally through keyboard-only navigation and therefore screen-reader capability.
GIS offers a powerful tool to design network analysis for persons with VIB. The routing algorithm accesses different user profiles, returning individualized turn-by-turn directions. The complex set of attributes, including shorelines, landmarks and barriers, can be integrated by semi-automated processes.
The paper illustrates the benefit of GIS applications for wayfinding of persons with VIB to raise self-determination and independence.
A ubiquitous pedestrian sidewalk network for a medium-size city comprises a novelty, as research has mainly focused on small areas. The integration of shorelines next to a various number of hints, landmarks and potential barriers through semi-automated processes allows reproducibility and transferability of the model to other cities.
1. Introduction
When finding oneself in a completely new environment or treading on unfamiliar paths, vision appears to be one of the most essential elements for orientation. A reduced level of sight directly affects the scope of individual movement. Hence, the tie between independence and mobility can be described as a causal relationship where autonomous movement and navigation in space enable self-determination (Hersh, 2018). In the context of people with visual impairment or legal blindness (VIB), the development of assistive applications and devices for indoor as well as outdoor situations has sought to promote this idea. Besides well-established tools, such as the white cane, geospatial technology-based solutions for navigation are getting higher attention. Within the context of outdoor wayfinding processes, geographic information systems (GIS) offer the possibility to collectively manage geodata, analyze networks for routing and visualize the resulting directions in an accessible format. Yet, implication of research has largely focused on smaller test areas of prototypes, as provision of support for large, complex settings has proven to be extremely difficult (Roentgen et al., 2009; Zimmermann-Janschitz, 2018).
In terms of network-based outdoor navigation, one might suggest that there is already a broad selection of service providers (Google Maps, Garmin, TomTom, etc.). However, routing in existing applications is predominantly based on street centerlines intended to support motorized vehicles rather than pedestrians and particularly persons with VIB (Völkel et al., 2008). The turn-by-turn directions use street names, distances as well as cardinal points, which are all represented visually in space. As the representation of streets by centerlines is too coarse for people with VIB, the underlying network for navigation has to be based on sidewalk information. Furthermore, orientation for people with VIB cannot be based on mere cardinal directions and visual hints (e.g. house numbers), but rather requires additional information on the physical surrounding (Golledge et al., 1998; Neis and Zielstra, 2014). Hence, point features like barriers (e.g. free-standing posts, stairs), hints (infrastructure of intersections, public transport stops, etc.) and linear features (pavement, street type, shorelines bordering the sidewalk) have to be included in the directions. Further, the level of detail required for orientation differs strongly within the target group itself (Golledge, 1993; Hill et al., 1993; Zimmermann-Janschitz et al., 2017). Ultimately, the usability of supportive tools has to be designed in accordance with the needs of persons with VIB.
This paper presents the development of a pedestrian routing network for an assistive Web application for wayfinding in urban areas specifically designed toward the needs of people with VIB using GIS. The final product allows for pre-trip planning of routes in a medium-sized city. While the focus lies strongly on the technical realization of processing the sidewalk network, emphasis is also given to the presentation of information for the target group. Consequently, the functionality and the interface of the application should equally promote accessibility and autonomy.
2. Background
Throughout the years, a broad variety of assistive devices, including navigation systems for enhancing orientation and mobility of persons with VIB, have been put forward (Fernandes et al., 2019; Real and Araujo, 2019). Tools to support orientation and navigation for wayfinding of persons with VIB can be divided in “traditional” assistive devices, technical respectively electronic tools and a combination of both. Common forms of mobility aids are the long/white cane, the guide dog and sighted guides. The white cane remains the most prominent tool of assistance because of its handiness and cost efficiency (Lakde and Prasad, 2015). With an emerging information and communication technology (ICT), various approaches have been designed and developed to widen the spectrum of traditional devices. They can be categorized in:
tools that upgrade the white cane through haptic and/or sound elements (Khan et al., 2018; Manduchi et al., 2018);
new devices (Bhowmick and Hazarika, 2017; Tapu et al., 2018), e.g. which can be attached to the smartphone; and
applications with a focus on apps for mobile phones and devices (Hakobyan et al., 2013).
A crucial factor for technical devices to reach acceptance and succeed in the market economy is affordability next to other criteria like usability, practicability and merchantability in daily life. By contrast, applications can score with their availability and flexibility.
Wayfinding applications can generally be distinguished based on their spatial focus, concentrating either on indoor or outdoor navigation or combining both. Indoor applications for persons with VIB appear to have gained higher scientific attention recently (Serrão et al., 2015; Murata et al., 2019). Here, navigation and routing are based on markers, beacons and sensors, e.g. radio-frequency identification (RFID) (Fernandes et al., 2014), Bluetooth (Castillo-Cara et al., 2016), sound (Pereira et al., 2015), etc., to define the position and direction of movement of people with VIB. However, those technological solutions are mostly applicable for relatively small-scale indoor settings and can only be used outdoors within hybrid solutions in combination with global positioning systems (GPS). Likewise, in outdoor surrounding, GPS bears challenges for orientation and wayfinding, especially for persons with VIB. The GPS signal can be shielded in street canyons or by trees in parks, which results in a significant deviation from the true position (Lakde and Prasad, 2015). As solution accessible GPS (May and Casey, 2018) can be indicated, still showing limitation for on trip-planning like spatial accuracy and signal delay. Although the development of outdoor solutions dates back to the 1990s (Jacobson and Kitchin, 1997), little essential progress has been made when talking about acceptance and implementation in a wider spatial context. This may be caused by the complexity of the environmental surrounding in combination with a lack of appropriate data as well as the varying demands of the heterogeneous target group (Zimmermann-Janschitz et al., 2017). With increasing functionality, GIS offer a high potential to overcome these challenges, but so far has marginally been acknowledged (Kammoun et al., 2012; Fernandes et al., 2017; Zimmermann-Janschitz, 2018). Components and prerequisites essential for wayfinding for persons with VIB can be covered and integrated in GIS.
Most commercial routing network data sets are designed for motorized vehicles. Neis and Zielstra (2014, p. 70) indicate that “People with special needs, however, who rely on a more specialized dataset, cannot utilize the provided commercial geo-information and require highly detailed ground-truth data.” Pedestrian network data differs essentially from networks for motorized vehicles, e.g. through using sidewalk data (Tajgardoon and Karimi, 2015). Similar to data used as orientation hints, georeferenced information about sidewalks is sparsely available. Additionally, special interest has to be given to crossings, because they bear higher risk and challenge for locomotion (Ahmetovic et al., 2017; Cheng et al., 2018; Hersh, 2018).
When moving from origin to destination people with VIB are using a variety of methods to orient themselves. These include, but are not limited to, tactile elements on sidewalks, ground composition, acoustic signals at road crossings, vertical boundaries identified as shorelines (fences, walls, etc.) as well as footpath obstacles (poles, boom barriers, etc.) (Working Group on Mobility Aids for the Visually Impaired and Blind, 1986; Park et al., 2015). Recent research integrates open sourced data to overcome matters of cost and availability. OpenStreetMap (OSM), crowdsourced data and volunteered geographic information (Zeng et al., 2017) hold the potential to increase the availability of applications and widen their spatial extent. Bolten et al. (2017) develop a wayfinding algorithm based on OSM data for blind pedestrians, while Ritterbusch and Kucharek (2018) integrate OSM data for reliable and robust creation of pedestrian paths. However, there are still limitations in availability, different levels of completeness (Ritterbusch and Kucharek, 2018), detail (Rousell and Zipf, 2017), spatial accuracy, and therefore reliability. The heterogeneity and availability of open source data varies between countries (e.g. USA versus Europe), and the lack of institutional data, serving as prerequisite for open source data, leads to differences in spatial coverage.
Unless following the open-source data approach, at time of application development, the lack of appropriate data results in localized implementations limited to small spatial units like city blocks or campuses (Roentgen et al., 2009; Karimi and Kasemsuppakorn, 2013; Zimmermann-Janschitz, 2018).
Furthermore, mobility appears to be strongly subjective and a diverse topic as single individuals choose different approaches when it comes to navigation. As stated before, this is also the case for persons with VIB, triggering the need for individual solutions for navigation. Völkel and Weber (2008) introduced various user profiles in the navigation system, representing individual preferences, which can be added through annotation in the database. Tajgardoon and Karimi (2015) simulated accessibility of paths, by weighting sidewalk and crossing properties according to the needs of persons with VIB, resulting in a map on walking comfortability. This research suggests a subdivision of the user group corresponding to individual needs, e.g. given in Zimmermann-Janschitz et al. (2017). The same individuality exists due to various degrees of vision, colors, light perception, etc., which is managed by the accessibility of the application (Rodriguez-Sanchez et al., 2014) and incorporated with additional spatial information (Karimi et al., 2014). Building on these preconditions and requirements, the methodology mix for the application has to be complex and innovative.
3. Methodology
The application is developed using JavaScript API 3.18, QGIS Desktop 2.14 with GrassGIS, ArcGIS 10.3 network analyst, ArcGIS WebApp Builder 2.0 and ArcGIS Server 10.3. In terms of spatial extent, the implementation was realized for the City of Graz, Austria, which has about 300,000 inhabitants and is covering an area of 127 km2 (49 square miles) with approximately 2,000 km (1,243 miles) of sidewalks. (Geo)Data was gathered from survey, field mapping as well as open data sources (GIP (Graph Integration Platform), 2016; OSM). Additional data was bought from the municipality of Graz.
3.1 Pedestrian routing network
The availability of information about sidewalks and attribute information differing between left- and right-hand side of sidewalks is indicated as important for orientation and navigation purposes of persons with VIB. Ballester et al. (2011) use fixed distances from street centerlines to calculate sidewalks. This approach is not applicable for Graz because street width differs considerably due to the historic growth of the city. The use of OSM to generate sidewalks like in e.g. Neis and Zielstra (2014) fails due to a coarse representation of streets. Therefore, a semi-automated approach is developed using the zoning map and the graph integration platform (GIP (Graph Integration Platform), 2016), an intermodal open government vector data set on the entire Austrian traffic network. The basic information about sidewalks is extracted from the zoning map, which indicates, next to others, areas used for traffic. Traffic areas are buffered with a distance of 1 m (3.3 ft) followed by the extraction of inner lines bordering the buffer areas. The distance is chosen on the basis of the (Austrian) traffic regulations, which demand a minimum width of 2 m (6.6 ft) for sidewalks (Municipal Authority of Graz, 1982). Additionally, zebra crossings and crossings are added to the data set identified in the data set. The result is combined with the information on street centerlines of the GIP using Python scripts with ArcPy functionalities. The resulting network data set shows a level of accuracy of 86%. As the accuracy of this information is critically important for the user group, the network data set is additionally checked visually based on satellite images and examined through field mapping to assure highest level of precision.
Special attention is given to intersections, corners and public open space (Bentzen et al., 2017; Coughlan and Shen, 2013). This is necessary to give detailed turn-by-turn directions at crucial parts of a route. Intersections differ in their infrastructure, like the existence of zebra crossings, traffic lights, tactile pavement or auditory and tactile signals. The infrastructure of intersections is represented both in linear features (crossing) of the intersection as well as in point features (lights and pavement). The equipment is added as attributes to the crossings in the database. After modeling zebra crossings with linear features from point-based information and assigning street names to crossings using the spatial join tool in ArcGIS, the different settings of intersections are examined. If, e.g. an intersection has a traffic light, a tactile pavement but no auditory signal, the text in the directions will be “traffic light with tactile pavement.” In suburban areas, indicated crossings are missing due to a dispersed and more rural settlement. In this case, additional non-corner crossings were defined in the database to reduce walking distance. These are modeled based on availability and distance of crossings, respectively, intersections and speed limit.
The final network data set, which serves as basis for the routing algorithm, consists of:
sidewalks attributed with names of adjoining streets, usage type of streets and surface of the sidewalk/street;
crossings attributed with name of street to be crossed; and
additional equipment of the crossing.
3.2 User profiles and wayfinding elements
As shown in the introduction, persons with VIB are a very heterogeneous (user) group. This heterogeneity requires the demand to adapt the turn-by-turn instructions for wayfinding based on individual needs.
To identify and cluster distinctive groups of users, previous research conducted within the realm of the project, was consulted (Zimmermann-Janschitz et al., 2017). Therein, a hierarchical cluster analysis using Ward’s method is used to identify five “target groups” characterizing personal needs regarding mobility, information and technology. The cluster analysis is integrating detailed information about the use of orientation hints, barriers as well as the use of technology and preferred information. It is based on a nation-wide online survey in Austria, including 1,000 interviewees with a return rate of 92 completed questionnaires. The resulting “target groups” are discussed and condensed in two workshops with the user group and experts, consisting of 31 and 25 participants, resulting in three defined user profiles.
These user profiles vary depending on the number of details given in the wayfinding description (hints, landmarks and potential barriers) and the weighting of routing elements (e.g. auditive signals or tactile pavement). Table 1 presents the weighting coefficients for the routing. The coefficients are integrated during the network generation by multiplying the factor with the length of the segment according to the street type and its use. The higher the weighting coefficient for a street segment, and therefore its length, the more unlikely the segment will participate in the routing. In case of intersections, a fixed value is assigned as length, depending on the availability of a zebra crossing, traffic light, acoustic traffic signal and/or tactile pavement. Therefore, “unequipped” intersections have the highest length in the network. Potentially dangerous sites, e.g. postboxes, are implemented as point barriers with “added costs” in the routing algorithm. When a route passes this point barrier, a pre-defined value, as given in Table 1, is added as length to the route. An example of routing results for different profiles is available in the results chapter.
Weighting coefficients for street/sidewalk segments
| Routing elements | Weighting coefficient | ||
|---|---|---|---|
| Profile 1 | Profile 2 | Profile 3 | |
| Street type and usage | |||
| 1 Tactile pavement; sidewalk; path; pedestrian refuge island | *1 | *1 | *1 |
| 2 Stairs; narrow parts of sidewalk | *1 | *1,5 | *1,5 |
| 3 Pedestrian zone | *1,5 | *2 | *2 |
| 4 Combined walk-/bikeway | *1,5 | *2 | *2,5 |
| 5 Sidewalk with visual separation from street; mixed use | *2 | *3 | *3 |
| Crossings and their infrastructure | |||
| 1 Zebra crossing; traffic light; acoustic traffic signal; tactile pavement | 10 | 10 | 10 |
| 2 Zebra crossing; traffic light; acoustic traffic signal | 10 | 10 | 10 |
| 3 Zebra crossing; traffic light; tactile pavement | 10 | 25 | 50 |
| 4 Zebra crossing; traffic light | 10 | 25 | 100 |
| 5 Zebra crossing; tactile pavement | 10 | 50 | 50 |
| 6 Zebra crossing | 10 | 50 | 100 |
| 7 Crossing | 50 | 180 | 350 |
| Potential dangerous sites | |||
| 1 Boom barrier; post; chain barrier (at gates) | – | +15 | +25 |
| 2 Steps/stairs without handrail | – | +20 | +30 |
| 3 Postbox | – | +20 | +30 |
Note:
*Indicates a multiplying factor, while absolute numbers substitute the length of the segment
Point features or visual landmarks are a valuable support in wayfinding along a route (Serrão et al., 2014) and can be integrated in a routing network in ArcGIS by default, using the landmark setting. To distinguish between a general hint (e.g. entrance doors), landmarks (e.g. parking meters) and potentially dangerous locations (e.g. free-standing posts), which offer a different quality in the direction instructions, a specific pre-defined terminology is developed, and additional terms (e.g. “attention:” crossing without signal) show the importance of the element in the turn-by-turn instruction. Additional orientation cues, e.g. number of entrance doors passed along the route between two intersections, are summarized through post-processing and implemented in the directions. Boom bars, posts, chain barriers at gates were gathered through crowdsourcing and complemented by the field survey.
Contrarily to point features along a route, an ArcGIS network analyst provides no tool to include linear information besides the street names like the pavement or shorelines of the sidewalk in the wayfinding instructions. As this information is critically important for the users (Koester et al., 2017), it is added as attributes to the sidewalk network. The method chosen for this is a sequence of Python scripts transferring the information from separate data sets to the street/sidewalk segments using linear referencing. Information of this type includes:
surface of sidewalk;
tactile pavement (as linear feature); and
bordering elements (shorelines) like house walls, fences, hedges, etc.
The integration of directional information about linear elements in wayfinding is a novelty and is split into two parts. First, redundancy and overlapping information has to be removed in the sidewalk network data set. Therefore, sidewalk names, surface and street type serve as a basis for dissolving the network. Hence, street segments with similar attributes are generated. The assignment of shoreline information adjacent to sidewalks like walls, hedges, fences, etc. needs additional analytical steps to define information not too narrow or coarse for orientation. Moreover, a differentiation between left- and right-hand side of the sidewalk is important.
One part of shoreline information are house entrances, available as point features. To assign information on entrances to the network, long street segments need to be split up into small parts. The software Grass GIS is used to split sidewalks in 0.5 m (1.65 ft) segments. The width of entrance doors is approximately 1.1 m (3.5 ft). Hence, in any case of occurrence, an entrance is captured by a 0.5 m street segment and added as attribute.
Information about elements situated along the sidewalk is assigned through spatial join with a distance of 2.5 m (8.2 ft). The spatial join gathers attributes of objects within the given distance and links them to the street segments. The decision on the distance 2.5 m is made upon the minimum standard width of sidewalks in Austria, which is defined by 2 m (6.6 ft) (Section 3.1). As multiple objects can be located within this distance, e.g. a hedge parallel to a fence, objects are prioritized due to their importance based on perceptibility. In this case, the hedge will be chosen over the fence. In case of missing elements along the sidewalk, the distance is expanded to 6 m (19.7 fe), where house entrances, which are set back from the street, can be identified. The latter reflects the typical situation of front yards in urban quarters in Graz with Wilhelmina style.
After processing both sides of the sidewalk separately, parts with redundant information are aggregated with a minimum size of 3 m (9.8 ft) to reduce the number of turn-by-turn instructions in the routing description. The distance of 3 m was determined with the user group as appropriate minimum distance for instructions in the step-by-step directions. Exception to this are stairs, tactile elements, house entrances or driveways. The final sidewalk network is permuted into different network data sets, which are used for the user profiles, integrating the weighting of elements presented in Table 1.
3.3 Deduction of step-by-step directions
After the generation of sidewalk centerlines (Section 3.1), the next step to achieve a basic network for navigation and routing is the integration of intersections as well as the assignment of attributes. Although the approach follows clearly defined steps (Section 3.2), the primary result is insufficient for the user, as the information shows a multilevel structure and cannot be requested by the ArcGIS directions widget. Hence, Figure 1 illustrates the deduction of information respectively attributes and the consequent reduction of complexity for user-relevant information.
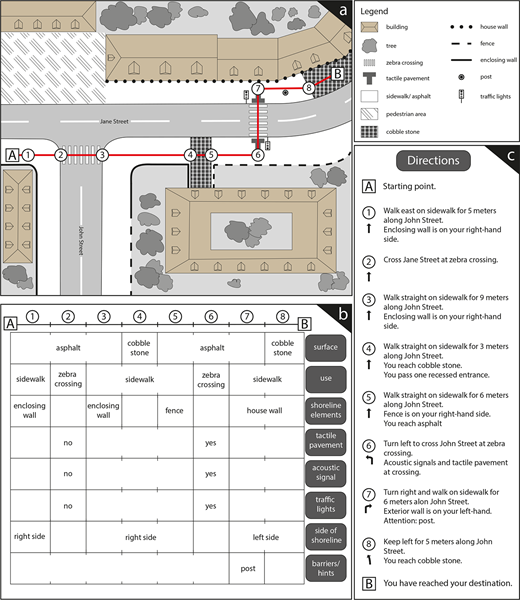
From real-world setting (a) via modelling of information (b) to turn-by-turn directions (c)
From real-world setting (a) via modelling of information (b) to turn-by-turn directions (c)
Figure 1(a) shows a typical urban real-world setting in a European context, including infrastructure of streets and intersections, shorelines as well as (visual) landmarks. Additionally, an exemplary route from a starting point (start) to a destination (end) is highlighted. The diagram below [Figure 1(b)] lists each level of information necessary to be included in the turn-by-turn directions. Every attribute is referenced to a part of the sidewalk being then combined to individual segments, holding a compound of several line-based information layers, namely, street name, type of use, surface type, shorelines, crossing type. In combination with the point-based layers (traffic lights with/without acoustic signal, tactile pavement, various landmarks), relevant information is extracted through generalization.
Generalization addresses information, which is redundant or too detailed. For example, the surface type of sidewalks is normally asphalt. The step-by-step description only indicates the surface type, if it differs from asphalt [see Figure 1(c), point 4]. Another example is the length of segments. Concatenated street segments with similar attributes are dissolved to one segment. Tiny segments are combined as described in Section 3.2, with attributes attached from the longest segment. The decision for aspect and type of generalization is technically determined and additionally refined during the user workshops and in the living lab. The exemplary description of a route is given in the results.
3.4 Post-processing to provide accessibility
Based on the sidewalk network data set, wayfinding information is calculated using the ArcGIS routing algorithm based on Dijkstra. This generates the basic elements of turn-by-turn directions for wayfinding. Standard directions for wayfinding are not sufficient for the user group because the information is too coarse. Additional processing needs to be made for adopting the wording syntax of the directions and presenting the user interface in an accessible way.
Ad (1) The directions widget of the ArcGIS WebApp Builder (2.0; 2.4) is used to prepare the wayfinding information. As the elements in the directions (network elements, intersections and point/linear hints, landmarks and barriers) can be combined in various ways, typical scenarios are developed. They define a system of rule diagrams, which are implemented in the syntax and wording of direction instructions through post processing (Figure 2). The post-processing takes the standard wording of the directions widget and searches for key items, e.g. zebra crossing. If a key item is detected, a pre-defined phrase is inserted into the configuration file. For example, in case of a zebra crossing, the part “cross “streetname” at” is added to the standard wording. Additionally, the infrastructure of crossings is retrieved from the attribute table of the crossing features (Section 3.1). This feature class is used as turn feature in the directions settings when generating the network data set. Type of crossing, tactile pavement as well as type of signaling will be indicated according to the occurrence in the attribute table and pre-defined wording, e.g. “traffic light with acoustic signal,” will be included in the step-by-step directions.

Ad (2) Next to the content, the application itself has to be accessible. Menu items and radio-buttons selectable by cursor keys, wizards of the user interface and the presentation of results need to be navigable by mouse as well as by keyboard for persons with VIB. This enables screen-reader software to find navigation items in the user interface. To achieve this goal, a consistent usability concept was developed in the design process of the application, following the Web content accessibility guidelines 2.0 (Web Accessibility Initiative (WAI), 2020) and user needs. Therefore, menu items are defined to be selectable by tab-key as well as radio-buttons, selectable by cursor keys, are integrated. This design is implemented in the source code of the widgets. In the development process, the most common screen-readers – resulting from a nation-wide survey – namely, JAWS 16.0 and NVDA 2015.3, were combined with Mozilla Firefox, Internet Explorer and Chrome.
The unconventional cartographic design follows a minimalistic principle, with a focus on contrast (size, color, hue) to meet the needs of the heterogeneous user group. The same holds true for the symbology, which is particularly designed for this map. Elements in the underlying basemap are restricted to street centerlines and names, building outlines, water bodies and green spaces (park and forest areas). Using vector tiles, the level of complexity could further be adjusted in correspondence to the zoom level.
4. Results
Following the methodology discussion, the results will focus on the turn-by-turn directions for wayfinding, the user profiles and finally the accessible map design. It is essential to highlight the transition from GIS network generation to the design of a user-friendly tool.
The indicated turn-by-turn directions returned by the directions widget constitute the central tool and a primary result of the application, as it directly draws on data from the underlying pedestrian sidewalk network. When querying a route between two points (addresses), a detailed description on the path is returned, being a sequential list of individual path sections, each carrying information on direction, street name, distance, surface, type of use, bordering elements and potential obstacles. The numbers indicate the individual turns accompanied by attributes of the point/line feature. The result is a list of turn-by-turn instructions for wayfinding from start to destination [Figure 1(c)].
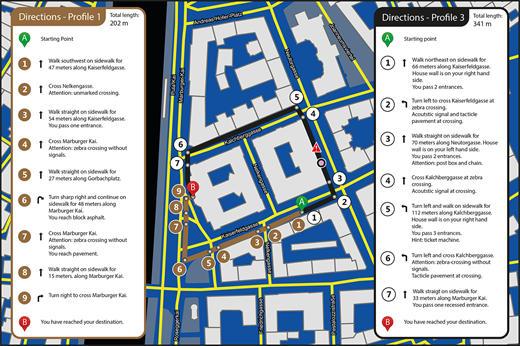
Leading back to the need for further individuality, the turn-by-turn directions are presented in dependence of the selected user profile. According to the profile, linear and point features are weighted in the routing algorithm (Table 1). While user profiles 2 and 3 present all information available and differ only in weighting factors, user profile 1 shows a reduced step-by-step instruction omitting shorelines. Consequentially, in correspondence with the routing and directions output in the final application, the profiles can be verbally described as follows:
Profile 1: User preference for shortest paths mostly along sidewalks, which may include open crossings (no signal/tactile guidance); no shorelines are returned.
Profile 2: Avoiding routes along mixed-use traffic areas, with a preference for crossings equipped with traffic signals; if available, implementation of hints/landmarks/potential barriers.
Profile 3: Stronger avoidance of crossings without acoustic signals and tactile guidelines as well as of mixed-use traffic areas and potential barriers; display of all orientation hints in the output; route might strongly differ in length compared to other profiles.
In addition to those three pre-set profiles, a fourth profile is introduced, allowing for further individual adjustment of output settings concerning hints, landmarks and barriers. The differences in results in accordance with profile selection for an inner-city example can be seen in Figure 3, which provides a direct comparison of a similar query based on two different user profiles (Profile 1, Profile 3).
Despite the directions depict the core of any sufficient wayfinding for persons with VIB, barrier-free usability and display of retrievable information is essential for service accessibility (Section 3.4). Developed with the Web AppBuilder for ArcGIS, the overall design of the platform is concise and reduced to essential elements and functionalities. Though the implementation of a map may seem contradictive in the context of persons who are blind, it is found to be essential for people with residual vision. The final application can be retrieved from https://barrierefrei.uni-graz.at/ways2see, best displaying functionality using a screen-reader.
The application is tested in a user-integrated process as well as technical debugging before public release. The form of a living lab (Höflehner and Zimmermann, 2018) is found to be most promising in terms of usability, where test subjects were given focused tasks in equal intervals. Feedback is given through open questions, due to the limited number of participants and qualitative focus on individual perceptions rather than quantitative evaluation. In more detail, five tasks are given to a group of 11 people (seven (legally) blind and four visually impaired) within a predefined timeframe. Figure 4 illustrates the most important test results of the user experience evaluation.
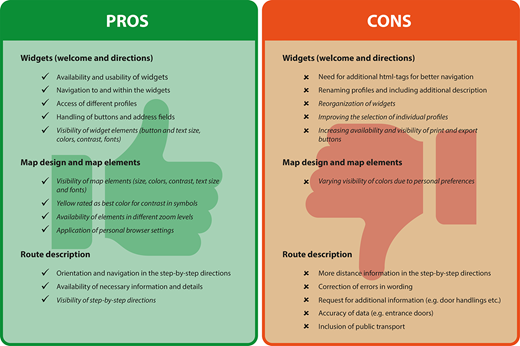
Pros and cons highlighting the results of the user experience evaluation (italic font refers to persons with VI only)
Pros and cons highlighting the results of the user experience evaluation (italic font refers to persons with VI only)
Testing started off with 15 questions regarding the overall technical compatibility of the application as well as on screen navigation. In terms of operating systems, test persons report the use of Microsoft Windows (64%), iOS (27%). One user did not specify the operating system in use (9%). Further, 36% of respondents use Internet Explorer, 27% Safari, 18% Mozilla Firefox and 9% Chrome. As to supportive software, 45% used JAWS and 18% VoiceOver, while VI (37 per cent) made use of magnifying software. All users (with and without screen-reader software) report good accessibility of the welcome screen and intuitive and smooth navigation. User profiles are selectable and visibility of objects (text size, color and style) appropriate. The result of the first testing is the need to change the named profiles to numbered profiles, adding detailed turn-by-turn directions of the resulting routes.
The second (14 questions) and third (11 questions) questionnaire address the visual accessibility of map objects, symbols and widgets. Testers with VI are asked to navigate to a familiar address and orient themselves on the map. All users with VI are able to select different categories of POI, identify map elements and differentiate between the symbols. The color yellow received the best rating regarding contrast, while other colors are rated due to personal preferences. For widget buttons, some minor changes (e.g. framing) have been implemented upon comments. Buttons size, color and contrast next to text size are considered appropriate by users.
In Task 4 (15 questions), the users are asked to examine and evaluate three pre-defined routes. At this point, the resulting turn-by-turn directions, regarding wording and quality of information, are evaluated. Within the final Task 5 (ten questions) additional routes are evaluated: one individual best-known route of each user is assessed in each profile; moreover, three unknown routes by each user as well as a route with individualized user-profile settings. In total, 88 route descriptions are examined. Comparing the different user profiles, three persons identify Profiles 2 and 3 as safer because the routing was changed to a route with accessible intersection equipment. User preferences show that some users prefer very detailed descriptions and a notification about all noticeable problems or irregularities (e.g. intersections, hints, barriers). At least two users are satisfied with the less detailed description of Profile 1, which is assessed by all users without specific problems.
Main results of Tasks 4 and 5 are summarized in positive comments as well as challenges (solved/unsolved). Screen-reader-related answers include 45–64% positive feedback, while feedback of persons with VI reflect all four participants. Challenges reflect individual answers.
Positive comments address orientation and navigation within the widget and the route description, access of different profiles and the availability of necessary information and details. The handling of the buttons and address fields in the widget works without specific problems. Additionally, the visibility of widget elements is rated good. The comments also show that every user is positive on deciding about the individually preferred profile.
Moreover, important challenges are identified, which lead to updates and debugging. Here, within additional html tags for better navigation are implemented, availability and visibility of print and export buttons are increased, distances are integrated in the step-by-step directions and errors in wording corrected. Finally, selection of individual settings is improved.
It has to be mentioned that some comments regarding the step-by-step directions remain without solution due to technical or data restrictions. These include a request for additional information, e.g. the description of door handlings or different wording in the directions (e.g. “turn your body,” etc.). Two issues that stay on the agenda are the integration of public transport routings in the wayfinding tool next to the accuracy of data, especially the number of entrance doors.
5. Discussion
The main goal of this paper is to present a new GIS-based design for a pedestrian routing network and its implementation in a wayfinding application for persons with VIB in urban areas. The sidewalk network is serving as a basis for an accessible application intended for pre-trip planning, and developed in a transdisciplinary process. Although many applications are available and have been designed, few are commonly used by persons with VIB. Beside other reasons, the lack of integration of the users during the development process and the need for an extensive amount of highly accurate data are the most important ones.
The design process of the introduced application completely involved the user group through a participatory process. The prerequisites for the application are elaborated in expert interviews next to a nation-wide survey, workshops in all development levels and a living lab. This leads to a different view concerning the intensity, frequency and the manner of use of the application. Consequently, the use of hints for wayfinding are reframed, e.g. barriers, identified as potentially dangerous, need to be recognized but not necessarily avoided. The development process shows a need for various levels of details in the turn-by-turn directions, leading to the definition of user profiles. Additionally, it is shown that only few persons with VIB are walking in new environments without training or preparation, but plan their routes in advance.
These findings, moreover, lead to some restrictions as well as open room for further discussion. The application is intended as a pre-trip planning tool; therefore, no GPS localization is included. It is not designed for portable use (although running on portable devices), acknowledging the idea of an application, which should enhance independence by not being reliant on using a device and offering the possibility to focus on the surrounding during locomotion. Still, there might be users preferring real-time location services. Moreover, the representation of a map on mobile devices is problematic – for users with and without disabilities.
On-trip use of the application leads to another point – the dependence on a technical device, and data involved in the wayfinding process. Keeping data up to date is highly difficult due to permanent change of urban environment, e.g. redesign of intersections, urban quarters or the fluctuation of construction sites. It opens up the demand for the inclusion of big data, real-time data and VGI. At time of writing, all of them are not fully technically mature. The application is designed to be transferable to other cities, being the result of its conceptualization and technical implementation through scripts. However, it is still implemented only to a medium-sized city and limited to German language. These restrictions are part of ongoing research.
6. Conclusion and future research
Enabling independent movement and wayfinding for persons with VIB is a crucial step to individual autonomy and consequently social inclusion. Within this regard, GIS has proven to be of particular importance. By focusing on specific requirements of people with VIB and explicitly incorporating their needs into the development of a pedestrian routing network, a contribution to self-determination can be made. Herein, the semi-automated approach for the generation of sidewalk data and comprehensive level of attribute assignment make for a complete novelty in the context of wayfinding for persons with VIB. Because of the dynamic design, a transfer of the model to other areas might be of great interest, providing the indicated data at hand. Individuality is further supported through the integration of various user profiles as well as the accessible design of the user interface. Throughout this process, the reflective work with and participation of users constitutes the core element of a transdisciplinary and inclusive product.
Aside from the presented research, there is still space for further progress, with one of the biggest issues being the continuous adaptation of data sets, as indicated before. So far, a semi-automated approach for updating landmark data and point features has been in the focus of research. However, in terms of sidewalk attribution, the complete omission of fieldwork is seemingly impossible at this time. Furthermore, the implementation of construction sites remains an open issue. Here, use of real-time data is promising but considered problematic. The reason for this is the need for quality control to provide users with a certainty for (save) routing. The combination of pedestrian routing with public transport will be a further step toward more autonomy in wayfinding. Regardless which focus further research in this context will take, the direction should be guided by persons with VIB, as a tool for this user group can only be developed in collaboration with the users.
The project “ways2see – Wayfinding for people with visual impairments or blindness” was funded by the Austrian Research Promotion Agency (FFG). The project team involved the SynerGIS Informationssysteme GmbH, covering the coding, the Odilien-Institute – Society for People with Visual Impairment or Blindness, providing applied knowledge and the University of Graz, Department of Geography and Regional Science as scientific leader of the project.

