Wellington’s (New Zealand) current road network has some clear vulnerabilities in the event of a major earthquake. Following such an event, the metropolitan area would be cut off by way of existing land routes for around 4 months (until the completion of construction of a key road into the region). Planning has been led by the Ministry of Civil Defence and Emergency Management (MCDEM) and the Wellington Region Emergency Management Office (WREMO) on initiatives to recover transport functions and avoid a potential humanitarian crisis. This has required close engagement with various utility providers, including road network providers and port and airport authorities, along with ferry operators and logistics organisations. While the recovery of the airport will provide quick access for passengers and light cargo, the recovery of the roll-on–roll-off (Roro) ferries, with their innate flexibility of use, will enable larger-scale freight to be brought into the region. The uncertainties around the availability of resilient infrastructure for the Roros to moor up to has led to assessments of the potential use of barges and pontoons which would allow unloading of the Roros. This paper describes the process by which MCDEM and WREMO have worked with the respective stakeholders to develop emergency plans.
1 Introduction
Wellington, the nation’s capital, is located at the south of New Zealand’s North Island. This paper considers the ‘metropolitan area’ with a population of over 380 000 people (Statistics NZ, 2017). The area is taken to comprise Porirua City, Upper Hutt City, Hutt City and Wellington City areas – all part of the Greater Wellington Region. As the capital, Wellington hosts the parliament buildings and many central and local government departments. Wellington’s port is also a central part of the transport link between New Zealand’s North and South Islands.
Five years ago, a study (Opus International Consultants, 2012) was commissioned by various Wellington region road-controlling authorities, which highlighted the vulnerability of the Wellington metropolitan area’s road network to a major earthquake. In 2013, in a report released by the Wellington Lifelines Group (WeLG, 2013), this susceptibility was outlined, along with descriptions on how long it would take to recover access to various parts of the region following a regional magnitude 7·5 earthquake. This report included some initial assumptions on the potential means of restoring access to isolated areas. While this provided some level of understanding of the vulnerability of the region to a major earthquake, it did not address in detail ‘how’ access could be restored following a major earthquake.
An example figure from that report is shown below as Figure 1.
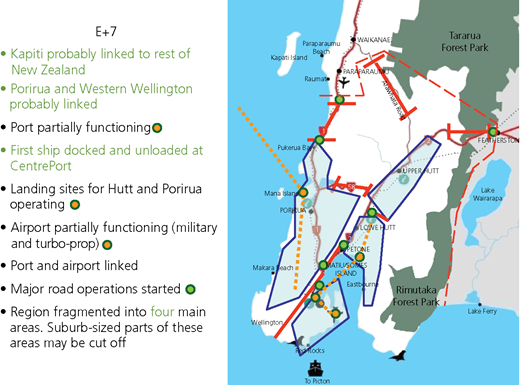
An example diagram from the WeLG 2013 report; in this case, the key transport disruption anticipated (with the 2013 transport network) 7 d following a regional magnitude 7·5 earthquake (see Section 2.1 for an explanation of this figure)
An example diagram from the WeLG 2013 report; in this case, the key transport disruption anticipated (with the 2013 transport network) 7 d following a regional magnitude 7·5 earthquake (see Section 2.1 for an explanation of this figure)
This paper outlines the planning process taken by the national (Ministry of Civil Defence and Emergency Management (MCDEM)) and regional (Wellington Region Emergency Management Office (WREMO)) civil defence bodies to understand better the weaknesses within the region’s transport infrastructure. With this knowledge, a viable emergency response plan for Wellington’s supply chain has been achieved.
Following a broad description of the transport infrastructure in the region, and the seismic hazard, the discussion describes the emergency planning process undertaken by MCDEM and WREMO. As is evidenced, by closely engaging with key stakeholders, it was possible to create a clear emergency access plan for the region.
2 Context for emergency planning considerations
This section outlines the hazard-scape of the Wellington region, which demonstrates the reason why emergency planning is necessary for transport outages that may affect the region. It also outlines key features of the transport infrastructure of the area.
2.1 Regional road network
Various fault lines have been mapped through the Wellington region. An overview of these fault lines is shown in Figure 2.
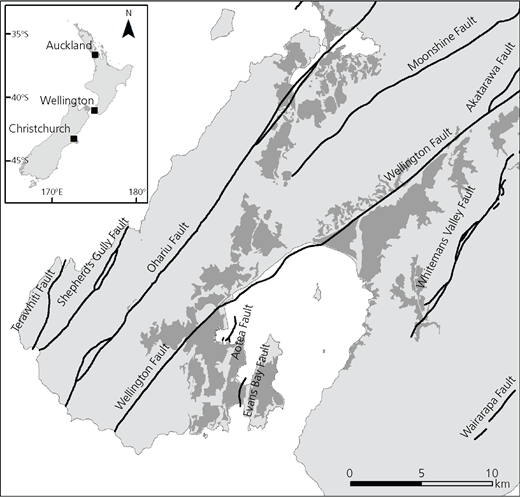
If any one of these major faults ruptured, significant regional shaking would be produced
If any one of these major faults ruptured, significant regional shaking would be produced
The road network of the Wellington region is constrained by the topographical features of the area. This means that the core road network (mainly composed of state highways) is a relatively simple network. The state highways are dual lane (SH58) or between dual lane and six lane (SH1 and SH2). The annual average daily traffic is up to a maximum of over 88 000 vehicles per day at the busiest part of the network. This busy section is SH1 just south of where it joins with SH2 at Ngauranga (NZTA, 2015); local arterial, distributor and residential roads comprise the remainder of the road network.
The 2012 seismic assessment of the Wellington road network highlighted that the four roads providing access from Wellington to the remainder of the North Island are all seismically vulnerable. The first road likely to have access restored in around 4 months following a magnitude 7·5 earthquake located in the region is SH1. Two other key vulnerabilities are located on SH2 (between Petone and Ngauranga) and SH58 (Haywards), where there is the potential for the region to be fragmented following an earthquake. This means that with the current road configuration, the Wellington metropolitan area could be cut off from the rest of the North Island by road transport for around 4 months. Further, there would be regional fragmentation of the metropolitan area by land transport for 2 months, with further fragmentation for some isolated areas. As time and emergency response activities progress, after around 10 weeks, two large areas would remain isolated – the Porirua and Wellington areas (to the west) and the Hutt Valley area (to the east). The preceding paragraph is summarised, as of ‘day 7 following an event’, in Figure 1. In addition to the preceding disruption, there would be widespread disruption of the local road network, leading to difficulties in regaining access generally across the network in the metropolitan area. (Access to the Porirua and Wellington City areas will be enhanced following the completion of construction of a new motorway into the region, estimated for completion in April 2020.)
2.2 Port
Wellington’s port is located in a natural harbour and handles approximately 135 000 containers (20′ (6·10 m) equivalents) per year, plus log operations (exporting cut logs), cruise operations (81 cruise ships are scheduled to visit CentrePort in the 2017/2018 season), two roll-on–roll-off (Roro) ferry terminals, general freight operations and fuel-transfer operations (CentrePort, 2017).
Much of the port infrastructure was constructed on reclaimed land. Figure 3 shows a part of the land that was reclaimed by a process of hydraulic fill, pumping the sands and gravels from the harbour floor over a newly constructed wall. While a very efficient means of land reclamation in 1925, the consequence is that some parts of the port are now vulnerable to liquefaction, which was evident following the November 2016 Kaikoura earthquake, and (in the case of the failure of the seawall) lateral spread.
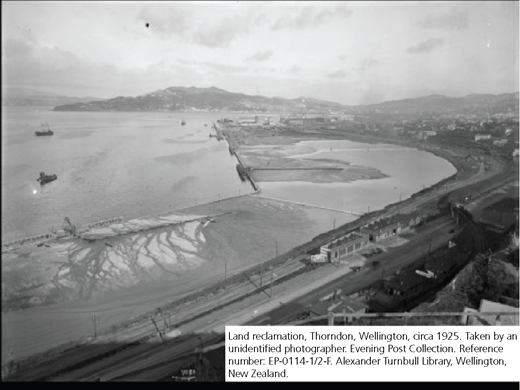
Example of the reclamation carried out (1925) in the construction of one part of CentrePort
Example of the reclamation carried out (1925) in the construction of one part of CentrePort
While some sections of the port are vulnerable to earthquake, other sections are known to be more seismically robust. This is significant, as Roro operations do not require land-based electricity to run. This means that these sections are likely to be available for operation following an earthquake event, even if power supply is lost.
2.3 Airport
The airport was constructed on a combination of local rock (around the 1·2 km at the northern end of the runway) and reclaimed land (around 1 km at the southern end of the runway). Fortunately, 1·2 km is sufficient for the operations of turboprop aircraft, which are regularly operated from the airport. This means that it is most likely that at least smaller passenger propeller aircraft (and some military) airport operations are likely to be able to function albeit initially at a reduced level, ‘within days’ of even a large local earthquake.
3 Organisational overview: emergency planning responsibilities
New Zealand’s Civil Defence Emergency Management Act 2002 states that ‘… every lifeline utility must … ensure that it is able to function to the fullest possible extent, even though this may be at a reduced level, during and after an emergency…’ (Parliamentary Counsel Office, 2002: section 60). The statement is deliberately non-prescriptive regarding how this function should be achieved. This allows the respective utility organisations (called ‘lifelines’) to determine the method they consider most appropriate to plan to be able to continue to carry out their functions post-event. Simplistically, this could be through the provision of secure, robust infrastructure (which can be an expensive choice), or through the creation and adoption of viable emergency-response plans.
While the preceding signals the intent for organisations either to upgrade vulnerable infrastructure or to create emergency plans, not all organisations are skilled at the creation of emergency plans. This is particularly the case when those plans may involve a change of mode of transport (e.g. from land to sea transport) or away from their normal zone of influence (e.g. from state highway network to local road network). This is where the Civil Defence Emergency Management (CDEM) planning function can take a leadership role in facilitating discussions between stakeholders to identify gaps in planning delivery and lead planning discussions.
There are vulnerabilities in the existing (2017) road and port facilities in the Wellington region, particularly from the earthquake hazard. This means that planning a transport response to a large earthquake is a complex task that requires the assessment of multimode transport options. This kind of planning requires detailed discussions with stakeholders to understand vulnerabilities, emergency transport needs and potential alternative means of transport provision.
From 2012 to 2017, work has been led by the CDEM bodies at national (MCDEM) and regional (WREMO) levels on emergency transport planning for this scenario. In terms of providing alternative transport options, considerable work was required to prove, or disprove, the viability of concept emergency plans identified in the WeLG ‘transport access’ report (WeLG, 2013). Once the viability of concept plans was established by MCDEM and WREMO, more detailed planning was carried out. This work involved creating ‘high-level’ plans and, as necessary, proven plans for specific parts of the transport functions.
This planning was made easier through stakeholder engagement with the respective agencies responsible for aspects of transport function. As stakeholders were aware of their Civil Defence Emergency Management Act 2002 obligations to work through specific issues through the planning process, full engagement was achieved. Their provision of advice and resources facilitated the planning of emergency transport functions, specifically emergency supply chain functions.
As an overview, the key stakeholders in this process are found in Table 1.
Overview of key stakeholders
| Key stakeholder | Relevant role |
|---|---|
| Central government | |
| MCDEM | National-level emergency planning |
| Local government | |
| Regional and local councils | Responsible both for emergency planning and for local road management |
| WREMO | As emergency planning body for the regional and local councils, for regional-level emergency planning |
| Lifeline utilities | |
| New Zealand Transport Agency | Operator/manager of the state highway network |
| CentrePort | Operator/manager of the port |
| Wellington International airport | Operator/manager of the airport |
| Other stakeholders | |
| Fast-moving consumer goods companies | The supermarkets and their associated logistics systems |
| Ferry operators | Ferry operations |
4 Planning for the logistical operations
This section outlines the process taken to create concept plans and engage with key stakeholders to produce a viable overall plan for emergency supply chain operations.
4.1 Concept plans
As outlined in Section 2.1, the lack of road access following a major earthquake meant that alternative transport means for serving the region needed to be identified. Of the alternatives, three were considered.
Sea transport – primarily by way of Roro.
The existing presence of Roro ships operating from Wellington port creates a key sea transport link between the New Zealand North and South Islands. The port and ferry infrastructure (link spans and wharves and some associated marshalling areas on and near the port) meant that the transport of freight and people by way of Roros was seen as a prime possibility for emergency planning for the supply chain. See Section 4.2 for details.
Air transport – by way of fixed wing (Wellington airport) and helicopter (Kapiti airport).
Wellington airport is located relatively close to the central business district (CBD) and to a significant proportion of the region’s suburbs. It is primarily for passenger movements, but with some cargo capacity. As outlined in Section 2.3, the northernmost section of the Wellington airport runway is robust, so it should be able to support emergency air movements. This makes the airport a key location for the restoration of transport access. The runway at Kapiti Coast airport (just north of the Wellington metropolitan area) is considered likely to be affected by liquefaction. However, its proximity to a road network that is relatively robust means that it presents as a viable option for helicopter operations.
Other land routes.
In a scenario where transport links may be compromised leading to isolated communities, any and all options for transporting freight and people will be considered in an actual event. While this is the case, few obviously viable alternative routes present themselves at this stage. If relevant, all will be investigated following a natural hazard event. However, the assumption is that other land routes will present a maximum of 10% of capacity of freight movements, probably by way of four-wheel drive tracks. Due to the difficulty of predicting which of the few tracks may be viable for use, no further planning was carried out on these tracks. Instead, it was acknowledged that they should be investigated post-event for their potential capacity and suitability for use.
4.2 Engaging with the port, Roro operators and logistics organisations
Roro operations presented the best viable option for transporting heavy freight and equipment, and in large quantities, into the region following a major earthquake, until road access was restored. To investigate possibilities further, discussions were held between a variety of stakeholders to create a concept plan for managing emergency Roro-centred operations. The key stakeholders engaged by MCDEM and WREMO were
CentrePort, the port management company (regarding information on linkspans, wharves and marshalling areas)
the Roro ferry operators (regarding the use of the Roros in such a plan, and for planning how the Roros would moor up to the relevant wharves)
the ‘fast-moving consumer goods’ (FMCG) companies (effectively the supermarket companies) regarding how they would interface with the Roro plan to deliver food and provisions to the region
logistics companies were engaged for their knowledge of how ‘general freight’ could be transported on Roros and throughout the region in an emergency event
the relevant road-controlling authorities (for the state highway and local roads networks) regarding the provision of access between the Roro facilities and the remainder of the region.
Discussions with the preceding stakeholders established that a concept emergency plan was viable for
the transport of emergency-management personnel and freight
resupply of commodities into the region
the transport of affected people and empty trucks/containers out of the region.
This provided the platform for further work in establishing specifics of an emergency supply chain (see Section 4.5) in response to the impacts of a major earthquake.
4.3 Investigating the availability and use of pontoons to enable Roro operations
While the port company could identify locations around the port that could be considered more robust than others, no single location could be considered totally robust due to the relative ‘randomness’ of damage that can occur due to earthquakes. Damage could occur to the wharves and road network near the port, and there is potential for impediments to sea-based ship movements. Because of this, the Ministry of Transport led a study to establish if a floating pontoon could be used to provide flexible access between a Roro and any wharf that is found, post-event, to be viable for use. This study explored both the availability of floating pontoons that are permanently located near the Wellington region, or the use of new or custom pontoons. It also broadly identified the locations where the pontoons could be moored to support Roro operations.
4.4 Establishing priority road routes
The plans for use of Roros (for freight) and use of air transport (for most passenger movements) are relatively prescriptive. This meant that work was also required to understand which roads should be prioritised for the restoration of access to/from key locations in such an event. MCDEM and WREMO led a process with the road-controlling authorities to establish the region’s ‘priority routes following a major regional earthquake’. The prioritisation process took into account the following aspects
key transport nodes in the region (including Wellington airport and likely Roro operations locations)
the likely availability of earth-moving machinery and fuel stocks in the region
the population centres (suburbs)
‘response priority sites’, as nominated by the local controller; these included 42 regionally and 61 locally prioritised sites, which comprise healthcare facilities, emergency responding organisations’ bases and key utility sites such as water sources and telephone exchanges
the location of supermarkets.
The outputs of this process, discussed and agreed on with the various road-controlling authorities (for state highway and local roads), were incorporated into the Wellington Region Earthquake Plan. The road priorities were assigned according to the following descriptions.
Priority 1: open a ‘spine’ route through the affected area and provide access to key locations such as medical facilities and key transport nodes.
Priority 2: reopen access to key infrastructure and large isolated communities.
Priority 3: reopen access to vulnerable communities (e.g. rest homes) and supermarkets.
Priority 4: reopen access to other residential communities.
The road priority plans were used to establish likely road restoration times to two ‘levels of service’ following an event, further aiding the planning process and providing informed advice on the time to restore access to suburbs and supermarkets. The two levels of service chosen were as follows.
‘Response’ level of service: a single lane of the road must be open and accessible for either an ambulance or 7·5 t rigid truck to access.
‘Recovery’ level of service: at least two lanes of the road must be open, allowing a typical family car and a full truck and trailer delivering to a supermarket to pass each other.
Using these levels of service, it was possible to understand how long it would take to restore access to areas around the region. This tool highlights which routes would require the first efforts to restore accessibility. Knowing the likely level of earth-moving equipment which would be available, indicative restoration times could be calculated.
4.5 Establishing how FMCGs would be transported
The Roro concept plan, outlined in Section 4.1, provided confidence that the relevant stakeholders would work together to create a Roro freight (and passenger) operation. Yet what was not clear was how the Roros could be loaded to optimal effect. Stakeholders were engaged to establish the most viable options for loading FMCGs (food provisions) on Roro decks. The options in Table 2 were investigated.
Options considered for loading Roros in an emergency
| Option | Ship capacity per average sailing (total of four Roros available) | Comments |
|---|---|---|
| Park curtain-sider trucks/trailers on the Roro decks (a curtain-sider is a truck with soft sides that can be drawn back for loading/unloading) | Assume 50 | In accordance with business-as-usual practice. Tie-down brackets on Roro decks would be used to secure loads. Numbers of curtain-sider trucks are limited in New Zealand. |
| Park standard 20′ or 40′ (6·10 or 12·2 m) containers on trailers on the Roro decks | Assume 50 40′ (12·2 m) containers | In accordance with business-as-usual practice. Tie-down brackets on Roro decks would be used to secure loads. |
| Park containers on port-specific short-distance shallow trailers on the Roro decks | Few MAAFIIs would be available; assume around ten | Not considered further due to the lack of capacity of this option. |
| Stow containers direct onto the Roro decks | Low capacity as tie-downs take up much deck space | Slow operation. Poor use of time in comparison to other options. |
| Block-stow freight on the deck, such as on wooden pallets (pack everything in tight) | Very low capacity, as single-level loading only is possible | Only do this if one cannot otherwise get the ramps down on the Roros. This option allows a high degree of flexibility of loading, but is slow and manpower intensive. |
| For other freight types – oversized loads and earth-moving equipment, dangerous goods, refrigerated trailers, smaller vehicles and so on | Variable, dependent on nature of load | Various considerations required on ‘special loads’. Some planning undertaken on specific issues such as earth-moving machinery. |
From the options in Table 2, it was established that transport of general freight was best carried out in standard 40′ (12·2 m) containers, loaded on standard 40′ trailers. This is because both containers and trailers are relatively readily available around New Zealand, being the standard means of transport of freight by many companies in the country.
It was also established that the FMCG companies themselves could accommodate the use of 40′ containers and trailers in their loading (at distribution centres) and unloading (at supermarkets) operations. This meant that the use of containers and trailers for the transport of provisions was the most viable plan for the transport of provisions for the region. Of course, this requires the availability of road access between the Roro facility and the respective supermarkets, as addressed in Section 4.4.
4.6 Helicopter deliveries
The preceding Roro concept plan requires the availability of road access within the Wellington region, specifically between the Roro terminal and the supermarkets and other key locations. As outlined in Figure 1, in many suburbs, road access will not be viable for a number of days after a major earthquake. This brings on thoughts of alternative means of delivery of provisions to outlying suburbs. One alternate option for delivery of provisions is helicopter transport. As outlined in Section 4.1, helicopter operations could be sustained from Kapiti Coast airport. Unfortunately, there will be a high demand on the pool of helicopters that would be available nationally for such an emergency operation.
Only two types of helicopters would be capable of carrying cargo – namely, those that can carry up to 1 t of cargo and heavy-lift helicopters. Of those two types, the other priorities for the use of helicopters include (potential) firefighting, medical evacuations, movement of essential emergency-management personnel and urban search and rescue activities. The limited resource available for helicopter transport means that there may be an inability to maintain a supply chain of critical supplies to some areas, if they are not adequately stocked prior to the emergency event either at households or within the supply chain. The highlighting of this issue has led to local government in Wellington conducting an information campaign to the public on the need to store adequate supplies of emergency food.
4.7 Formalising plans between diverse stakeholders
Some aspects of the preceding plans had been developed over a period (largely 2015/2016). The task of bringing together those various plans and results of engagements was carried out through the production of two plans: the (MCDEM-led) Wellington Earthquake National Initial Response Plan (WENIRP) (MCDEM, 2017) and the (WREMO-led) Wellington Region Earthquake Plan (currently under production, 2017). These two documents have been essential in providing a means of engaging with the key stakeholders and documenting the resulting plans. The two plans were envisaged as encapsulating the national response to a Wellington earthquake, which involves effort across regions and with international assistance (national-level actions). Regionally coordinated local actions involve activities within the Wellington region itself. This delineation has helped the relevant stakeholders take ownership of their own tasks and zones of influence; it has helped keep the size and complexities of each plan to a manageable level.
4.8 Overview of planned emergency supply chain
The locations and nature of the supply chain were summarised in a diagram, which was included in the 2017 version of the WENIRP. This is as shown in Figure 4.
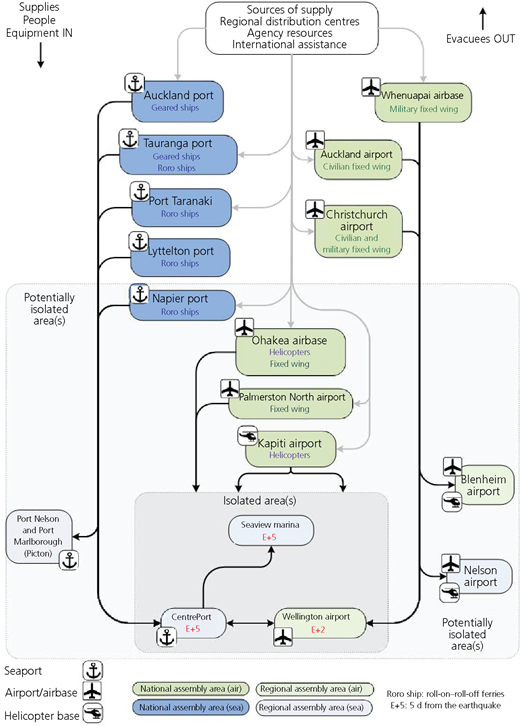
Overview of the supply and transport concept for the national response
Overview of the supply and transport concept for the national response
5 The benefit of taking an overall planning process (across disciplines)
The coordination of the emergency-planning effort was required across multiple stakeholders – namely the road authorities, local government, the port, the airport, the New Zealand Defence Force and the FMCGs (supermarkets). This coordination of effort and strategy probably could not have been carried out by any of the preceding stakeholders in isolation. This is partly due to a lack of mandate to do so, but largely because they would likely only see their own segments of the overall system. This is where the benefit of the emergency-management sector taking a coordinating and leadership role has proven itself. While most in the emergency-management sector are not experts in any of the specific fields touched on (e.g. logistics or shipping), the engagement with the experts in the respective sectors has allowed for the best available advice to have been taken. This qualified advice has enabled response courses of action to be actively considered and planned for.
In addition to the preceding statement, an initiative actively to improve household resilience has been pursued. This is because it is recognised that deliveries of fresh supplies will be severely limited within at least the first 7 d following an event. Local and regional councils have gone to considerable effort to plan for water storage, food storage and various other matters that would improve the resilience of households and individuals across the region. The coordination of this work was made possible due to the ‘ownership’ of emergency response by central and local governments.
6 Conclusions
The following conclusions may be taken from the process undertaken on the planning of an emergency supply chain for the Wellington region in the case of a major earthquake or road outage.
The value of undertaking road hazard mapping was realised in that it highlighted the vulnerability of the Wellington region to a road outage. This hazard mapping has proven influential in understanding the vulnerability of the region, the need to create an emergency plan and the necessity to consider upgrades in the road (and wider infrastructure) network to improve the resilience of the region. The production of outage maps for a specific scenario for the road network was a key step in highlighting the need for further action.
Secondly, having identified the vulnerability of the region to road outages, the need to produce a viable emergency supply plan was clearly identified. Having a sector that could take a leadership role in the coordination of a creation of a response strategy and the creation of an emergency plan was key. In this respect, the plan was advanced to a stage that showed that it was viable and demonstrated the ‘level of service’ that could be expected post-event. One of the recommendations at the end of the planning process will be to undertake an exercise on specific aspects of the plan, which would test assumptions and prove further the viability of key segments of the plan.
Thirdly, while the development of a plan has been highly valuable, perhaps of greater value has been the close engagement between respective sectors in creating the plan. Engaging with a wide range of stakeholders has enabled detailed planning to be undertaken and has allowed all parties to have a reasonable indication of their respective actions in such an event. This engagement and understanding across sectors, and knowledge of those that would be responding, will be essential in the event of actual plan implementation.
Finally, this planning process has highlighted that even with the full delivery of the preceding plan, there will be shortages, and time delays, of supplies to the region. This understanding has been very useful for prioritising planning and providing a case for investment in Wellington’s infrastructure resilience.