

The purpose of this paper is to explore the impact of recent developments in corporate reporting, specifically from the carbon disclosure project (CDP) environment, in the evolution of European post-crisis financial markets.
Theoretical and instrumental advancements from nonlinear dynamics have been applied to the analysis of market behaviour and the online presence or reputation of major European listed banks.
The application of a nonlinear statistical methodology (i.e. the autoregressive fractionally integrated moving average [ARFIMA] estimation model) demonstrates the presence of a long history of collected data, thus indicating a certain degree of predictability in the time series. Also, this study confirms the existence of structural breakpoints, specifically the impact of the CDP reporting in both stock prices and online search trends of the sampled companies for certain periods.
This study introduces new methodological perspectives in corporate reporting studies, as the application of nonlinear techniques can be more effective in capturing corporate transparency issues. A limitation to overcome is to explore whether the impact of reporting is different due to the specific reporting behaviour each company adopts.
The “breakpoint” concept should enlighten the importance to firms of providing more information in specific moments, which can impact on both traditional (i.e. stock prices) and modern (i.e. online popularity) performance metrics. Additionally, it should be taken into account by stakeholders, when analysing the accountability of firms to improve their decision-making processes and policymakers, for monitoring and contrasting speculative and insider trading activities.
Online search trends represent a new public attitude to how society “measures” the effectiveness of firms’ disclosure behaviours.
Combining ARFIMA with structural break techniques can be regarded as a relevant and complementary addition to classic “market reaction” or “value relevance” techniques.
1. Introduction
The recent financial crisis is likely to be similar to other historical financial shocks (Reinhart and Rogoff, 2008). A frequently cited similarity between several of these episodes is the lack of transparency in both corporations and states (Gelos and Wei, 2005). Ho et al. (2017) establishes that institutional factors and corporate governance are key aspects in explaining stock market developments; moreover, corporate transparency appears to be a central matter in market settings. In the most recent crisis, transparency and disclosure norms were lacking in several different aspects. As these similarities are widely accepted, it seems clear that the surveillance of 21st century companies directly depends on their ability to be perceived as sustainable and to receive the acquiescence of a broader set of stakeholders, comprised of shareholders-investors, employees, customers, suppliers, public administration and the environment, mainly by means of an adequate reporting process. Widespread interest has been devoted to corporate sustainability reporting and management practices over the past two decades. Specifically, recent studies reveal an increasing attention of the scholars in discussions of the integration of climate aspects into accounting (Schaltegger and Custora, 2012; Stechemesser and Guenther, 2012; Wegener et al., 2019). Greenhouse gas emissions and water consumption, along with their external assurance, play a significant, incremental role in explaining the variation in the level and nature of corporate environmental reporting (Braam et al., 2016). A similar evidence concerns the positive relationship between corporate climate change disclosures and firm size, whereas profitability and leverage are not significant (Eleftheriadis and Anagnostopoulou, 2015). Plumlee et al. (2015) provide evidence that voluntary environmental quality is associated with firm value, using the global reporting initiative (GRI) as a reporting framework. In this context, a strong motivation for companies to disclose environmental information is to improve their shareholders’ returns and investment recommendations, as suggested by previous evidences (Griffin and Sun, 2013; Martínez‐Ferrero et al., 2016; Al-Shaer, 2018; Rashid, 2018).
Despite these developments, the precise impact of environmental disclosure on financial markets is a key topic of discussion in both industry and academia. On the one hand, investors encourage companies to report on their climate change-related risks and opportunities, their greenhouse gas emissions and their climate change management systems and processes. On the other hand, it is not clear whether each type of reporting has the same impact on business and market performance, even though several of the most relevant transparency initiatives are directly promoted by investors themselves (Iraldo et al., 2009; Sullivan and Gouldson, 2012). The carbon disclosure project (CDP) is a good example of those initiatives. According to its website, CDP runs a global disclosure system that enables companies, cities, states and regions to measure and manage their environmental impacts by means of one of the most comprehensive collections of self-reported environmental data in the world. It consists of a network of investors and purchasers, representing over US$100tn, along with policy-makers around the globe, with the aim of using such a data set to promote and support better-informed decisions. With offices and partners in 50 countries and a multitude of entities from over 90 countries disclosing through CDP on an annual basis, such network can be considered a major global actor in nonfinancial reporting. Therefore, the CDP represents an ideal setting to further advance the research on the investors’ reactions to environmental corporate disclosure.
To study the impact of reporting events on firm value as perceived by investors, it is possible to use the well-established methodology consisting of examining the reactions of stock prices to current events. However, the underlying mathematical structure usually proposed for these models of abnormal returns is linear. Some authors suggest that nonlinear models can be more effective in capturing the effect of reporting and are potentially weakening the intellectual hold of the traditional capital markets paradigm (Mouck, 1998; Glen, 2005). Specifically, when dealing with breakpoint detections – which are a fruitful approach to analyse the impact of a number of events in a time series – nonlinear models are a common technique used (Aue and Horváth, 2013). As surveyed by Middleton (2015), studies investigating the relationship between stock prices and environmental performance generally show that environmental performance tends to be somewhat relevant to investors, but the literature provides mixed results. Therefore, in this context, it is relevant to obtain new empirical evidence on how key voluntary reporting guidelines could significantly alter the reporting environment, perhaps even in the long run from the perspective of the investors and other stakeholders. To do so, it is also relevant to test those instruments provided by recent developments in nonlinear dynamics, which have already provided meaningful insights on how markets systematically diverge from information efficiency and show some indications of predictability.
To summarise, the aim of this paper is to explore the impact of recent developments in corporate reporting, specifically from the CDP environment, in light of the nonlinear dynamics applied to the analysis of market behaviour and the online presence or reputation of major listed corporations. Because of its global economic relevance and because a large proportion of CDP participant firms are European, Europe has been selected as a focus area for this first attempt. The European Union, additionally, is exerting efforts to promote corporate reporting beyond its classic financial aspect, with the Directive 2014/95/EU on the disclosure of non-financial and diversity information by certain large undertakings and groups, thus making this study useful for providing insights in this regulatory process.
Our contribution to the extant literature is twofold. First, we extend the carbon disclosure literature by drawing on fractal market analysis. Such a nonlinear approach has been widely applied in financial studies (Panas, 2001; Mynhardt et al., 2014; Ikeda, 2017; Ftiti et al., 2019; Arbi Madani and Ftiti, 2020), but a research gap still exists in the environmental and carbon disclosure context. Second, we draw on the contribution of Flores-Muñoz et al. (2019b) to introduce a new proxy of “online popularity”, i.e. Google Trends series, to enrich the empirical evidences on stakeholders’ reactions to carbon disclosure practices. In doing so, our findings add to existing evidences on the use or web search analytics to make successful forecasts (Choi and Varian, 2012; Preis et al., 2013) and provide useful insights both to policymakers’ transparency requirements and investors’ decisions, especially in the evolution of European post-crisis financial markets.
The remainder of this paper is structured as follows. The Section 2 provides background information on the evolution of corporate reporting, including the most recent initiatives concerning the production of nonfinancial information for shareholders’ user needs. Section 3 reviews the literature on market reactions to environmental disclosure and market behaviour under the fractal approach. Section 4 reports the empirical research method, followed by the study’s results and discussion in Section 5. Conclusions, limitations and suggestions for future research are outlined in the Section 6.
2. Background on emerging corporate reporting initiatives
The frontier between shareholders and stakeholders has become vague in recent years. There is increased stakeholder pressure that requires companies to be transparent about their sustainability practices. For many years now, leading companies have found that the integration of social and environmental objectives into their broader operational and financial missions can not only assist regulatory compliance but also can become a basis for developing unique competitive advantages. This allows them to respond effectively and proactively to the increasing social and environmental responsibility demands of customers, insurance companies, green investors, ethical trusts and innovative competitors (Azzone and Bertelè, 1994; Peloza, 2009), as well as to adopt assurance services for their sustainability reports (Tarquinio and Rossi, 2017; Larrinaga et al., 2020). Therefore, when dealing with non-financial reporting, a key challenge arises as follows: the need for a standard to guide companies in preparing and disclosing such reports.
Since 1991, there have been several projects aimed at responding to this demand. In that year, the American Institute of Certified Public Accountants (AICPA), given the growing demands for an improved corporate reporting model, established the Special Committee on financial reporting, also known as the Jenkins Committee (AICPA, 1991). This discussion forum was set up to analyse users’ increasing demands for business information (focussing on investors and lenders) and to develop the content of companies’ business reports to accommodate users’ needs. One of the most interesting attempts to improve accounting information came from the document entitled “improving business reporting – a customer focus”, commonly referred to as the Jenkins Report, issued in December 1994. The motivation of the Jenkins Report was to address the general dissatisfaction with the current model of financial information. Additionally, in January 2003, the AICPA established the Special Committee on Enhanced business reporting to take action against initiatives that had fallen into oblivion such as the Jenkins Report. The Committee concluded its work in 2005, having brought together a consortium of investors, creditors, regulators, managers and other stakeholders to improve the quality and transparency of the information used for business decision-making; thus, the enhanced business reporting consortium was born. The Enhanced business reporting framework was published in October 2005 and was intended to promote greater transparency regarding the strategy and performance of businesses. This framework organises the disclosure of additional information not currently covered by the generally accepted accounting principles and recommends companies disclose information on corporate responsibility from both its main perspectives, namely, respect and protection of the natural environment and commitment to social, ethical and charitable principles (EBR, 2013). This reporting framework also contains disclosure items related to the analysis of the environment and the strategy of the company, combining historical and prospective reporting items. In parallel, an international organisation based in Amsterdam, bringing together numerous agencies, associations and enterprises, launched the GRI in 1997. The GRI is comprised of an extensive network of stakeholders, including business organisations, non-governmental organizations and universities, etc, which develops guidelines to promote a conceptual framework allowing the continuous improvement of sustainability reporting. These standards include a set of principles and indicators that organisations use to measure and report on the economic, social and environmental areas of their performance (a triple bottom line).
Three non-binding standards that have also had great influence, from an institutional point of view, on non-financial reporting are: the United Nations Global Compact, the conventions of the international labour organisation (ILO, 2014) and the OECD guidelines (OECD, 2013). The European Union has also issued several statements and recommendations on corporate social responsibility (CSR) and sustainable development such as the European strategy for sustainable development and the green paper on promoting a European framework for CSR. With respect to other organisations of a private character, AccountAbility also had an important influence on enterprises. AccountAbility is a global non-profit entity, the purpose of which is to promote innovations in accountability that foster sustainable development. The network engages with businesses, governments and civil society organisations to advance responsible practices in business and management through the cooperation of public and private institutions (AccountAbility, 2008). Other standards of note are the international standards of accounting and reporting (ISAR, 2014), which provides voluntary technical guidance on eco-efficiency indicators, corporate responsibility reporting and corporate governance disclosure and the ISO 14000 environmental management standard.
In 2002, the CDP, an international non-profit organisation, was born as a global initiative to drive corporations to measure, disclose and manage their environmental risks and reduce their carbon emissions. The CDP works with market forces, including 827 institutional investors with assets of US$100tn. The CDP encourages companies to disclose their impact on the environment and natural resources and take action to reduce them. The CDP now holds the largest global collection of information on primary climate change, water and forest risk commodities and puts these insights at the heart of strategic business, investment and policy decisions. Over 5,600 organisations, including 81% of the world’s largest public companies, now use the CDP to disclose vital environmental information to investors and major purchasers (CDP, 2017; Blanco et al., 2016). Finally, the CDP has been working with several digital standards to revolutionise the way in which the world’s most powerful organisations report their climate change information.
3. Related literature review
Following the development of a variety of consortia and guidelines, companies have dramatically increased the amount of information disclosed as a result of reporting not only their financial but also their environmental and social issues in longer and more complex annual reports or by providing sustainability reports alongside their traditional financial data. Moreover, little is known about how comprehensively firms are currently measuring their supply chain carbon emissions (Blanco et al., 2016). The main research question in this arena is whether, after all these efforts, shareholders in particular and stakeholders in general are able to gain full advantage of this richer reporting environment and to what extent such reporting practices significantly change market behaviour in a turbulent environment. For this purpose, we organise our literature review in two categories, as in the following subsections.
3.1 The relationship between non-financial disclosure and market reactions
Of particular interest are the empirical studies on the relationship between carbon disclosure – frequently included within the environmental and social disclosure practices – and market reactions (details in Appendix 1). Early investigations reveal the absence or a weak support for such relationship. For example, Carnevale et al. (2012) analyse the value that the financial markets attribute to European banks committed in CSR reporting. Their findings reveal a non-significant correlation between the publication of a social report and the stock price, execpt for some countries. Another evidence is provided by Sullivan and Gouldson (2012), for which the voluntary carbon reporting by UK supermarkets does not satisfy investors’ needs. However, the authors recognise that active investor interest in the data being reported both mandatorily and voluntarily might offer the greatest potential for progress on carbon reporting. The valuation relevance analysis of greenhouse gas emissions under the European Union carbon emissions trading scheme conducted by Clarkson et al. (2015) shows that the inclusion of an environmental disclosure measure (i.e. the CDP’s carbon disclosure leadership index) does not affect the financial market reactions. Similarly, in examining the relationship between the quality of a firm’s voluntary environmental disclosures and firm value in USA, Plumlee et al. (2015) find limited support for the impact of some partitions of total disclosure score (e.g. type, nature, etc.) on stock prices, but with a mix of positive and negative signs.
Further evidences support significant impacts of carbon dislcosure on financial markets. Griffin and Sun (2013) find that managers’ disclosure decisions involving greenhouse gas emissions produce positive returns to shareholders in the three-day interval around the disclosure date in USA. Another interesting evidence is provided by Mohamed and Faouzi (2014), who find a relationship mediated by social reputation of US companies: the social disclosure is positively associated with the social reputation of the company and that reputation has a financial impact because it is associated with the market value. Thus, investors react to corporate social and environmental disclosure and use this measuring social performance information in making their investment decision. de Villiers and Marques (2016) study the relationship between the different levels of CSR disclosures of the largest European firms and a number of factors suggested by legitimacy and agency perspectives. As the results show that higher levels of CSR disclosure are associated with higher share prices, they conclude that CSR disclosures can be said to embody information, that is value relevant to investors. Interestingly, Martínez‐Ferrero et al. (2016) find a bidirectional relationship between voluntary CSR disclosure and asymmetric information in environments characterised by a strong focus and commitment to stakeholders. They conclude that companies can improve the trust of financial markets through sustainability disclosure of information, thus increasing shareholder value.
However, in contrast to the evidences above, some studies find negative relationships between carbon disclosure and market reactions. For example, Matsumura et al. (2014) find that US markets penalise all firms for their carbon emissions, despite the median market value of firms that disclose their carbon emissions is higher than that of their non-disclosing counterparts. Thus, while all firms are penalised for their carbon emissions, firms that do not disclose their carbon emissions face a further capital market penalty. Environmental disclosures also decrease market value of Jordan firms, despite such relationship is noticed only in the food and beverage industry (Omar and Zallom, 2016). Griffin et al. (2017) find that greenhouse gas emissions levels associate negatively with stock price in USA. They also find that investors’ response around the 8-K filing date does not differ significantly for CDP disclosers vs CDP nondisclosers, thus concluding that disclosure to the CDP makes no difference to the way investors view the impact of greenhouse gas emissions on firm value.
In sum, all these findings highlight the relevance of sustainability information to capital market participants, despite a mix of different findings. The effect of environmental reporting on market variables, therefore, is still a matter to address. This leads to overcome the limits of traditional empirical approaches by drawing on nonlinear research methods, like the fractal approach, as reviewd in the next subsection.
3.2 Fractal-based analysis of financial market behaviours
From a methodological point of view, the behaviour of financial markets has been regarded as nonlinear and somewhat inefficient by several authors (Mandelbrot and Taylor, 1967). Barnett and Serletis (2000) review a substantial literature testing for nonlinear dynamics on financial data, for which a clear evidence of nonlinear dependence and some evidence of chaos are found. For the purpose of this study, we focus now on the fractal-based approach used by previous studies (details in Appendix 1) to empirically investigate financial markets behaviours.
The first systematic contribution on fractal market analysis is provided by Peters (1994). Drawing on chaos theory, the fractal market hypothesis (FMH) is developed to understand why self-similar statistical structures exist in financial markets movements. A key assumption of such approach is that information is valued according to the investment horizon of the investors. Therefore, the main consequence is that “prices may not reflect all available information, but only the information important to that investment horizon” (Peters, 1994, p. 49).
Several studies followed the FMH. For example, Panas (2001) apply a fractal dimension of the time series to investigate the distribution of stock returns in the Athens Stock Exchange. Results provide evidence of a long-memory fractional process. Mynhardt et al. (2014) examine the behaviour of financial markets efficiency in a number of developed and developing countries during the recent financial market crisis. They find the presence of the properties of “persistence” and “antipersistence” in time series, thus demonstrating the presence of long-term memory in the financial markets analysed. Ikeda (2017) provides an empirical analysis of world stock markets and finds that the majority of world stock prices are consistent with the FMH, rather than the efficient market hypothesis (EMH).
More recent studies introduce new insights to investigate the predictability and self-similarity market behaviours under the fractal approach. On the one hand, Flores-Muñoz et al. (2019b) compare the behaviour of stock market prices with a measure of online presence applying a fractal-based statistical model to a sample of global tourist corporations. They find a substantial presence of long memory, thus suggesting that both stock market prices and online search trends deserve further exploration for modelling and forecasting. On the other hand, Ftiti et al. (2019) propose a new empirical framework based on multi-fractality, to investigate drivers and nature of the returns-volume relationship in oil and gas markets. They find a significant multi-fractal correlation between price and volume with sources of persistence, i.e. long memory behaviour, over time. A similar multifractal approach is applied by Arbi Madani and Ftiti (2020) to measure the dependence for medium (calm period) and large (extreme movement) fluctuations of gold, oil prices and exchange rates. Findings confirm evidence of cross-correlations among several fluctuations considering the different time horizons of market participants.
Drawing on such literature, this study questions whether this nonlinear pattern can be of help in determining the effect of environmental reporting as a relevant breakpoint, being the CDP disclosure the specific research setting. We also investigate if such evidences can be extended to other relevant time series beyond stock prices such as those that play the role of proxy for online presence or reputation.
4. Research method
4.1 Market dynamics and complexity: applying the autoregressive fractionally integrated moving average model
This study is based on Peters’ (1994) FMH. Such a model provides an alternative framework to the EMH (Fama, 1970) for investigating the discontinuity of market dynamics. Two basic assumptions are relevant for the purpose of this study, namely, FMH1: the market is made up of many individuals with a large number of different investment horizons; and FMH2: information has a different impact on different investment horizons, thus financial markets have a fractal structure, as investors have different time investment horizons. This approach aligns with Mandelbrot’s (1983) concept of fractal dimension, for which dimensions do not need to take integer values (0 in a point, 1 in a line, 2 in a plane figure, 3 in a body, as in Euclidean geometry) but also fractional values (Figure 1).

Following Flores-Muñoz et al.’s (2019a, 2019b) reasoning, Mandelbrot’s (1983) dimension could be connected with time series analysis by means of the so-called “long-range dependence systems” or “long memory processes”. Specifically, the autoregressive fractionally integrated moving average (ARFIMA) estimation model, originally proposed by Granger and Joyeux (1980), is an useful technique to analyse the fractal dimension in time series ( Appendix 2 and related references for technical details). The focus is on the fractional differencing parameter d, as it reflects the number of times the series need to be differenced to achieve stationarity (Box and Jenkins, 1976). A non-integer value for d is connected to the concept of fractal dimension D developed by Mandelbrot, as follows (Peters, 1994):
from which:
if d = 0, the process does not present long memory;
if 0 < d < 0.5, the process is persistent and presents long memory;
if d = 0.5, the process can be considered as random walk (i.e.w it is unpredictable).
If the parameter d is statistically different from 0 and 0.5, a time series is related to long memory and would be subject to a certain degree of predictability. As noted by Barnett and Serletis’s (2000) review, fractional integration is an effective way to parameterize long-memory processes of financial asset prices, rather than the usual alternative of the stationary series. Glen (2005) also identifies the chaos theory as an alternative instrument to understand markets behaviour going beyond the EMH. The ARFIMA technique is applied in some previous empirical studies, as shown in our previous literature review in Section 3 (Panas, 2001; Flores-Muñoz et al., 2019b; Arbi Madani and Ftiti, 2020). Hence, our attempt is to apply such nonlinear approach within a new context, i.e. the carbon disclosure practices. In this regard, combining ARFIMA with structural break techniques can be regarded as a relevant complement to classic “market reaction” or “value relevance” techniques, specifically when applied to the impact of environmental disclosure.
4.2 Structural breakpoints
Once ARFIMA parameters have been estimated, there is the possibility of exploring the existence and relevance of structural breaks and, if they exist, whether it is possible to link them to the firms’ reporting behaviour. Aue and Horváth (2013) have reviewed a number of other tools to examine the presence of relevant breakpoints in time series; etc., these authors mention the long memory processes as those to which breakpoint detection techniques can be applied. Tests for parameter instability and structural change in regression models have been an important part of applied econometric work, dating back to Chow (1960), who tested for regime change at a priori known dates using an F-statistic.
In this initial paper, the selection of a concrete break is performed by the researcher when the report is released by the CDP’s reporting programme: i.e. the moment in which certain reporting pieces are made public can have a relevant impact. Authors like Cao et al. (2010) studied late reports and found that the impact in terms of market response was different depending on the reason that motivated the delay. This suggests that the markets (and, it can be argued, all stakeholders) expect certain content at specific moments.
The use of metrics related to chaos theory to detect ex-ante and ex-post effects of events on markets is not new. Mynhardt et al. (2014) detected how the Hurst (1951) exponent (a complementary measure of the d in ARFIMA considered as an indicator of market persistence) was significantly different before and after the financial crisis of 2007-2009 based on Ukrainian financial data.
4.3 Sample
The European Union is the focus area of this first attempt, as long as recent extra regulatory efforts have been performed to promote corporate reporting beyond its classical financial aspects. According to Stoxx (2016), the STOXX All Europe 100 Index provides a blue-chip representation of the largest companies in Western and Eastern Europe; the index contains 100 stocks from Austria, Belgium, Croatia, Cyprus, Czech Republic, Denmark, Finland, France, Germany, Greece, Hungary, Iceland, Ireland, Italy, Latvia, Lithuania, Luxembourg, Macedonia, Malta, The Netherlands, Norway, Poland, Portugal, Romania, Russia, Serbia, Slovakia, Slovenia, Spain, Sweden, Switzerland, Ukraine and the UK. The STOXX All Europe 100 Index is designed to serve as a highly liquid underlying for financial products. Stock prices were collected using Yahoo Finance’s public website. Google Trends were also gathered as a proxy for online reputation, as it has been regarded as a significant data source in relation to stock market behaviour (Preis et al., 2013) and other economic indicators related to stakeholders such as customers and employees (Choi and Varian, 2012).
In this first attempt, the 15 firms belonging to the banking industry were selected. Masera and Mazzoni (2016) highlight how banks are particularly sensitive to market regulation; furthermore, Bonsón-Ponte et al. (2006) analysed how banks are also key actors in digital transparency. In total, 15 firms, 30 time series (dated each week from 2004 to 2015, totalling 617 observations per firm) and 11 potential breakpoints related to CDP reporting (three related to the publication of questionnaires, with the remaining eight including the publication of each firm’s CDP scoring) were involved in the study. This sample is also useful as it could be easily used in upcoming longitudinal studies and cross-industry comparisons.
5. Results and discussion
A first approximation of the estimated auxiliary models suggests a very satisfactory level of fit to data for all firms and sub-periods. R2 was higher than 90% in almost all cases in the general models that considered the whole timeframe (Table 1).
Average R2 of estimated ARFIMA model per firm for the whole time period
| Average | Max | Min | SD |
|---|---|---|---|
| 0.9440 | 0.9944 | 0.7257 | 0.0661 |
Descriptive statistics are reported in Table 2. All estimations for the d parameter were found to be significant at the 95% level. As a first outcome, it is relevant to note that the d parameter of the ARFIMA models ranges from 0.068728 (14 September, 2015) to 1 (all CDP reporting dates), when considering both stock prices and Google search trends. Although such results indicate a mix of persistent and random changes, the average value of d is always between 0 and 0.5, thus indicating room for the possible and general predictability of the observations. This also appears to be confirmed by the presence of significant breakpoints, for which the publication of CDP reports by some companies would influence both stockholder and stakeholder behaviours.
Descriptive statistics of d parameter (stock prices and search trends)
| d parameter | |||||
|---|---|---|---|---|---|
| Stock prices and search trends | Average | Max | Min | SD | % of firms for which breakpoint is significant |
| 19 May 2004 | 0.49392 | 1 | 0.10417 | 0.18225 | 23 |
| 14 September 2005 | 0.44578 | 1 | 0.06872 | 0.15571 | 23 |
| 18 September 2006 | 0.47121 | 1 | 0.10448 | 0.12587 | 27 |
| 25 September 2007 | 0.46143 | 1 | 0.10986 | 0.12631 | 10 |
| 22 September 2008 | 0.47430 | 1 | 0.28052 | 0.11060 | 27 |
| 21 September 2009 | 0.43793 | 1 | 0.11966 | 0.13899 | 10 |
| 20 September 2010 | 0.45600 | 1 | 0.25088 | 0.12350 | 3 |
| 14 September 2011 | 0.45771 | 1 | 0.21639 | 0.12739 | 10 |
| 12 September 2012 | 0.45203 | 1 | 0.10607 | 0.17839 | 23 |
| 12 September 2013 | 0.45602 | 1 | 0.06908 | 0.18306 | 23 |
| 15 October 2014 | 0.43234 | 1 | 0.11148 | 0.14640 | 20 |
An additional result arises when stock prices and search trends are considered separately (Table 3). Concerning the stock prices, it is worth noting that both the maximum and the average value of the d parameters fall within the 0 <d < 0.5 range (except for the first reporting date – 19 May, 2004); this means that the stock market behaviour is persistent and presents long memory during the analysed horizon. Additionally, the presence of a significant breakpoint suggests that market prices react, to some extent, to the publication of CDP reports by the firms. Similar observations can be made for search trends, although the maximum value of the d parameter (=1) and a restricted number of significant breakpoints denotes a weaker persistence of the online reputation.
Descriptive statistics of d parameter (stock prices and search trends, individually)
| d parameter | |||||
|---|---|---|---|---|---|
| Stock prices | Average | Max | Min | SD | % of firms for which breakpoint is significant |
| 19 May 2004 | 0.51505 | 1 | 0.44659 | 0.13458 | 27 |
| 14 September 2005 | 0.46066 | 0.06872 | 0.49286 | 0.10852 | 33 |
| 18 September 2006 | 0.48390 | 0.49154 | 0.46280 | 0.00969 | 40 |
| 25 September 2007 | 0.46723 | 0.49356 | 0.39638 | 0.02660 | 13 |
| 22 September 2008 | 0.48106 | 0.49654 | 0.46507 | 0.00708 | 33 |
| 21 September 2009 | 0.43497 | 0.49033 | 0.11966 | 0.09786 | 13 |
| 20 September 2010 | 0.47650 | 0.48842 | 0.44955 | 0.01013 | 0 |
| 14 September 2011 | 0.48133 | 0.49061 | 0.46917 | 0.00571 | 13 |
| 12 September 2012 | 0.45903 | 0.49132 | 0.31917 | 0.04405 | 47 |
| 12 September 2013 | 0.48024 | 0.49130 | 0.46431 | 0.00812 | 33 |
| 15 October 2014 | 0.48022 | 0.49139 | 0.45070 | 0.01129 | 27 |
| Search trends | |||||
| 19 May 2004 | 0.46953 | 1 | 0.10417 | 0.22892 | 20 |
| 14 September 2005 | 0.43091 | 1 | 0.11115 | 0.19486 | 13 |
| 18 September 2006 | 0.45851 | 1 | 0.10448 | 0.17994 | 13 |
| 25 September 2007 | 0.45563 | 1 | 0.10986 | 0.17964 | 7 |
| 22 September 2008 | 0.46754 | 1 | 0.28052 | 0.15872 | 20 |
| 21 September 2009 | 0.44110 | 1 | 0.22614 | 0.17685 | 7 |
| 20 September 2010 | 0.43404 | 1 | 0.25088 | 0.17816 | 7 |
| 14 September 2011 | 0.43409 | 1 | 0.21639 | 0.17997 | 7 |
| 12 September 2012 | 0.44503 | 1 | 0.10607 | 0.25273 | 0 |
| 12 September 2013 | 0.43179 | 1 | 0.06908 | 0.26095 | 13 |
| 15 October 2014 | 0.38445 | 1 | 0.11148 | 0.19839 | 13 |
To interpret these preliminary results, this research should try to unveil the mechanism behind this connection between environmental reporting and financial behaviour. It is rational that when firms make public their environmental impact, it is well perceived by investors with a deep consciousness on the matter. If the detail of reporting reveals improvements in the behaviour of the corporation, the investor could increase their participation. On the other hand, news about the environmental footprint of the firm can raise other interests in the general public, which could motivate additional visits by means of search engines. After subsequent exposures to this reporting, the impact in both data sets decreases for a relevant part of the studied corporations. Repetitive reports or stable indicators (i.e. greenhouse emissions remaining stable) could lead to a decrease in interest and subsequent impact. Once the participation stage is achieved using CDP platforms, the institutional pressures likely suffer a certain decline until new incentives for enhancing the behaviour (the actual content of the reports) arise, like those related to the specific situation of the firm and its group, as suggested by Delmas and Toffel (2004). Finally, improvements in both the reporting model (the CDP is constantly updating its set of key performance indicators), alongside substantial improvements in the data, can restore previous attention.
In light of these results, it can be summarised that:
the application of a nonlinear statistical methodology (i.e. the ARFIMA model) shows the presence of the long memory of data collection, thus a certain degree of predictability in the time series; and
this study confirms the existence of a number of structural breakpoints, specifically the impact of the CDP reporting both the stock prices and the online search trends of the sampled European banks for certain periods, specifically between 2005 and 2008 and from 2012 onwards.
The results on long memory are consistent with Panas (2001), for which his estimates of the fractional differencing parameter d suggest the presence of long memory in Athens stock returns. Additionally, such results align to Flores-Muñoz et al.’s (2019b) findings on the long memory detected for online search trends of travel and leisure companies, thus confirming the coherence of such measure to capture the behaviour of stakeholders. Concerning the results on structural breakpoints, some divergences with previous studies should be noted. On the one hand, it seems that the CDP disclosure confirms the positive market reactions to environmental and social disclosure (Griffin and Sun, 2013; de Villiers and Marques, 2016; Martínez‐Ferrero et al., 2016), even when such relationship is mediated by the social reputation of companies (Mohamed and Faouzi, 2014). On the other hand, our findings are in contrast with the detected evidences on the absence or weak support for such relationship (Carnevale et al., 2012; Plumlee et al., 2015). A major inconsistency concerns the findings provided by Clarkson et al. (2015) and Griffin et al. (2017), for which the CDP seems make no difference to the investor reactions towards the greenhouse gas emissions. A possible explanation of such disalignement is due to their use of the CDP’s carbon disclosure leadership index as a proxy of environmental disclosure measure. Such index accounts the comprehensiveness and quality of a company’s response to the annual CDP questionnaire, whereas our study considers the CDP reporting release (i.e. the publication of questionnaires and firm’s CDP scoring) to identify potential breakpoints in the time series analysed. However, it is important to note that even considering the nature of nonfinancial reporting, our results suggest that investors are more sensitive to this corporate communication than the public in general, likely because of the nature of the CDP, which is an initiative highly promoted by financial investors.
6. Conclusions, limitations and further research
The aim of this work was to explore how both stock prices and “online popularity” can register the impact of environmental reports being made public under the premise of a key global actor, the CDP. Such impact has been analysed in light of a time series technique that combines the classic view of Box-Jenkins with the groundbreaking and, even today, widely ignored perspectives of Hurst, Lorenz and Mandelbrot. When comparing firms, heterogeneous behaviour was observed in the current sample when analysing this environmental reporting and its corresponding effects. Additionally, when comparing the impact of a given report from a firm and its corresponding fingerprint in the financial or nonfinancial time series, the results are different, demonstrating a clearer impact in the financial one. Not all reporting dates were reported as statistically significant, which leads to further research questions on the specific content of the reporting as a key driver to account for effects; it is likely not only by reporting but also by means of the integration of environmental reporting data into business practices, as proposed by Figge et al. (2002), to gain sustained the interest of both shareholders and stakeholders.
This paper provides several implications for research, practice and society.
Concerning the research implications, this study introduces new methodological perspectives in corporate reporting studies. First, while traditional accounting studies are commonly addressed by linear statistical models, the application of nonlinear techniques can be more effective in capturing corporate transparency issues. This will help to better understand the behaviour of firms regarding both financial/non-financial and mandatory/voluntary disclosure. Second, this study supports the FMH, as formalised by Peters (1994), for which information has a different impact on different investment horizons. The results reveal that CDP reporting does indeed influence time horizons and heterogeneity among investors through the presence of significant breakpoints. Third, another implication concerns online presence and reputation: this can be considered as a new construct to be researched in the digital era, taking into account previous research on online transparency, social media presence and digital reporting. Interesting applications could be the use of digital solutions, like XBRL, for environmental reporting (Flores-Muñoz et al., 2018) and the use of the online metric in explaining the impact of institutional factors on non-financial reporting in developing countries (Dagilienė and Nedzinskienė, 2018).
Practice can also benefit from this study. On the one hand, the results of this study should empower firms to increase their awareness of disclosure impacts to stakeholders. The “breakpoint” concept should enlighten the importance of providing more information in specific moments, which can impact on both traditional (i.e. stock prices) and modern (i.e. online popularity) performance metrics. On the other hand, stakeholders will also be aware of the relevance of periodical reporting and disclosure; the “breakpoint” concept should be taken into account when analysing the accountability of firms to improve their decision-making processes. Therefore, our findings provide useful insights to investors and stakeholders to make better forecasts, especially in the evolution of European post-crisis financial markets. Further implications concern policymakers and companies in conjunction. First, in line with Middleton (2015), our study resonates with the mandatory inclusion of environmental information in financial statements required by the European Union. As our findings confirm that the inclusion of carbon disclosure might help investors to evaluate firms’ future value and prospects, we suggest that public authorities could promote the adoption of the CDP framework. However, this raises the question of how to integrate the CDP measures within the GRI framework, which represents the most used framework by companies to comply to the Directive 2014/95 (Sierra-Garcia et al., 2018; Raucci and Tarquinio, 2020). Second, a similar challenge for companies is the disclosure of environmental information related to their business models. Extant literature highlight the relevance of business models disclosure and related sustainability issues in increasing the competitiveness of firms (Di Tullio et al., 2018a, 2018b). Hence, we advocate that companies may rely on CDP information to better disclose their sustainable business models, to comply with the European requirements and build a sustainable competitive advantage. Third, regulatory authorities can benefit from our findings for monitoring and contrasting speculative and insider trading activities. Policy responses to such activities are of great relevance in banking sector, characterised by high supervision to guarantee market stability. On the one hand, we rely on Mynhardt et al.’s (2014) suggestion to regulators for improving market infrastructure by means of internet-trading development. On the other hand, appropriate supervising mechanisms and procedures of trading in financial markets should be applied both immediately before and after certain breakpoints (i.e. the CDP disclosure), to limit opportunistic behaviours of speculators and insider traders.
Finally, the implications for society primarily involve institutions and standard setters. The CDP runs a global disclosure system that enables companies, cities, states and regions to measure and manage their environmental impact. This study suggests that the adoption of such a disclosure model impacts not only investor behaviours – i.e. the classic “market reaction” – but also the online popularity of firms. Hence, online search trends represent a new public attitude to how society “measures” the effectiveness of firms’ disclosure behaviours. The same implication can be extended to other institutional contexts and societal actors, i.e. integrated reporting, affecting the providers of financial capital and “all stakeholders interested in an organisation’s ability to create value over time, including employees, customers, suppliers, business partners, local communities, legislators, regulators and policy-makers” (IIRC, 2013 p. 7); the GRI, involving a wide range of stakeholders, including “employees and other workers, shareholders, suppliers, vulnerable groups, local communities and NGOs or other civil society organisations, etc” (GRI, 2018, p. 8); and AccountAbility, considering stakeholders as “those individuals, groups of individuals or organisations that affect and/or could be affected by an organisation’s activities, products or services and associated performance” (AccountAbility, 2008 p. 10).
Because of its nature as a preliminary research exploration, this work presents some limitations that could inspire a deep development in future research. One of them, which is directly suggested by this study’s results, is to explore whether the impact of reporting is different due to the specific reporting behaviour each company adopts, in line with Fernandez-Feijoo et al. (2014). Another important challenge will be to overcome the proxies used in this paper for measuring impact, going beyond stock closing prices and Google Trends to a more ambitious set of time series. The selection of a proper proxy for the effect of reporting will be particularly difficult for stakeholders such as the auditing profession, for whom Fisher (2015) detects an expectation gap when compared to other stakeholders. Another relevant interest group that presents the same methodological issue (the lack of an obvious representative time series) are the analysts, who are increasingly interested in voluntary reporting (Ioannou and Serafeim, 2015). In line with Lai et al. (2010), it will be important to check the means by which a report is made public (i.e. the internet vs other alternative means) to investigate the differences between the impact or the time lapse required to register such an impact. Finally, as noted by studies who used classic event methodology, this data set must be used in a way in which the price and online behaviour of a given firm is affected not only by current events but also by the behaviour of its market peers, as in Clarkson et al. (2015).
Even taking into account the fact that reliable tests related to nonlinear dynamics and chaos are still “beyond the state of the art” (Barnett and Serletis, 2000), when trying to investigate, which underlying systems produce nonlinear or chaotic behaviour, it is also true that linear models do not have strong theoretical support in many fields, nor empirical evidence. Further research will enlighten to what extent it is possible to define optimal features regarding nonlinearity and chaos for time series when representing stock market prices. Chaotic processes are deterministic, while the estimation of d in the ARFIMA process is a stochastic procedure, which makes the link between them a topic under discussion. The different procedures of estimating d could produce divergences in the obtained values and the corresponding significance levels. On the other hand, these research contributions, if confirmed, will hopefully motivate corporate managers to increase the visibility and perceived reliability of their companies by means of better reporting practices, to increase their market valuation and to raise more funds from investors, as the natural complement to their current disclosure policy.
This research did not receive any specific grant from funding agencies in the public, commercial or not-for-profit sectors.
References
Appendix 1
Previous empirical studies on market reactions to environmental and carbon disclosure
| Authors | Underling framework | Methods and measurement | Units of analysis and coverage | Markets/indexes/currencies | Countries |
|---|---|---|---|---|---|
| Carnevale et al. (2012) | Value relevance | Value relevance analysis | Social reports [2002-2008] | Banking | Europe |
| Sullivan and Gouldson (2012) | Case study | Corporate responsibility reports, the supplementary corporate responsibility and climate change-related information provided on company websites and on responses to the CDP [2010] | Retail | UK | |
| Griffin and Sun (2013) | Voluntary disclosure theory | Four-factor model | CSR “greenhouse gas emission” releases in www.csrwire.com [2000-2010] | Energy, materials, industrials, consumer discretionary, consumer staples, health care, financials, information technology, telecommunication, utilities | USA |
| Matsumura et al. (2014) | Value relevance Voluntary disclosure theory Economic theory | Ohlson valuation model | Firms’ responses to CDP questionnaire [2006-2008] | Classified as subject to the Environmental Protection Agency’s greenhouse gas mandatory reporting rule or not | USA |
| Mohamed and Faouzi (2014) | Financial theory Legitimacy theory Behavioural theory | Econometric approach | Corporate social disclosure, market value and social reputation [1997-2008] | n.a. | USA |
| Clarkson et al. (2015) | Economic theory | Ohlson valuation model (modified) Carbon disclosure leadership index | Installations in the EU ETS [2006-2009] | Oil and gas, basic metals, industrials, consumer goods, health care, consumer services, utilities, financials, technology | Europe |
| Plumlee et al. (2015) | Traditional economic theory | Disclosure index | Stand-alone or annual reports [2000-2005] | Oil and gas, chemical, food/beverage, pharmaceutical and electric utilities | USA |
| de Villiers and Marques (2016) | Legitimacy theory Agency theory | CSR disclosure measure | CSR reports (if available, otherwise annual reports) [2007-2010] | Non-financial companies | Europe |
| Martínez‐Ferrero et al. (2016) | Information asymmetry theory Institutional theory | Triangulation of discourse analysis and indices that measure the standardisation of disclosure of CSR information in relation to GRI guidelines | CSR reports [2003-2009] | Non-financial | USA, UK, Europe |
| Omar and Zallom (2016) | Social impact theory Supply and demand theory Liberal theory Cost-benefit theory | Multiple regression analysis model CSR index | Annual reports [2006-2010] | Chemical, food and beverage, pharmaceutical and medical | Jordan |
| Griffin et al. (2017) | Voluntary disclosure theory | Ohlson valuation model (extended) Event study | annual S&P 500 reports published by the CDP [2006-2012] 8‐K filings [2005-2010] | Utilities, consumer discretionary, consumer staples, energy, financials, health care, industrials, information technology, materials, telecommunications | USA |
Examples of previous fractal market analysis
| Authors | Underling framework | Methods and measurement | Units of analysis and coverage | Markets/indexes/currencies |
|---|---|---|---|---|
| Peters (1994) | Chaos theory FMH | Hurst exponent R/S analysis ARFIMA model | Several [1988-1990] | Several |
| Panas (2001) | Fractal dimension | Hurst exponent ARFIMA model | Daily stock prices [1993-1998] | Athens stock exchange |
| Mynhardt et al. (2014) | FMH | Dynamic hurst exponent R/S analysis | Daily stock index and exchange rate fluctuations [1990-2010] | National stock markets Foreign exchange markets |
| Ikeda (2017) | Fractal geometry FMH | Hurst exponent | Weekly stock prices [Not specified] | World stock markets |
| Flores-Muñoz et al. (2019b) | Chaos theory Fractal geometry | ARFIMA model | Weekly stock prices and online search results [2012-2017] | STOXX® Global 3,000 travel and leisure |
| Ftiti et al. (2019) | Multifractal approach | Detrending moving average cross-correlation analysis Multifractal detrending moving average cross-correlation analysis | Intraday trading volume and prices (futures contracts) [2007-2010] | New York mercantile exchange (Oil and gas) |
| Arbi Madani and Ftiti (2020) | Multifractal approach | q-detrending moving average cross-correlation analysis Mixed-correlated ARFIMA | Intraday gold and oil prices and exchange rates [2017-2019] | EUR, GBP, CHF JPY, CAD, AUD |
Appendix 2. ARFIMA modelling
Given a time series yt, the autoregressive moving average (ARMA) estimation model can be applied through the following equations:
AR(p)
MA(q)
ARMA(p,q)
Hence, the ARMA model involves the variable regression (AR, order p) on its own lagged values and the moving average (MA, order q) of error terms occurring at various times in the past. Parameters p and q can be estimated by the Box–Jenkins method (Box and Jenkins, 1976) to search the best fit of a time series model to past values of a time series. Substituting yt by (Granger and Joyeux (1980) for technical details) leads to the ARFIMA estimation, as in the following expression:
ARFIMA(p,d,q)
or
where: yt denotes a given time series;B denotes the “one step back” operator; (1-B)d allows for the fractional differencing of yt in pursuit of stationarity; ρi and θj denote, respectively, p and q as the corresponding AR(p) and MA(q) estimations; andεt denotes the usual random residual.
The main difference between ARMA and ARFIMA is the d parameter, which can be a decimal (fractional or fractal) number. If a fractional d is found, then there are connections to the Mandelbrot dimension of the time series, which is an evidence of chaos:
where H is the Hurst exponent and D = 3/2 – d. Depending on values of d and then H, if the time series exhibits chaos, we can give an opinion on: its degree of predictability in general; to which extent or until to which, the time frame the series is predictable; the possibility to find self-similarity.
Methodological steps
We firstly used EViews9 to apply the ARFIMA model to our time series, consisting of stock prices and Google trend searches for the sampled companies. The aim was to estimate the d parameter and the corresponding parameters . Additionally, it was necessary to determine the goodness of fit of such a model (Table 1).
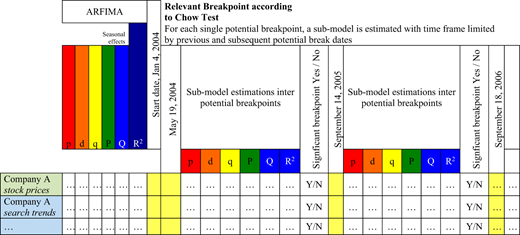
Subsequently, we checked for the existence of any substantial break in the parameters along the sample, in particular regarding the d parameter. To do so, we performed a series of traditional ordinary least squares model regressions to detect significant breakpoints around the CDP disclosure dates from 2004 to 2015 (Tables 2 and 3). Below an excerpt of our data collection matrix.

