B. Ladanyi. École Polytechnique, Montréal, Canada
In their interesting and well-documented paper, when discussing the effects of strain rate on the results of cone tests, the authors state correctly that in undrained cone penetration in clay the measured cone resistance is affected by the penetration rate, because of the well-known experimental fact that the undrained strength of a saturated clay in triaxial compression tends to increase with increasing strain rate by about 10% for each log cycle increase in strain rate.
However, when transposing this effect from triaxial compression to cone penetration, the authors state that the strain rate is approximately 800 000% per hour near the cone face, for a 10 cm2 cone penetrating at a rate of 20 mm/s. This conclusion is based on their definition of the cavity shear strain, , which follows a development, often found in the geotechnical literature (e.g. Collins & Yu, 1996), that combines a large strain theory with a small strain assumption close to the cavity. This theory leads to a conclusion that at the cavity wall the shear strain is infinite, when the cavity is expanded from zero radius (Collins & Yu, 1996).
Ladanyi & Foriero (1998) have shown that, when the large strain assumption is followed throughout the development, it leads to the conclusion that the shear strain at the expanding cavity wall cannot exceed a value of π/2, or about 157%. This alternative result casts some doubt on the authors' conclusion that ‘the su value interpreted directly from the corrected cone resistance will be 59% higher than the reference su.’
In addition to this problem, a more general question arises on how to define ‘the true reference strain rate’ in a penetration test to be used for comparison with the results of conventional triaxial compression tests. This discusser was concerned with this question for quite a while, especially in connection with the interpretation of cone penetration tests in frozen soils, which are much more rate sensitive than unfrozen undrained clays. After some trials, the discusser came to the conclusion that a logical solution to this problem may be based on the following reasoning (Ladanyi, 1982).
The laboratory-determined triaxial compression strength of soils is usually expressed as a function of strain rate, corresponding either to that at the peak of stress–strain curves in strain-rate-controlled tests, or to the minimum creep rate in stress-controlled creep tests. Since in a cone penetration test the strain rate at failure occurs at a distance where the strain just attains its failure value – that is, at the elastic–plastic boundary – the strain rate at that distance is considered to be governing. For a cone penetration, assimilated to the expansion of a spherical cavity, the reasoning leads to the conclusion that the equivalent strain rate, , in triaxial compression is related to the penetration rate, ⋅, by the following expression, developed in Ladanyi (1982):
where ε1 f is the failure strain in a triaxial compression test, and B is the cone diameter.
If this reasoning is applied to the data published in Fig. 9 in the authors' companion paper (Cao et al., 2001), where rp/au at the elastic–plastic boundary varies from 3 (at R = 10) to 8 (at R = 1·1) (corresponding to ε1 f values between 2·47% and 0·13%), equation (24) would give the equivalent strain rate varying from 0·0826 s−1 (at R = 10) to 0·00436 s−1 (at R = 1·1). If one compares these rates with 1% per hour (= 2·8 × 10−6 s−1), quoted by the authors as a regular strain rate in triaxial compression tests, one gets from their equation (3) su/s*u ratios varying from 12% (for R = 1·1) to 15% (for R = 10), which is much less than the 59% quoted by the authors.
Clearly, there are several other reasons for the discrepancy between compression strengths determined by CPT and those determined by triaxial compression, but the strain rate is not a very significant one. In the opinion of the discusser, a more important reason for CPT-determined strengths being higher than those found in triaxial tests is differences in boundary conditions, leading to premature failure in the latter.
Authors' reply
The authors would like to thank the discusser for this opportunity to elaborate on the development of strain and strain rate around the cavity. The definition of the strain at the cavity wall in the authors' paper is based solely on the large strain theory rather than on a combination of the large strain and the small strain assumptions.
The increments of radial strain and circumferential strain around an expanding cavity can be expressed in terms of the radial displacement, ud, and the radial distance r from the centre of the cavity with an initial radius equal to ro as
Integrating equations (25) and (26) from ro to r, the radial strain and circumferential strain in the large strain condition are
Note that equations (27) and (28) are respectively the same as equations (26) and (27) in the companion paper (Cao et al., 2001). This definition results in infinite shear strain when the radial strain is infinite or when the cavity is expanded from zero radius.
Ladanyi & Foriero (1998) reported that that the shear strain at the expanding cavity cannot exceed a value of π/2. This conclusion is believed to be applicable only to compression or extension of a long cylinder and thus is not applicable to the cavity expansion problem.
By differentiating equation (29) in Cao et al. (2001), the radial strain rate around a cavity, defined as positive for compression, can be expressed as
where m = 1 for a cylindrical cavity and 2 for a spherical cavity. Equation (29) indicates that the radial strain rate decreases as the radial distance, r, increases. Hence the radial strain rate at the cavity wall is much larger than that at the elastic–plastic boundary. Consequently, the undrained shear strength at the cavity wall will be larger than that at the elastic–plastic boundary.
The authors agree with the discusser that there is no simple way of incorporating the strain rate effect on the cavity expansion pressure. Using the strain rate at the cavity wall will overestimate the cavity expansion pressure, and using the strain rate at the elastic–plastic boundary will underestimate the cavity expansion pressure. The authors have chosen to equate the strain rate at the cavity wall to the rate of penetration of a standard cone as they both represent the conditions that dictate the soil displacement at the boundaries.
The rate of axial strain rather than the rate of shear strain is often referred to as the strain rate in the triaxial compression test. The relationship between the penetration rate and the shear strain rate in the triaxial test that is suggested by the discusser cannot be used to analyse the effect of strain rate in the piezocone test. A comparison of the penetration rate with the axial strain rate in the triaxial test is more appropriate considering the similarity between the imposed strains at the boundaries, on the one hand, and between the directions of radial strain in cavity expansion and axial strain in the triaxial test, on the other.
The authors fully agree with the discusser that other factors such as the cone shape and the boundary conditions may have important effects on the measured cone resistance. Unfortunately these factors are not amenable to theoretical treatment in the framework of cavity expansion. Strain rate effect was incorporated in the proposed interpretation method because it was recognised that it could have a significant effect on the interpreted undrained shear strength.
P. W. Mayne, Georgia Institute of Technology, USA, B. S.-Y. Chen, HartCrowser, Seattle, USA, S. E. Burns, University of Virginia, USA
The writers appreciate the renewed interest in our original piezocone model, which is in essence based on the same principles and theoretical components as those of the authors. Unfortunately, the authors have not acknowledged our subsequent developments over the past decade, many of which have already addressed the issues raised in this recent paper.
Prior works successfully related the cone tip stress to undrained strength using the Vesic spherical cavity expansion (e.g. Keaveny & Mitchell, 1986). Our early piezocone model utilised cavity expansion and critical-state soil mechanics to express measured excess penetration pore water pressures in terms of overconsolidation ratio; spherical versus cylindrical expansion was also investigated (Mayne & Bachus, 1988). To our knowledge, we were the first to combine the derived expression for tip resistance with the formulation for pore pressure to remove the reliance on rigidity index (Mayne, 1991). The result was that the OCR relates to the normalised effective cone resistance (qt − um)/σ′vo. Interestingly, this parameter was shown to be appropriate from an independent dimensional analysis by Houlsby (1988), as well as from the effective cone model proposed by Konrad & Law (1987b). For piezocones with midface filter elements (designated u1 or ut), the original expression cited (authors' equation (15)) did not include the effects of interface shear, and was modified empirically to give (Mayne, 1992)
The authors' Fig. 14 therefore shows underpredictions for our model that in fact do not occur. Of course, with type 1 penetrometers a correction from qc to qt is not truly possible nor reliable unless the shoulder reading (designated u2 or ubt) is also monitored.
The expression for piezocones with shoulder filter elements (designated u2 or ubt) originally accounted for shear-induced contributions in the same manner as (7), thus giving (Mayne, 1993):
Extensive calibration was carried out using data from over 200 clay sites from the writers' files, outside sources, and research institutions (Brown & Mayne, 1993; Chen & Mayne, 1994). As the pore water pressures recorded at the u1 and u2 positions have quite different magnitudes (Campanella & Robertson, 1988; Powell et al., 1988; Larsson & Mulabdic, 1991), the authors are quite incorrect in suggesting the use of both equation (14) and equation (17), as this implies u1 = u2. Clearly, this is at odds with observed behaviour since u1 > u2 (e.g. Rad & Lunne, 1988; Lunne et al., 1997).
It is difficult to develop a reliable formulation for OCR–CPTu1 formulation because of the following aspects:
the aforementioned correction for tip stress
the closeness of qt and u1 in magnitude
the compressibility of the filter element (Campanella & Robertson, 1988)
the non-uniqueness of the u1 position on commercial penetrometers (Powell et al., 1988).
Regarding point (d), small changes in mid-face position result in different readings. As an approximation, Chen & Mayne (1994) suggested an average stress path for the elastic stress path component (Vesic, 1977), giving
where Δu2 is given identical to the authors' equation (7). Thus another way to explore the appropriateness of these models is to use the measured face and shoulder pore water pressures to evaluate the degree of overconsolidation (e.g. Sully et al., 1988). Rearranging equation (32) gives
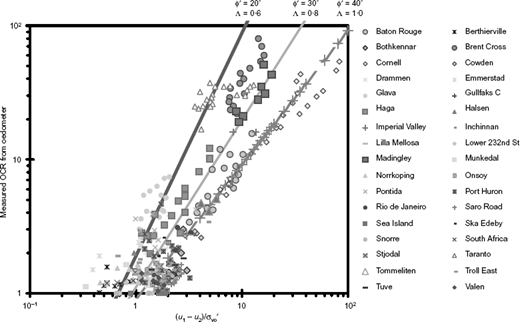
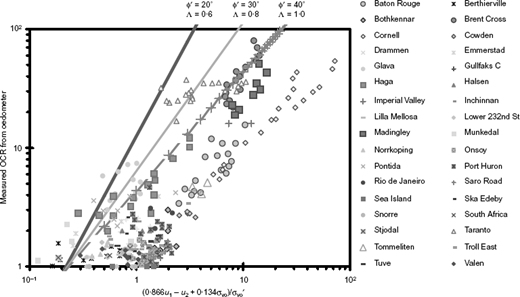
Data from clay sites that were tested with both type 1 and 2 piezocones are shown in Fig. 26; they indicate reasonable groupings within the expected ranges of M and Λ. A similar approach using the authors' equations (9) and (12) can be combined to give
Using the same ranges for M and Λ and a set value of αε = 1·64, Fig. 27 shows that the resulting expression does not provide a good match with the available data.
Prior to this paper, the writers had also addressed the interpretation of undrained shear strength (Chen & Mayne, 1993; Mayne & Chen, 1993), the variation of Bq with OCR (Mayne & Bachus, 1988; Mayne & Holtz, 1988), evaluation of the rigidity index (Chen & Mayne, 1994; Mayne, 2001), and forward predictions of corrected cone tip stress and pore water pressures with depth (Mayne & Schneider, 1999).
Alternative formulations were also explored based on considerations of strain rate (our parameter aR versus the authors' parameter αε), strength anisotropy (e.g. triaxial compression versus, simple shear and extension), initial stress state (K0), constitutive model, size of yield surface (via the effective cohesion intercept, c′), and the specific location of the midface element (Chen & Mayne, 1994, 1995). Of additional value (and not yet addressed by the authors), our group has deconvoluted the SCE and CSSM pore water components to show why piezocone dissipations show monotonic decay behaviour in soft clays but dilatory responses (an increase and then a decrease with time) in stiff, overconsolidated materials (Burns & Mayne,1995, 1998, 1999).
Authors' reply
The authors appreciate the interest of the discussers in sharing their views from extensive research on the interpretation of the piezocone test (CPTU) in clay. The authors are fully aware of the discussers' work, and have made appropriate reference in the present paper.
The authors' proposed equations in the paper under discussion may appear to resemble those reported by the discussers (e.g. Mayne, 1991); however, these equations are based directly on a rigorous closed-form analysis of the undrained cavity expansion in modified Cam clay (MCC). The analysis follows the stress path of the material during the cavity expansion (Cao et al., 1996; Cao, 1997) as summarised in the companion paper (Cao et al., 2001). The discussers' work, on the other hand, is based on Vesic's solution of cavity expansion in an elastic-perfectly plastic material. The critical-state concept was used only as a means of relating the undrained shear strength (su) to the critical state parameter M and the OCR (overconsolidation ratio) of the clay. Although the discussers claim that the basis of the present development is essentially the same as their ‘original’ piezocone model, it is clear that there is a distinct difference between the two approaches.
The discussers have questioned the authors' use of equation (15) proposed by Mayne (1991), rather than the updated equation (24) that appeared in Mayne (1992), for comparison with the simplified theoretical solutions. It is our intention to provide a direct comparison of our theoretically derived solutions with the discussers' approach. This is important as it helps to identify the impact of ignoring the actual stress path when combining Vesic's cavity expansion solution with su derived from the MCC model based on the triaxial compression condition (Mayne, 1991). As equation (24) is empirically derived, it does not provide a good basis for such comparison.
The discussers highlight their contribution of incorporating qt and ut or ubt in one equation, thus allowing the evaluation of OCR directly from CPTU results without the need to determine the rigidity index, Ir. The approach is innovative, and has been acknowledged elsewhere by the first author (Chang, 1992). In fact, the theoretical derivation in the authors' companion paper (Cao et al., 2001) provides a clear explanation of the resulting solution that supports such an approach. Furthermore, the discussers specifically point out that, with their stress path approach, the component of pore pressure change, Δu2 in equation (26), which takes account of the contribution due to shear (see Mayne, 1991), is identical to the second term in the authors' equation (7). It should be noted that, in the present development, the two pore pressure components in equation (7) are derived naturally based on the consideration of the changes in mean stresses.
It cannot be overemphasised that neither spherical cavity expansion (SCE) nor cylindrical cavity expansion (CCE) provides a rigorous basis for the interpretation of CPTU. The geometry of the cone and the penetration process is too complicated to be modelled by the simple kinematic condition that exists in cavity expansion. It was for this reason that other analysis methods, such as the strain path method (e.g. Baligh, 1985; Teh, 1987), have been proposed. When attempting to predict ut or ubt using cavity expansion, one must be conscious of such limitations. In our application of the original closed-form solution to the interpretation of the piezocone test in clay, certain approximations are made in recognition of such disparities and for other practical reasons as highlighted in the paper. While the penetration pore pressure on the cone face (ut) may be approximated by SCE, neither the solution of an SCE nor the solution of a CCE can provide an accurate prediction of the pore pressure just behind the cone face (ubt). This is partly because ubt in clay, especially when it is heavily overconsolidated, is dominated by shear behaviour (Wroth, 1984). The works by Baligh & Levadoux (1980) and Teh (1987) show clearly that pore pressure response just above the cone tip changes very rapidly. The difference between ut and ubt depends on the fundamental properties and the stress history of the clay, as well as on the stress path. It is believed that the pore pressure parameter Bq is a reasonable indicator of the influence of these factors. Available published data in Fig. 12 of the present paper show that, although CCE solutions encompass most Bq values, SCE provides a better upper bound to the Bq values for some special lean clays and highly sensitive clays generally with Bq greater than 0·75. For this reason, the authors have recommended that the pore pressure behind the cone be expressed in terms of the SCE solution, and have suggested two separate approximations for the interpretation of ubt on the basis of the value of Bq.
It is noted that a value of Bq greater than 0·75 is generally associated with normally to lightly overconsolidated clay or sensitive clay. For such clays the difference between ut and ubt is usually small. For example, based on local experience in Singapore, the difference for the soft Singapore marine clay is typically around 10 kPa, and less than 3 kPa in truly normally consolidated clay at recent reclaimed sites. The use of (ut − ubt) to predict OCR, as suggested by the discussers, may lead to significant error in this case.
The authors do not recommend the combination of equations (9) and (12) in the way suggested by the discussers, or the use of the resulting equation (28) for the determination of OCR. The authors would like to draw attention to their qualification of extending the theoretical solution of cavity expansion in MCC for highly overconsolidated clays. Modified Cam clay is known to be incapable of capturing softening behaviour associated with the shearing of heavily overconsolidated clay. This limitation necessarily means that any good prediction arising from the application is fortuitous. It was not our intention to encourage such applications, although some comparisons in the paper did show a certain degree of success of such an application. One should view with caution the usefulness of Fig. 27 as an adjudicator of the validity of the present development. We are glad to see that the discussers' semi-empirical correlation in equation (27) has shown good comparison with the large bulk of data collected by the discussers for clays with a very wide range of OCR values. We hope that the theoretical development and its application to CPTU described in our two papers (Cao et al., 2001; Chang et al., 2001) have provided some insights into why such correlations may work.
The authors fully appreciate that there are numerous factors that need to be considered in the interpretation of CPTU results; many of these have been identified and dealt with by the discussers. Unfortunately these factors are not always amenable to theoretical treatment in the framework of cavity expansion. With the incorporation of the strain rate effect and a sound theoretical framework, the proposed method of interpretation should enhance our capability of determining various key parameters from the CPTU. The present development should be of added value to those concerned with CPTU testing in clay, provided the limitations of the proposed methods are recognised.