The authors have used work published by Leps (1970), where the peak angle of shearing resistance is approximately a linear function of normal stress on a semi-log plot over a wide stress range. They have tried to extend that relation to very low stress and performed in situ direct shear box tests.
It is the discusser's opinion that the description of an important soil property such as the shear strength should be applicable to the complete stress range from zero to elevated pressures. In order to demonstrate that this is possible, the discusser has processed the data on shearing strength for all materials shown in Figs 7 and 8 using the general expression proposed by Maksimovic (1988, 1989a, 1989b, 1993, 1996).
The non-linear failure envelope in terms of effective stress for non-cemented soils, assuming zero cohesion, is described as
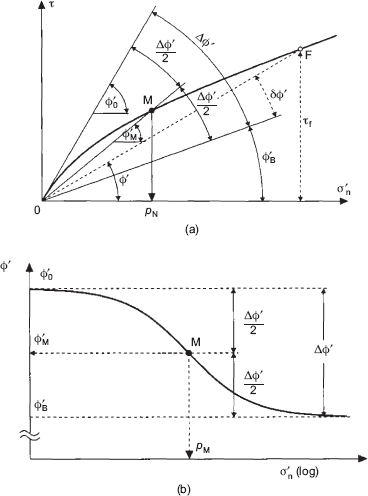
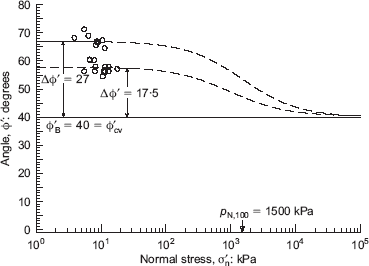
where ϕ′ is the secant angle of shearing resistance; ϕ′B is the basic angle of friction, and reflects friction close to the critical state; Δϕ′ is the maximum angle difference, and reflects density, angularity and associated dilatancy effects at zero stress level; σ′n is the effective normal stress on the failure plane; and pN is the median angle pressure, and reflects mainly the strength or the resistance of grains to crushing, which depends on the type of mineral, soil density, grading and roundness. The geometrical meaning of each parameter is shown in Fig. 13.
For comparison with the data introduced in the paper, it is necessary to select a value of ϕ′cv. The authors state that they performed drained shear strength tests and obtained an angle of shearing resistance at constant volume of approximately 46–48°. These values of ϕ′cv seem rather high.
It may be that at low normal stress the measured values of 46–48° are achievable in well-graded sand-gravel mixes with angular grains. However, at high stress levels, owing to particle breakage, materials composed of angular particles have no constant critical state angle, as this depends on confining pressure and initial packing.
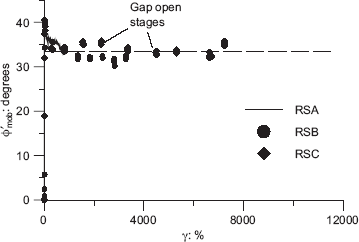
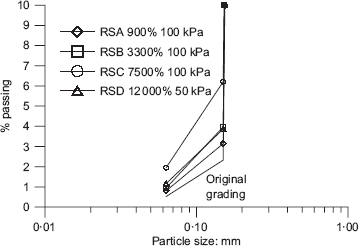
Luzzani & Coop (2002) found that, even at low stress levels, quartz sand was subjected to small amounts of particle breakage (Fig. 14). It may be concluded that particle breakage continues to very large strains (7500%), far beyond those reached in the direct shear tests reported in the paper (16–25%). Coop et al. (2004) concluded that at very large strains a constant grading should be reached, but that constant grading is dependent not only on the normal stress applied but also on the uniformity and absolute particle size of the initial grading (Fig. 15).
Norris (1977) reported that for a sand of quartz grains at moderate stresses (p′ = 100 kPa), ϕ′cv increases with particle angularity from 29° when rounded to 40° when angular, the latter value reducing at higher stresses. This was consistent with previous findings that ϕ′cv for sands containing feldspar minerals was of the order of 40° (Rowe, 1962).
Also it is known that ϕ′cv is greater
in plane strain than in triaxial compression
at smaller confining pressure
in looser packings
when compressed perpendicularly to the bedding.
On the basis of the above the discusser will adopt ϕ′B ≅ ϕ′cv of 40°.
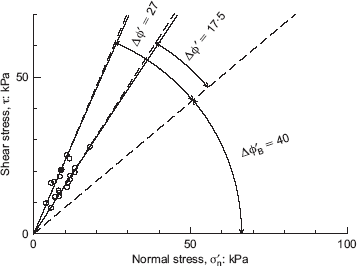
The shear strength envelope and the variation of ϕ′ with stress level in the semilog plot are shown as Figs 16 and 17. The curves fit the data with remarkable accuracy.
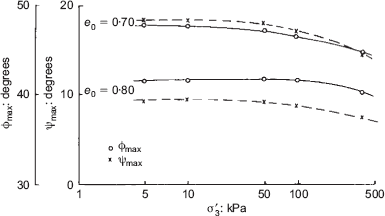
The authors have used the theory proposed by Bolton (1986) with the assumption that ϕ′max and ψmax are functions of the logarithm of stress. Tatsuoka (1987) demonstrated that in the low stress range, where ϕ′3 is less than about 50 kN/m2, both ϕ′max and ψmax are almost independent of stress level (Fig. 18). A similar finding can be seen in Fig. 17. Therefore it may be quite misleading, without reliable experimental results, to assume that both ϕ′max and ψmax change in proportion to –ln p′ in low stress ranges, where there is a technical difficulty in performing strength measurements relevant to slope stability problems.
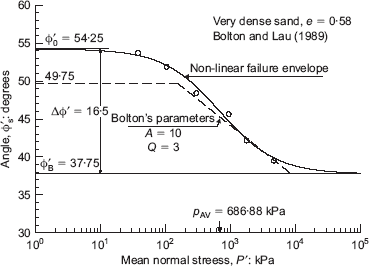
Jamiolkowski et al. (1988) show that Bolton's theory yields values of ϕ′max that are 1–1·5° lower than those resulting from triaxial tests on Ticino sand. Bellotti et al. (1989), validating the same theory for Hoksund quartz sand, found that ϕ′max is underpredicted by about 2–3°. Maksimovic (1993) demonstrated that the fit can be improved by adopting a value of Q for dense quartz sands in the range 9·8–11·2 and a value of A in the range 3·5–4·2° (Fig. 19).
In addition, Tatsuoka et al. (1986) performed a series of plane strain compression tests on air-pluviated samples of Toyoura sand and obtained a pronounced degree of aniso-tropy in both ϕ′max and ψmax; this was not considered by the authors.
Analytical description of the failure envelope in the form of equation (2) is suitable for implementation as a standard feature of slope stability software, and is applicable to the peak strength of clay, silt, sand, gravel, rockfill and rock discontinuities.
Authors' reply
In reporting the results of direct shear box tests on undisturbed (field) and reconstituted (laboratory) soil specimens in Fig. 10(a) of the paper, we observe that the angle of shearing resistance at peak or maximum capacity ϕ′max appears to exhibit a log-linear relation that diminishes with increasing vertical effective stress. The angle of shearing resistance mobilised at large displacement in the same tests is essentially constant; with reference to the simple empirical relation of Bolton (1986) (equation (1) of the paper), we note that the difference is close to the maximum angle of dilation ψmax in Fig. 16 of the paper.
The discusser makes reference to extensive data presented by Tatsuoka (1987). in a discussion of Bolton (1986), reproduced in Fig. 18, which shows little stress level dependence of ψmax at very low stress levels in Toyoura sand reconstituted to a constant void ratio. The authors note Been & Jefferies (1985) and Been et al. (1991) present findings that differ somewhat, from their work on the critical state of sands. More specifically, the discusser is concerned that ϕ′max and ψmax are both assumed to vary with stress, over the range of low stress examined in the direct shear box tests. We acknowledge the dilatancy component of strength to be governed by the initial density of the soil, and also by stress level. Given the former was not determined in a systematic manner in the shear box tests, it is not possible to comment upon the latter.
The discusser alludes to the finding of Tatsuoka (1987) that the proposed empirical relation of Bolton (1986) might be of more general use if it accounted for anisotropy in ϕ′max and ψmax. It leads him to observe that we did not consider the phenomenon. Anisotropy in mechanical properties is typically a result of anisotropic fabric, such as that arising from a preferred orientation of grains on an initial bedding plane. Current understanding of the phenomenon is primarily a result of fundamental studies conducted with sophisticated laboratory test equipment on reconstituted specimens of uniformly graded soils. As our study did not have this objective, and given a programme of field testing on undisturbed soils and laboratory testing of reconstituted soils from four different sites, we are presented with little meaningful opportunity to bring clarity to issues of strength anisotropy in sands and gravels. Accordingly, we did not consider it.
The discusser advances an alternate interpretation of the test results, predicated on an assumed value of ϕ′B ≅ ϕ′cv of 40°. We find the assumption rather speculative. His earlier recognition that higher values may be achievable in well-graded sand-gravel mixes with angular grains, like those examined in the programme of shear box testing, is more consistent with the findings of our study.