The behaviours of soil subjected to internal erosion have been widely investigated, yet the evolution of soil fabric anisotropy during erosion and the corresponding changes in post-erosion stiffness degradation curves have never been explored. This study developed a back-pressure-controlled, bender-equipped triaxial permeameter to measure the internal erosion behaviour of soils under different stress states and its consequences on the anisotropic mechanical behaviour of eroded soil. Evolutions of fabric anisotropy during erosion were evaluated by measuring the shear wave velocity at various wave propagation and polarisation directions under the isotropic loading condition. Soil samples with and without erosion were then sheared following a path of constant mean effective stress to determine the stiffness degradation curves. Results show that the losses of fines and the rearrangement of soil particles due to erosion increased the fabric anisotropy (i.e. increased horizontal alignments of soil particles) by 10% at all confining pressures. Such increase resulted in eroded specimens that were stronger than their intact counterparts upon triaxial compression, but the opposite trend was observed upon extension. The eroded specimens had a higher volumetric threshold shear strain than the intact ones, thereby suggesting that higher strains were required to substantially change the soil structure and reduce the small-strain shear stiffness.
NOTATION
- b
intermediate principal stress ratio
- Cc
coefficient of curvature
- Cu
coefficient of uniformity
- d50
mean particle size
- d15c
particle size at finer per cent of 15% in coarse fraction
- d85f
particle size at finer per cent of 85% in fine sand fraction
- e
void ratio
- F
finer per cent at particle diameter d
- G
shear modulus
- Gr
gap ratio
- Gs
specific gravity
- Gsec
secant shear modulus
maximum shear modulus in the ij plane
- H
finer present increment between d and 4d
- i
hydraulic gradient
- icr
critical hydraulic gradient
- Jqp, Jpq
moduli cross-coupling the shearing and volumetric effects
- K
bulk modulus
- ksat
saturated hydraulic conductivity
- MC, ME
gradient of critical state line
- P
initial fines content by mass
- p′
mean effective stress
- q
deviator stress
shear wave velocity
- wopt
optimum water content
- γd,max
maximum dry density
- γtv
volumetric-threshold shear strain
volumetric strain increment
deviatoric strain increment
bulk density
major, intermediate and minor principal effective stress
INTRODUCTION
Internal erosion is amongst the major causes of the instability of earthen infrastructure, such as levees, foundations and dams (Muir Wood, 2007; Xu & Zhang, 2009; Danka & Zhang, 2015). Internal erosion can be initiated by different mechanisms, including suffusion, concentrated leak erosion, backward erosion and soil contact erosion (Fell & Fry, 2007). In particular, suffusion is a process that involves the erosion of fines within the matrix of coarse particles upon seepage without significant change in volume (Kézdi, 1979; Fannin & Slangen, 2014). This process can directly affect the deformation and stability of water-retaining infrastructure when, for instance, subjected to rising water levels and/or heavy rainfall (Fell et al., 2003; Polemio & Lollino, 2011). Erosion can substantially change the mechanical behaviour of soil (e.g. Chang & Zhang, 2011; Xiao & Shwiyhat, 2012; Ke & Takahashi, 2014b; Chen et al., 2016; Mehdizadeh et al., 2017) due to the modification and/or redistribution of particle size and the soil microstructure or fabric. The occurrence of suffusion primarily depends on the geometric conditions of the soil (i.e. particle size distribution and inherent anisotropy; Kenney & Lau, 1985; Indraratna et al., 2011), hydraulic conditions (i.e. degree of saturation, hydraulic gradient and flow rate of the soil; Skempton & Brogan, 1994; Li et al., 2009) and mechanical conditions (i.e. stress states and stress paths; Reddi et al., 2000; Tomlinson & Vaid, 2000; Richards & Reddy, 2007). Characterising the complex soil–water hydromechanical interaction involved in suffusion, especially the substantial changes in the soil mechanical properties and any associated fabric evolution, with due consideration of these three conditions is therefore important in evaluating soil resistance against internal erosion.
Previous experimental studies have predominantly used flexible wall permeameters (Sanchez et al., 1983; Yang et al., 2019) to investigate the suffusion characteristics of internally unstable soils and the associated changes in their hydraulic conductivity after erosion. Some of these permeameters have been modified to independently control the soil stress states (Chang & Zhang, 2013; Luo et al., 2013) for studying the state dependency on erosion behaviour (Chang & Zhang, 2013; Luo et al., 2013; Deng et al., 2020; Chen et al., 2021) and the mechanical responses after erosion (Chang & Zhang, 2011; Xiao & Shwiyhat, 2012; Ke & Takahashi, 2014b; Chen et al., 2016; Mehdizadeh et al., 2017; Kuwano et al., 2021). Although the soil specimens tested in these permeameters were saturated by back-pressure prior to testing, in some studies, the back-pressure was not maintained during the subsequent testing phases of internal erosion and shearing, especially in head-controlled tests. One possible reason is that the downstream reservoir of this set-up is always open to the atmosphere, posing difficulties in applying a back-pressure while controlling the hydraulic heads. In this procedure, the full saturation state of the soil specimens was not maintained during testing, and the test results could be affected by matric suction, which has been recognised as an important stress state variable that governs the soil’s hydromechanical behaviour. The variation in matric suction during flushing is usually neither controlled nor measured, thereby posing challenges to interpreting the results of erosion tests. Although some limited studies (Ke & Takahashi, 2014b; Mehdizadeh et al., 2017; Kuwano et al., 2021) were able to apply a back-pressure during the erosion and post-erosion shearing stages, the upstream and downstream water heads were not maintained; the upstream water head could drop during flushing, while the water head at the downstream reservoir was maintained at the level equivalent to the particle collection reservoir, rather than at the bottom of the specimen. The lack of control of the water heads could directly affect the amount of fines loss and potentially the soil fabric. To address this problem, a permeameter should be capable of maintaining the back-pressure throughout the experiment in order to evaluate the stress states and microstructure or the fabric of the soil specimens being tested, thereby allowing for a more accurate understanding of the underlying mechanisms of internal erosion and post-erosion mechanical consequence.
Previous experimental campaigns have primarily focused on the change in the fines content of internally unstable soils subjected to suffusion and alteration in response to the shearing behaviour of soil after erosion. How the erosion process by seepage force may affect the fabric, maximum shear modulus (G0), small-strain stiffness and anisotropy of soils has never been explored. Determining the variations in shear stiffness with strain (also known as stiffness degradation curves) is crucial to assess the seismic performance of earth dams, levees and embankments subjected to earthquake loadings (Singh et al., 2005; Clayton, 2011; Chakraborty et al., 2019). To the best of the authors’ knowledge, no previous study has investigated the changes in fabric anisotropy triggered by erosion and their effects on the shear modulus under different stress paths. Previous experimental and numerical studies have either used particle dissolution (Truong et al., 2010; Chen et al., 2016; Yang & Kuwano, 2017; Favero & Laloui, 2018; McDougall et al., 2019; Chitravel et al., 2021; Kim et al., 2024) or changed the fines content (Choo & Burns, 2015; Goudarzy et al., 2016; Yang & Liu, 2016; Otsubo et al., 2022) instead of using soil flushing or erosion to investigate any changes in G0. The substantial increase or decrease in G0 primarily depends on the applied stress paths and the amount of fines available in the soil and soil fabric. Whether the results obtained from these studies can be applied to the case of soils subjected to internal erosion remains unknown given that the effects of particle rearrangement and fabric evolution due to erosion on stiffness behaviour have not yet been properly captured (Chen et al., 2016). How stress states and stress paths affect the stiffness responses, including inherent and stress-induced anisotropy, has likewise been ignored in the literature.
To fill these gaps, in the present study, a back-pressure-controlled, bender-equipped triaxial permeameter was developed and used to measure the internal erosion behaviour of gap-graded soils under different stress states following constant mean effective stress compression and extension paths. Erosion-induced changes in the soil’s mechanical properties (i.e. mechanical consequence), including not only the shearing behaviour but also the very small-strain shear modulus and small-strain stiffness, were investigated. Special attention was paid to the evolutions of stiffness anisotropy and stiffness degradation curves before and after erosion. The importance of ensuring sample saturation to accurately understand erosion behaviour was highlighted.
DEVELOPMENT OF NEW EQUIPMENT
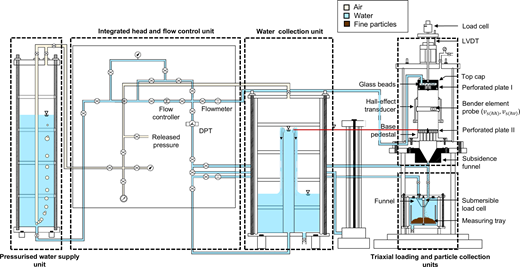
A new head- and flow-controllable triaxial permeameter was developed to quantify the very small-strain to large-strain hydromechanical behaviour of saturated soils during and after internal erosion under any controlled triaxial stress state. This permeameter is capable of measuring any changes in the stiffness anisotropy of the specimens before and after internal erosion and in the post-erosion shearing behaviour under either drained or undrained condition. Fig. 1 provides a schematic diagram of the proposed permeameter. The permeameter set-up consists of a bespoke triaxial loading unit, an integrated head and flow control unit, a pressurised water supply unit, a particle collection unit and a water collection unit.
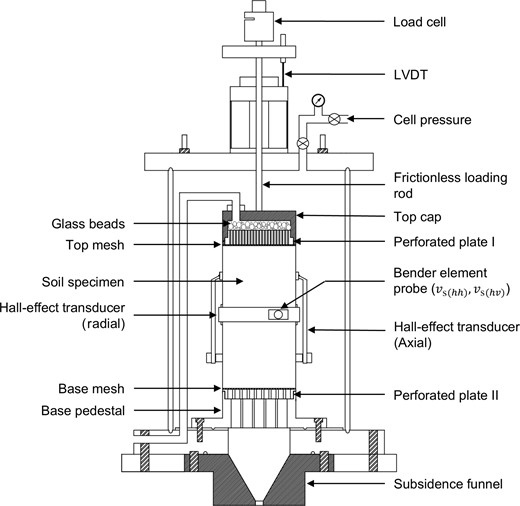
In the triaxial loading unit, a hollow top cap filled with various sizes of glass beads was used to prevent the effects of jet flow when applying a hydraulic gradient across the specimens (Mehdizadeh et al., 2018). The perforated plate I beneath the top cap facilitated the uniform ingress of water to the specimens, whereas the perforated plate II beneath the specimen facilitated the settling of eroded fine particles. A hollow base pedestal was connected to a conical trough to prevent the accumulation of eroded particles at the bottom of the base pedestal. Two pairs of bender elements were installed at the mid-height of the specimen to measure the shear wave velocities at the horizontal–horizontal (HH) and horizontal–vertical (HV) planes and to evaluate the evolution of the inherent fabric after erosion. To measure the small-strain radial and axial strains during erosion and subsequent shearing (at strains ranging between 0·001 and 1%), three Hall-effect transducers (one for radial strain measurement and two for axial strain measurement, all with an accuracy of 0·2%) were mounted at the mid-height of the specimen. Any axial strain beyond 1% was captured by the external linear variable differential transformer (LVDT) and volume change device, which has an accuracy of 0·25% and 0·5%, respectively.
The integrated head and flow control unit comprised multiple control components, including pressure control components, hydraulic gradient and flow rate control and measurement components, pressure difference measurement components and downstream water collection components. Pressure was supplied to the upstream water tank through an air pressure of up to 500 kPa and a flow rate of up to 600 ml/min. This unit can be controlled to flush and erode the specimen by either applying a controlled hydraulic gradient across the specimen in the head-controlled mode or applying a controlled flow rate for water flow through the specimen in the flow-controlled mode. In either of these modes, any change in the pressure difference between the top and bottom of the specimen due to seepage can be directly measured by a differential pressure transducer (DPT; maximum pressure of 35 kPa and accuracy of 0·19%) attached along the flow circuit of the unit. In the head-controlled mode, the actual hydraulic head difference may differ from the applied one. Previous studies show that seepage through a specimen can cause an instantaneous increase in local pore-water pressure near the flow entrance, and the accompanying reduction in the effective stress would lead to a difference between the applied and measured hydraulic gradients (Bendahmane et al., 2008; Ke & Takahashi, 2014a); this phenomenon is known as the post-Darcy flow, which is associated with the inertial effect and the onset of turbulent flow (Bordier & Zimmer, 2000) that causes non-linear flow behaviour. A DPT was used to measure any pressure drop across the specimens during testing (Ke & Takahashi, 2014b; Nguyen & Indraratna, 2020; Rochim et al., 2017).
Through the pressurised water supply, the hydraulic head was controlled through the tip of the tube in the Mariotte bottle by way of a pressurised air supply. The pressurised sedimentation tank was used to collect the eroded particles, whose weights were continuously measured using a submersible load cell (capacity of 8·9 N and accuracy of 0·2%). A funnel was used to minimise the impact force on the soil collection tray due to the jet flow during erosion, thereby improving the accuracy of real-time mass measurements (Ke & Takahashi, 2014b; Mehdizadeh et al., 2018). The water collection unit was a closed unit that could collect the discharged effluent from the specimens during erosion and maintain a constant back-pressure and water head at the bottom of the specimen. The water level in the inner tube of the water collection unit was the same as that at the bottom of the specimen. The air pressure inside this unit was controlled to be the same as the initial back-pressure applied to the specimen. During erosion, the outflow was connected to a flowmeter, and the discharge velocity was measured by weighing the volume of water discharge. Therefore, the saturated hydraulic conductivity of the specimen (ksat) can be obtained by dividing the discharge flow rate by the measured hydraulic gradient across the specimen.
TEST SOIL AND SAMPLE PREPARATION
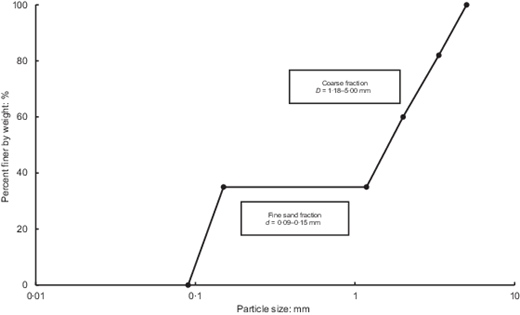
Internally unstable, gap-graded soil was obtained by mixing two types of soils with different particle sizes, namely, completely decomposed granite (CDG) and Leighton Buzzard sand (LBS, fraction E). While the LBS was used as erodible fines, CDG formed the skeleton of the gap-graded soil. The CDG was sieved to three particle sizes (5·00–3·35 mm, 3·35–2·00 mm and 2·00–1·18 mm), whereas the LBS was sieved to a particle size range of 0·15–0·09 mm. By considering 35% of fines by weight, the resulting particle size distribution (PSD) of the gap-graded soil is shown in Fig. 2. According to the Unified Soil Classification System ASTM D2487 (ASTM, 2018), the soil can be classified as SP (poorly graded sand). The soil has a gap ratio (i.e. a measure of internal stability defined as the ratio of the maximum and minimum particle sizes of the severely underrepresented portion on the PSD) of 7·9. The soil can be further classified as internally unstable because: (a) the ratio d15c/d85f (10·2, where d15c is the particle size with 15% finer by weight in the coarse part of the PSD split at an arbitrary point, and d85f is the particle size with 85% finer by weight in the fine part of the PSD) was larger than 4·0 (Kézdi, 1979; Fannin & Moffat, 2006); (b) the ratio (H/F)min (0·75, where H is the mass fraction between particle sizes d and 4d, and F is the mass fraction at any d) was less than 1·0 (Kenney & Lau, 1985; Li & Fannin, 2008); and (c) the gap ratio of fine contents was higher than 3·0 (Chang & Zhang, 2013). The other physical properties of the soil are summarised in Table 1.
The gap-graded soil (35% LBS and 65% CDG by mass) was mixed with de-aired water until an optimum water content of 6·5% by mass was reached. Soil specimens with a 76 mm dia. and 160 mm height each were compacted statically at a rate of 1·25 mm/min in ten layers following the procedures of Ladd (1977) to an initial dry density of 1705·5 kg/m3 (i.e. initial void ratio of 0·621), which corresponds to 90% of the maximum dry density. After placing the specimens on the base pedestal of the triaxial loading unit (Fig. 1) and placing a membrane onto these specimens, two pairs of bender elements were installed at the specimen mid-height. Two axial and one radial Hall-effect transducers were also installed at the mid-height of the specimen to measure the local axial and radial displacements at a small-strain range during testing (Fig. 3). A LVDT was eventually mounted outside the triaxial cell to measure the axial displacement of the specimens at a larger strain range.
TEST PROGRAMME
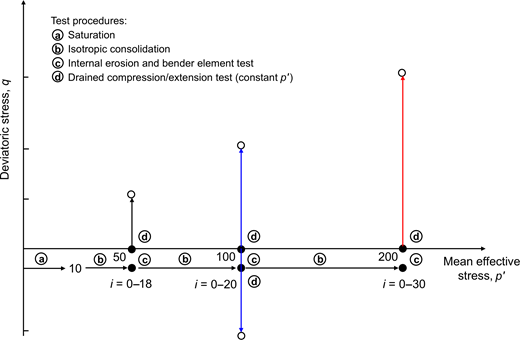
To investigate the very small-strain to large-strain hydromechanical behaviour of the gap-graded specimens during and after internal erosion, two series of experiments that followed the stress paths in p′ (mean effective stress)–q (deviatoric stress) space (where p′ is the mean effective stress defined as and q is the deviatoric stress defined as , where and are the major and minor principal stress, respectively) were conducted (Fig. 4). The first series consisted of reference tests in which the specimens (without experiencing erosion) were subjected to consolidated, drained constant p′ compression at three values of p′, namely, 50, 100 and 150 kPa (denoted as tests B50, B100 and B150 following the stress paths (a)–(b)–(d)), and a drained constant p′ extension at 100 kPa (denoted as test B100E). By doing so, the effects of the changes in p′ during shearing on the shearing behaviour of soil can be eliminated, and the soil responses can be exclusively attributed to the effects of q. This stress path also allows an accurate derivation of a shear stiffness degradation curve (Vucetic & Dobry, 1988; Shibuya & Tanaka, 1996; Atkinson, 2000). The second series was similar to the first one, but the specimens were subjected to head-controlled internal erosion before being subjected to drained constant p′ compression (denoted as tests IB50HB, IB100HB and IB200HB following the stress paths (a)–(b)–(c)–(d)) and drained constant p′ extension (denoted as test IB100HBE). To highlight the importance of ensuring the high degree of saturation of the specimen before and during internal erosion, tests B100 and IB100 were repeated but without applying back-pressure (denoted as tests B100N and IB100HN). In all eight tests, bender tests were carried out right after consolidation at the targeted p′ and at various stages of internal erosion (only for specimens in the second series of tests). Table 2 summarises the test programme and the conditions of each test.
TEST PROCEDURES
Before testing, all specimens were subjected to bottom-up saturation by circulating carbon dioxide and de-aired water in a sufficiently slow inflow water rate (i.e. <0·2 ml/min) to avoid particle segregation and fines migration. Afterwards, a back-pressure of at least 100 kPa (except for tests B100N and IB100HN) was applied to all units of the triaxial permeameter. The saturation procedure was deemed completed when the B-value exceeded 0·95, ensuring a high degree of saturation (Bishop & Blight, 1963).
For the specimens used in tests B100N and IB100N, the B-value was set to 0·894 and 0·887, respectively. After isotropically consolidating the specimens to the target p′ values of 50, 100 and 200 kPa under a drained condition, bender tests were conducted to measure the shear wave velocity. Based on elastic theory, the maximum shear modulus of the specimen in the ij plane (where i is the direction of wave propagation and j is the direction of particle motion), , can be determined as
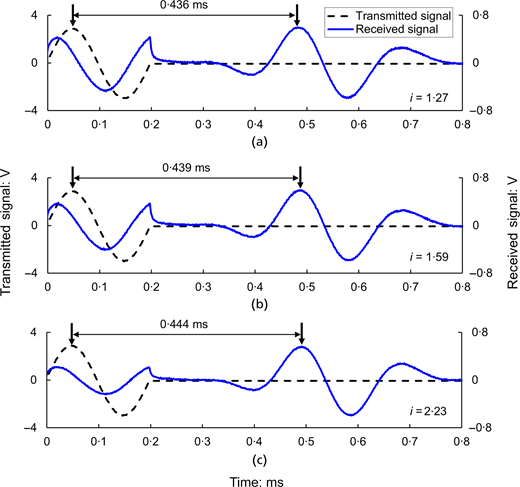
where is the soil bulk density and is the shear wave velocity determined by dividing the travel distance (i.e. the distance between the tips of bender elements in two sides of the sample) by the arrival time determined using the peak-to-peak method ASTM D8295-19 (ASTM, 2019). Fig. 5 shows some example interpretations of the time histories of shear wave velocity at a frequency of 5 kHz when the specimens were subjected to different hydraulic gradient values. This particular frequency provided a clear waveform and was thus selected for all tests to accurately determine the arrival time using the peak-to-peak method. However, conducting bender tests in fully saturated soils that are highly conductive, the errors associated with noise spikes or background noise due to deficiencies in grounding, electrical insulation and mechanical protection (Santamarina et al., 2001), that is the consistent occurrence of the early-peak registered by the received signals, were difficult to avoid.
After measuring , the specimens were subjected to internal erosion. In the head-controlled mode, the upstream water head of the specimen was regulated by controlling air pressure to introduce different hydraulic gradient values to the specimens. The axial and radial strains, pressure head difference across the specimens were recorded every second along with the cumulative eroded particles and outflow rate of the effluent. When no further increase in the amount of eroded fines was recorded, the applied hydraulic head was removed, and bender tests were conducted again to determine any changes in after erosion at constant p′. These tests were repeated by increasing the hydraulic gradient in increments. The critical hydraulic gradient (icr) at which a noticeable amount of fines were recorded in the particle collection unit was identified in each test. When no further loss of fines was observed, the internal erosion test was deemed completed.
After the internal erosion tests, the hydraulic head was gradually reduced until no difference could be observed between the inflow and outflow. Afterwards, the samples were sheared along the drained constant-p′ compression and extension paths at a rate of 4 kPa/h until the stress ratio reached 1·28 and 1·00, respectively, both of which were below the gradient of the critical state line (i.e. MC = 1·63 and ME = −1·02, as reported in Chang & Zhang (2013)). The corresponding deviatoric strains were about and less than 1% for deriving the stiffness degradation curve. The gradient of the deviatoric stress–strain curves (obtained from the Hall-effect transducers) can be used to derive the small-strain shear modulus as follows:
where is the volumetric strain increment; is the deviatoric strain increment; K is the bulk modulus; G is the shear modulus; and Jqp and Jpq are the moduli cross-coupling the shearing and volumetric effects, respectively, which are typically assumed to be zero when the soil is considered isotropic and elastic (Graham & Houlsby, 1983). Upon constant p′ compression, the equation was used to determine G. By knowing by way of equation (1) and G, the stiffness degradation curve (i.e. the relationship between the shear modulus and deviatoric strain) can be determined (Vucetic & Dobry, 1988; Atkinson, 2000).
RESULTS AND DISCUSSION
Amount of fines erosion
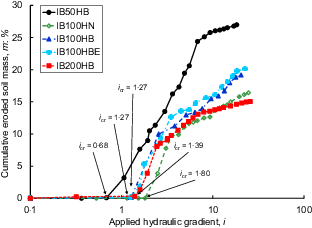
The variations in cumulative eroded soil mass (normalised by the total weight of fines before erosion) with the applied hydraulic gradients are shown in Fig. 6. All specimens, irrespective of the value of p′, always showed a significant increase in erosion only when the applied hydraulic gradient exceeded icr. Under the fully saturated condition, as p′ increased from 50 to 200 kPa, the value of icr doubled from 0·68 to 1·39 (Table 1) yet the amount of eroded fines was reduced from 27·0% to 15·1% (Fig. 6). The specimen subjected to a higher p′ attained a denser state (i.e. lower void ratio; Table 1), thereby strengthening the interlocking effect and increasing the engagement of fines in developing force chains for load transfer (Shire et al., 2014; Chen et al., 2023). As a result, a greater seepage force would be required to drag the relatively stable fine particles within the pores. Even by applying a higher hydraulic gradient (i.e. 30) at a p′ of 200 kPa, compared with the hydraulic gradient (i.e. 18) at p′ of 50 kPa, the specimen subjected to a higher p′ returned a lower amount of eroded mass.
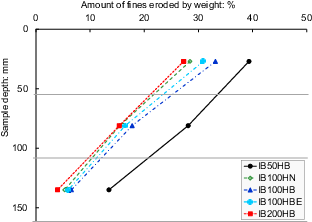
Figure 7 shows the percentage of eroded fines (normalised by the initial weight of the fines) in the top, middle and bottom layers of the specimens eroded under different values of p′. In all cases, a linear distribution of fine loss with depth was detected, thereby indicating that the erosion under downward seepage resulted in a greater amount of fine erosion in the top layer than in the bottom layer. These findings are consistent with those reported in previous experimental studies (Chang & Zhang, 2013; Ke & Takahashi, 2014a; Zhong et al., 2018) and numerical simulations (Xiong et al., 2022; Hu et al., 2023), which may be due to the higher local hydraulic gradient developed in the top soil layer (Moffat & Fannin, 2006). During downward seepage, the fines originally from the top and/or middle layers could migrate to the bottom layer, thus virtually displaying a lower amount of fines erosion. Nonetheless, the spatial distribution suggests that the erosion was not a uniform process and that the changes in the PSD of the local soil would lead to non-uniform changes in the soil properties along the depth of the specimens according to the seepage path (Zhong et al., 2018). This phenomenon was more pronounced at lower p′ where the cumulative eroded soil mass was the highest and more fines were accumulated in the bottom layer. The non-uniform PSD translated to a variation of G0 within ± 3–5%, when comparing the estimations using equation (1) or the local bulk density estimated from the amount of fines loss in Fig. 7. This variation was deemed negligible when comparing to the observed G0 changes due to erosion and the application of different stress paths (see later).
Volumetric behaviour
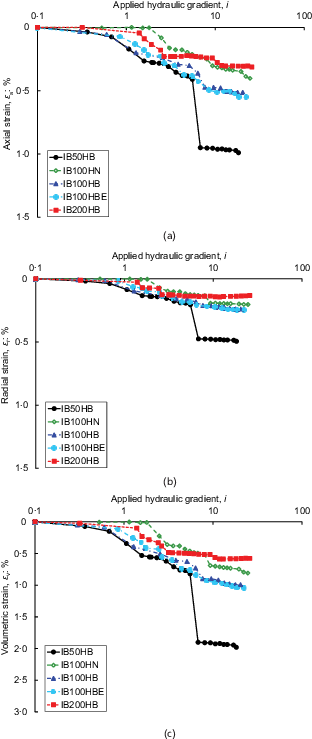
The variations in the axial, radial and volumetric strain of the specimens with the applied hydraulic gradient are depicted in Figs 8(a)–8(c). In general, the axial strains were almost consistently twice the radial strain for all the specimens, displaying a significant anisotropic volumetric behaviour caused by seepage. Upon vertical flushing, the preferred distribution of interparticle contacts could form in the vertical direction (i.e. parallel to the direction of the seepage) because the fines that were horizontally orientated would be forced to rotate towards the vertical orientation, hence introducing substantial axial straining (Nguyen et al., 2019; Liu et al., 2022b). Irrespective of the value of p′, all specimens experienced only a minor contraction before reaching the respective icr (Fig. 8(c)). This observation may be ascribed to the deformation of the top soil layer due to the higher local hydraulic gradient and the resulting erosion in the top layer during the initial stage of erosion (Chang & Zhang, 2013; Mehdizadeh et al., 2021). The rate of volume change substantially increased after the small initial contraction and the onset of fines erosion (i.e. beyond icr). During flushing, the fines that initially supported the strong force chains were likely to have been eroded, thus leading to a gradual loss of support, collapse of the force chains and eventually volumetric contraction of the specimens (McDougall et al., 2013; Ke & Takahashi, 2014b; Chen et al., 2020). Indeed, previous studies based on discrete-element method simulation have demonstrated that significant loss of free-sitting fines led to buckling of force chains and particle rearrangement (McDougall et al., 2013; Kawano et al., 2017) because the majority of these fines contained short and weak contact forces, suggesting that the fines were inactive and had zero or fewer contacts (Yang et al., 2013; Tao & Tao, 2017; Hu et al., 2019). This phenomenon was magnified as the hydraulic gradients further increased. The specimens subjected to a higher p′ displayed less contraction (Fig. 8(c)) due to less fines losses (Fig. 6). In particular, the specimen from test IB50HB exhibited an abrupt contraction when the applied hydraulic gradient reached 5·52, which may refer to the so-called skeleton-deformation hydraulic gradient (isd; Chang and Zhang, 2013). At this state, suffosion, a phenomenon that refers to the progressive buckling of strong force chains followed by an abrupt volume change (Tordesillas et al., 2011), may have occurred. The force chain buckling could be predominantly contributed by seepage force due to the applied hydraulic gradient (Barreto & O’Sullivan, 2012; Hu et al., 2019; Zhang et al., 2019; Liu et al., 2020), as evidenced by the fact that the changes in axial strain during erosion were double those in radial strain (Fig. 8). These kinds of abrupt changes in soil volume were not observed for tests conducted at higher values of p′, indicating that the effects of hydraulic gradient became less substantial and the dominant mechanism causing such changes may be the losses of free-sitting fines and hence the progressive buckling of force chains (Chang & Zhang, 2011; Ke & Takahashi, 2014a; Mehdizadeh et al., 2017).
As the hydraulic gradient further increased, the rate of volume change of all specimens consistently decreased, thereby implying that a more stable soil structure was established after rearranging the coarse particles during internal erosion. This phenomenon also implies that a further increase in seepage force could not sufficiently counteract the mobilised shear force amongst the fine particles and displace them further within the more stabilised soil structure (Chang & Zhang, 2013; Ke & Takahashi, 2014b; Mehdizadeh et al., 2017). Despite the volumetric contraction, all specimens showed an overall increase in void ratio after erosion (Table 2) because the amount of fines loss (i.e. reduction in the solid volume of specimens) was more significant than the reduction in the volume of specimens.
Hydraulic conductivity
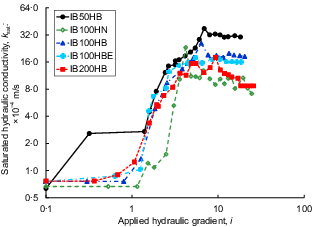
Figure 9 shows the variation in ksat of all specimens (except from test IB100HN) during erosion at different p′ values. ksat followed a similar trend as the amount of fines eroded (Fig. 6) and soil volume change (Fig. 8). Specifically, ksat started to increase substantially beyond icr (i.e. by more than 4 times; Fig. 9) primarily due to the increase in void ratio (Table 2) through volumetric contraction and fines erosion. At an applied hydraulic gradient of approximately 6, a slight reduction in ksat was consistently observed across all specimens, which might be due to the filtering mechanism of the detached fines during their migration in the coarse matrix that leads to possible pore clogging and increased flow tortuosity as the particle size distribution becomes more heterogeneous (Dassanayake & Mousa, 2022). Such a mechanism was more prominent at higher p′, as indicated by the relatively large decrease in ksat. As the hydraulic gradients further increased, the ksat of all specimens reached a steady state following the arrival of the steady-state volumetric strain (Fig. 8) and void ratio. As expected, the ksat values of the specimens subjected to a higher value of p′ were always lower because of their smaller initial void ratio before being eroded (Table 2). These results are consistent with the experimental observations of Ke & Takahashi (2014b).
Very small-strain shear modulus and its anisotropy
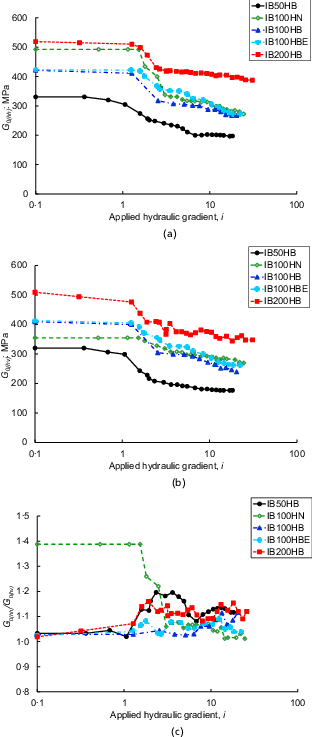
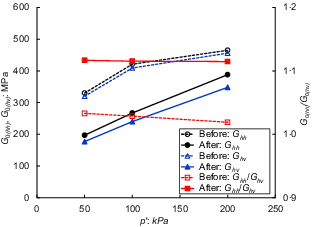
Figures 10(a) and 10(b) show the variations in G0(hh) and G0(hv) with the applied hydraulic gradient, respectively, during erosion. At any given hydraulic gradient, a larger value of p′ and a smaller initial void ratio (Table 2) correspond to a larger shear modulus for G0(hh) and G0(hv) (Fig. 11). This finding is consistent with the results from the literature (Ke & Takahashi, 2014a; Chitravel et al., 2021). G0(hh) and G0(hv) can increase by up to 57% and 59%, respectively, as p′ increased from 50 to 200 kPa. For any given p′, the shear moduli remarkably decreased as the hydraulic gradient exceeded the respective icr (Figs. 10(a) and 10(b)). This phenomenon could be attributed to the increase in the void ratio (Table 2) and the changes in soil fabric due to the progressive collapse of force chains and rearrangement of soil particles during erosion (Hicher, 2013; Ouyang & Takahashi, 2016; Kawano et al., 2018). However, the loss of fines that were not engaging in strong force chains led to the reduction in particle contacts and therefore reducing the G0. Fig. 11 shows that at any p′, the effects of internal erosion on G0(hv) (i.e. the amount of reduction due to erosion) were more significant than those on G0(hh), thereby implying that the erosion altered the fabric anisotropy of the soil.
Figure 10(c) shows the variation in stiffness anisotropy (i.e. G0(hh)/G0(hv)) with the applied hydraulic gradient. The observed anisotropy of stiffness was exclusively associated with the intrinsic soil fabric because the values were obtained at an isotropic stress condition (Liu et al., 2022a). Before erosion, the stiffness anisotropy for all fully saturated specimens (except specimen IB100HN) was close to 1·0. The soil specimens produced by way of the moist tamping method typically have an approximately isotropic soil fabric because the particle aggregates are constrained by the matric suction when the specimens are initially unsaturated, thereby explaining why these particles lack a distinct preferential orientation (Ni et al., 2021). During erosion, the stiffness anisotropy of these fully saturated specimens significantly increased due to the changes in the void distribution within the soil matrix and the rearrangement of soil particles as the soil volume changed (Ouyang & Takahashi, 2016). The increase in the stiffness anisotropy suggests an increased degree of particle reorganisation or realignment in the horizontal direction as a result of erosion (Bellotti et al., 1996; Toyota et al., 2018; Le et al., 2020; Karimzadeh et al., 2024). The horizontally aligned elongated particles tend to have fewer contacts in the horizontal direction than in the vertical direction. Therefore, under isotropic confinement, the horizontal contacts would transmit more interparticle contact stresses than the vertical ones. As a result, the frictional particle contacts in the horizontal direction were stiffer than those in the vertical direction (Basson & Martinez, 2023), thus explaining the greater values of G0(hh) than G0(hv) and the resulting increase in fabric anisotropy (Figs 10(c) and 11).
Mechanical consequence
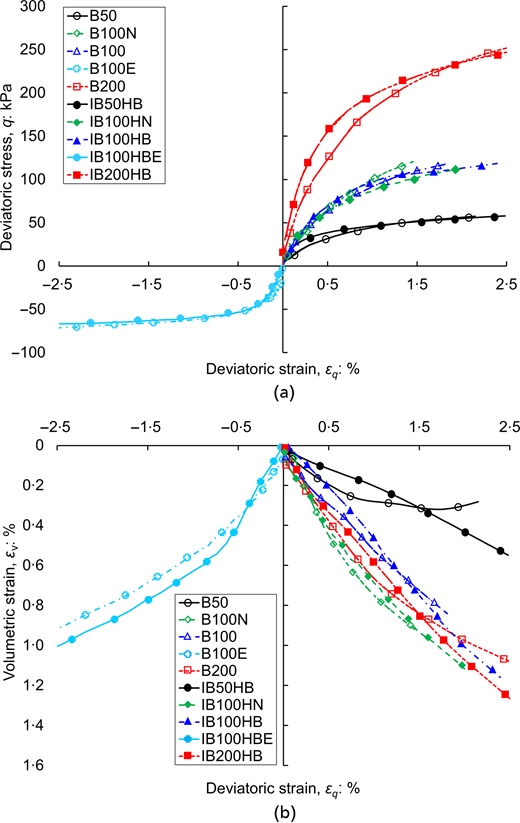
Figure 12(a) shows the deviatoric stress–deviatoric strain relationships for all specimens following the constant p′ compression stress path. At any given p′, the eroded specimens always displayed a stiffer and stronger response than their intact counterparts when the strain was less than 1·5%. From the results of the volumetric strain–deviatoric strain relationship (Fig. 12(b)), all specimens, whether subjected to erosion or not, displayed a contractive behaviour at all levels of p′. For strains less than 1·5%, the eroded specimens were less contractive than their intact counterparts. This phenomenon was also observed by Chitravel et al. (2022), who reported that eroded soils have a higher shear strength and were less contractive than intact ones upon compression. These phenomena may be attributed to the increase in soil fabric anisotropy during erosion, as shown in Fig. 11, which implies a larger number of soil particles aligning horizontally within the soil fabric after erosion. These observations may explain why the eroded specimens in this study exhibited a higher shear strength than their intact counterparts despite having higher void ratios upon compression, at which the principal major stress was perpendicular to the orientation of the majority of the soil particles elongated. However, further compression to higher strains from 1·5 to 3% resulted in the opposite trend, that is, the eroded specimens gained less shear strength and became more contractive than their intact counterparts. This phenomenon implies that the fabric evolution resulting from the straining process occurred at a faster rate in the intact specimens, wherein the particles may have aligned more rapidly with the loading direction. Indeed, the intact specimens took less deviatoric strain to reduce the rate of change in volumetric strain (Fig. 12(b)). The faster fabric evolution upon compression could be attributed to the loading direction with respect to the fabric orientation and the presence of more fine contents in the intact specimens, which facilitate the smoother rolling of soil particles upon shearing (Fu & Dafalias, 2011; Wei et al., 2020). Indeed, some fine particles that might be engaged with the strong force chains of the eroded specimens might have been displaced laterally during the shearing process (Barreto & O’Sullivan, 2012; Taha et al., 2022). The loss of fine particle support might have caused the fabric evolution to be slower and the development of volumetric strain to be faster, hence causing weaker soil responses upon compression compared to the intact specimens.
Upon triaxial extension, the opposite trend was observed, that is, the eroded specimens displayed a lower shear strength than the intact ones. This stress path dependency, which was also observed by Chitravel et al. (2021), could be attributed to the difference in the soil fabric anisotropy between the eroded and intact specimens. As demonstrated in Fig. 11, the soil fabric anisotropy increased after erosion, which corresponded to the increased horizontal alignment of soil particles. As a result, when subjected to extension (wherein the major principal stress was more aligned with the elongation of the majority of the soil particles of the eroded specimen), a lower shear strength was observed than under the intact case (Yoshimine et al., 1998; Sivathayalan & Vaid, 2002).
Stiffness degradation curves
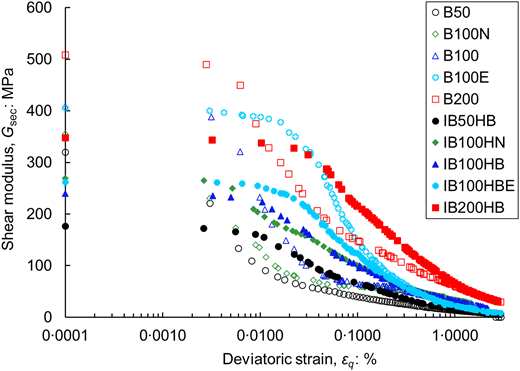
Figure 13 shows the variation in secant modulus (Gsec) with deviatoric strain in a semi-logarithmic scale obtained from constant-p′ compression and extension tests. G0(hv) was placed at a very small-strain range for reference as it represents the shear modulus in the same plane as Gsec upon the triaxial stress path. The value of the volumetric threshold shear strain (γtv; when the behaviour is deemed to be non-linear elastic and the shear modulus starts to degrade), as defined by Vucetic (1994), in each case is summarised in Table 2. The values of γtv of the eroded specimens (0·01 to 0·03%) were almost 10 times higher than those of the intact ones (0·001 to 0·003%) due to the lower fines content in the former case according to existing experimental observations (Dobry & Ng, 1992; Dobry et al., 2015; Dobry & Abdoun, 2015). When the strain level was relatively low, the Gsec of the eroded specimens was lower than that of the intact ones at any p′ along the compression path. However, the opposite trend was observed when exceeding γtv as a plastic strain was developed. This phenomenon may be explained by the higher γtv values of the eroded specimens relative to the intact cases, that is, more strains were needed to induce changes in the soil structure and the Gsec.
At a p′ of 100 kPa, the Gsec obtained from the extension path was always higher than that from the compression path for the eroded and intact specimens. This phenomenon could be due to the higher intermediate principal stress ratio (where and are the major, intermediate and minor principal effective stress components, respectively) upon extension (b = 1) compared with the case of compression (b = 0) (Holman & Finno, 2005), thus providing a more effective confinement to the soil regardless of whether erosion took place or not. Moreover, due to the higher value of b, the γtv values of the eroded and intact specimens subjected to extension were higher than those of their compression counterparts. Interestingly, in contrast to the observation made during compression, the γtv value of the eroded specimen subjected to extension was close to that of the intact specimen despite having a lower fines content in the former case (Table 2). This observation might be attributed to the higher fabric anisotropy in the eroded specimen (Fig. 11; i.e. more particles were oriented in the horizontal direction parallel to their elongation axis), in which the weak plane aligned with the major principal stress upon extension, thereby reducing strength (Fig. 12(a)) and stiffness (Fig. 13). In other words, the increase in γtv due to fines loss in the eroded specimens might have been counteracted by the reduction in γtv due to the increased anisotropy, thereby producing a γtv value similar to the intact counterpart.
EFFECTS OF UNSATURATION
The test results show that the responses of specimen IB100HN, for which erosion tests were conducted without applying back-pressure, significantly differed from the responses of other specimens, thereby highlighting the remarkable effects of unsaturation during the erosion process. First, compared with the saturated counterpart, the unsaturated specimen tested at a p′ value of 100 kPa obtained a higher istart of 1·8 (Table 2; Fig. 6), but the amount of eroded fines was always less by almost the same amount of 2% at any hydraulic gradient. These phenomena could be due to the capillary (hence suction) effects, which made the IB100HN specimen develop a stronger network of force chains and enhanced the particle contacts between the coarse and fine portions in the matrix to reduce the tendency of particle detachment (Wu et al., 1984). The unsaturated specimen also exhibited a lower ksat (Fig. 9) due to the presence of air, which might have blocked the transfer of fines during their transport upon erosion, thus increasing flow tortuosity. Second, the volumetric strain of the unsaturated IB100HN was lower than that of the saturated IB100HB (Fig. 8), which could be due to the suction-induced increase in the interparticle force that enhanced the resistance of the specimen against volumetric change (Ng & Zhou, 2014).
In contrast to the behaviour observed from the saturated specimens, the shear strength of the eroded specimens was lower than that of their intact counterparts under the unsaturated condition (Fig. 12(a)). This observation aligns with the findings obtained when back-pressure was not applied during sample saturation (Sivakumar & Wheeler, 2000; Cuisinier & Laloui, 2004; Li & Zhang, 2009). As shown in Fig. 10(c), the fabric anisotropy of the unsaturated eroded specimen was lower than that of the intact case due to the fines loss during erosion. The former case was more isotropic and thus displayed a lower strength. The higher void ratio in the eroded specimen (Table 2) might also explain why this specimen had a lower strength than the intact case.
As expected, the stiffness anisotropy (i.e. G0(hh)/G0(hv)) of the intact unsaturated specimens was higher than that of their saturated counterparts (Figs 10(a)–10(c)) due to the effects of matric suction (Ng & Xu, 2012; Le et al., 2020), which may have made the distributions of water menisci and the interparticle normal force more anisotropic (Mancuso et al., 2002; Ng & Yung, 2008) and hence resulted in a higher initial stiffness anisotropy. After erosion, the stiffness anisotropy of the unsaturated specimens was reduced (unlike the case for the saturated specimens; Fig. 10(c)) and approached a value similar to that of the saturated specimens. Given the greater interparticle normal force in the unsaturated specimens and the more rigid soil structure due to capillarity effects, the tendency of particle detachment and realignment towards the seepage (i.e. vertical) direction (Qian et al., 1993) was reduced, thus explaining the smaller volumetric strain and lower amount of fines erosion in unsaturated specimens (Figs 6 and 8).
After erosion, the values of Gsec of the unsaturated specimens were similar to those of the saturated specimens. These trends align with the similar fabric anisotropy highlighted in Fig. 10(c). Although the presence of matric suction in the unsaturated specimens might lead to a higher γtv value compared with the intact case, the higher fines content of these specimens after erosion (Fig. 6) would simultaneously reduce the value of γtv. Such a counteracting effect on γtv makes the stiffness reduction curve practically similar between the unsaturated and saturated intact specimens.
CONCLUDING REMARKS
A novel back-pressure-controlled, bender-equipped triaxial permeameter was developed in this study to measure the internal erosion behaviour of soils under different stress states and the associated changes in the anisotropic behaviour of the eroded soils. This apparatus can apply a back-pressure on the soil specimens and maintain such pressure throughout the erosion process and subsequent shearing. This apparatus can also determine the evolution of the fabric anisotropy of the soil specimens during erosion by measuring the shear wave velocity at various wave propagation and polarisation directions under the isotropic loading condition. Stiffness degradation curves that cover the very small-strain to large-strain ranges of the soil specimens, whether subjected to erosion or not, can be determined by a constant-p′ path.
Erosion (i.e. fines loss) took place when the hydraulic gradients of the soil specimens exceeded a critical value (istart), and istart increased along with the effective confinement. Accompanying the fines loss and the collapse of the force chain was the volumetric contraction of the eroded specimens, especially for those specimens that experienced less effective confinement and displayed a more rigid response. The fines loss triggered an initial increase in hydraulic conductivity, but this hydraulic property considerably decreased due to pore clogging by those fines that migrated and eventually accumulated at the bottom part of the eroded specimens.
Erosion resulted in significant reductions in G0(hv) and G0(hh) at any confinement as the hydraulic gradient exceeded the istart due to the increase in void ratio after fines loss. However, the fabric anisotropy (expressed in terms of G0(hh)/G0(hv)) of the initially isotropic saturated specimens increased by up to 10% along with the hydraulic gradient, thereby implying that the particles were arranged with their long side orientated towards the horizontal direction and had stronger and stiffer horizontal contacts.
After compression, the shear strength of the eroded specimens at the small-strain range (i.e. 0·001–1%) was higher than that of the intact counterparts, with the former showing a less contractive behaviour. The changes in shearing behaviour were attributable to the erosion-induced increase in fabric anisotropy. However, the shear strength of these specimens became practically the same at a large-strain range (i.e. >1%) due to the fabric evolution resulting from the straining process in which the soil particles may have aligned with the direction of the major principal stress. However, this observation was reversed following extension where the major principal stress was more aligned with the elongation of the majority of the particles of the more anisotropic eroded specimens. Although the eroded specimens displayed a lower Gsec than the intact case at very small-strain and small-strain ranges, the former had a higher volumetric threshold shear strain due to its lower amount of fines, resulting in a higher Gsec at the large-strain range.
Maintaining the specimen saturation by applying back-pressure throughout the erosion test is crucial to accurately capture the complexities of soil behaviour during and after erosion, particularly when assessing the evolution of fabric anisotropy. The stronger and stiffer soil structure in the unsaturated specimens, which could be ascribed to the effects of matric suction, resulted in a higher istart and lower ks compared with their saturated counterparts. Although these unsaturated specimens initially had a higher fabric anisotropy than their saturated counterparts, their anisotropy values after erosion became similar. The stronger shearing and stiffer volumetric response of the unsaturated specimens may be due to their lower fines loss and volume change during erosion. The similarity in fabric anisotropy and the comparable Gsec values of the unsaturated and saturated specimens after erosion, despite the presence of matric suction and higher fines content in the former case, resulted in a practically similar stiffness reduction curve for both cases.
ACKNOWLEDGEMENT
The authors gratefully acknowledge the funding support from the Hong Kong Research Grants Council (nos. 16207521, C6006-20G, N_HKUST603_22).
REFERENCES
Discussion on this paper closes 1 May 2026; for further details see p. ii.