Reliable interpretation of piezocone test (CPTU) data in clays remains challenging because conventional empirical correlations with undrained shear strength often rely on cone factors that neglect stress-history effects. This paper presents a unified framework that relates CPTU results to critical state soil mechanics (CSSM) and stress history and normalised soil engineering properties (SHANSEP) concepts, providing a soil-mechanics-based expression for cone factors as functions of overconsolidation ratio and friction angle. The formulation, derived from the modified Cam Clay model, is evaluated for the main cone factors (, and ) and validated against an extensive database of onshore and offshore clays. The results show excellent agreement between measured and predicted trends, with low bias and limited scatter. Isotropic and anisotropic model assumptions yield comparable accuracy, while proves most robust for practical use. The proposed CSSM–SHANSEP CPTU framework offers a rational and transparent alternative to empirical approaches, enabling consistent interpretation of CPTU data and more reliable assessment of undrained shear strength in natural clays.
NOTATION
- a
modified Cam Clay (MCC) parameter for normally consolidated anisotropic loading
- Bq
normalised pore pressure parameter from piezocone test (CPTU) Δu/qnet
- b′
bias factor
- Cc
compression index of soil
- Cs
swelling index of soil
- fs
sleeve friction measured from CPTU
- k
pore pressure-based factor for σ′y
- M
slope of the critical state line in the modified Cam Clay (MCC) model
- m
SHANSEP stress-history exponent
- Nke
hybrid effective factor for su
- Nkt
cone tip resistance-based factor for su
- Nm
cone resistance number
- Nmc
modified cone resistance number
- NΔu
pore pressure-based factor for su
- p′
effective mean stress
- Qt
normalised cone resistance qnet/σ′v0
- qc
cone tip resistance measured from CPTU
- qe
effective cone resistance qt − u2
- qnet
net cone resistance qt − σv0
- qt
cone tip resistance measured from CPTU corrected for pore pressure effects
- S
SHANSEP normalised strength parameter
- su
undrained shear strength
- su/σ′vc
normalised undrained shear strength, also su/σ′v0
- suC
triaxial compression undrained shear strength
- suC/σ′vc
triaxial compression normalised undrained shear strength, also suC/σ′v0
- u0
equilibrium pore pressure in the soil
- u2
pore pressure measured behind the CPTU cone tip
- w
natural water content
- α
cone tip resistance-based factor for σ′y
- Δu
excess pore pressure u2 − u0
- ε
hybrid effective factor for σ′y
- Λ
MCC stress exponent 1 − Cs/Cc
- σv0
total overburden stress
- σ′v0
in situ vertical effective stress
- σ′vc
vertical effective consolidation stress
- σ′y
vertical yield or preconsolidation () stress
- ϕ′
effective friction angle
INTRODUCTION
The undrained shear strength is one of the most widely used engineering parameters in geotechnical practice. It is used to model soil strength under short-term loading, controlling the stability of embankments, slopes and retaining structures, and governing foundation capacity in fine-grained soils, such as clays and low-permeability silts. Determining is not straightforward, as it depends on consolidation stress, in situ stress and stress history, test type, inherent anisotropy, stress path, mobilised strain level, strain rate and temperature, for example (Kulhawy & Mayne, 1990; Länsivaara, 1999), and sample quality (Lunne et al., 2006; Karlsrud and Hernandez-Martinez, 2013; Di Buò et al., 2019) among others. Reliable strength profiles are therefore essential for safe and economical design.
The piezocone penetration test (CPTU) is one of the most widely used in situ tools for characterising fine-grained soils (Lunne et al., 2002). It provides continuous measurements of cone resistance, sleeve friction and pore pressure, which can be interpreted to derive strength and stiffness. In practice, is obtained using empirical cone factors, most commonly (tip resistance-based), (pore pressure-based) and (hybrid) calibrated against laboratory data (Lunne et al., 2002). These factors are often assumed constant within a layer, a geological unit, or even across an entire site. Such simplifications, often driven by the limited availability of high-quality laboratory data, neglect the systematic influence of stress history, stress path and soil type. The consequences can be inconsistent or unconservative designs. The challenge is particularly pronounced in overconsolidated (OC) clays, where dilative stress–strain behaviour and large variations of overconsolidation ratio (OCR) with depth complicate the definition of and therefore the selection of representative cone factors, and in silts where partial drainage and reduced pore pressure response may further increase uncertainty (Carroll & Paniagua, 2018; Carotenuto et al., 2023).
Theoretical as well as numerical formulations have been proposed in the literature to interpret (e.g. Konrad & Law, 1987; Teh & Houlsby, 1991; Lu et al., 2004). In parallel, a multitude of correlations have been reported in the literature to derive engineering parameters of fine-grained soils (Lunne et al., 2002; Mayne, 2007; Robertson, 2009). While these approaches have significantly advanced CPTU interpretation, they either rely on extensive laboratory characterisation and detailed constitutive modelling, or on empirical calibration factors that implicitly embed stress-history effects.Despite these advances, practice still relies heavily on empirical calibration against limited laboratory tests, even though critical state soil mechanics (CSSM) indicates that should vary systematically with the effective stress friction angle, , and the yield stress, . Embedding these parameters within an engineering framework allows the interpretation of CPTUs to be grounded in soil mechanics while remaining directly applicable to routine design practice.
The stress history and normalised soil engineering properties (SHANSEP) framework (Ladd & Foott, 1974) provides a rational basis for relating normalised strength to stress history and has been validated in a wide range of natural as well as reconstituted clays (Ladd et al., 1977; Larsson, 1980; Ladd & DeGroot, 2003; Karlsrud and Hernandez-Martinez, 2013; D’Ignazio et al., 2021). It offers a way of interpreting CPTU results that captures depth-varying behaviour more realistically than the conventional constant-N approach, as shown by preliminary studies in a soft, normally consolidated (NC) clay site from Finland (D’Ignazio & Lehtonen, 2021) and a North Sea OC clay deposit (D’Ignazio et al., 2020).
In this paper, semi-empirical equations for CPTU interpretation are developed within a CSSM–SHANSEP framework, linking cone factors explicitly to and . The approach is validated against a large international database of OC clays from diverse geological settings. The results capture the observed variability of cone factors with stress history and soil type, providing a more transparent and robust basis for CPTU interpretation. The implications for practice are significant: the framework allows engineers to rationalise cone factors across sites, by relating their variation to differences in stress history and fundamental soil properties rather than treating them as site-specific empirical constants, and obtain reliable strength profiles even where test data are sparse.
BACKGROUND
Undrained shear strength of clays under a normalised framework
The undrained shear strength reflects the soil’s short-term resistance to shear without drainage of pore water. Laboratory determination of typically involves triaxial compression (TXC), triaxial extension (TXE) or direct simple shear (DSS) tests on high-quality samples, while, among others, the field vane test (FVT), standard penetration test (SPT) and CPTU interpretation provide in situ estimates (e.g. Kulhawy & Mayne, 1990). Each method introduces sources of uncertainty, including sample disturbance, rate effects, strain-level definition and equipment calibration.
Ladd & Foott (1974) introduced the SHANSEP concept to capture the dependence of on stress history. The framework expresses the normalised strength as (Equation 1)
where is the vertical effective consolidation stress defining the reference stress state, which may represent either the in situ vertical effective stress ( or the vertical effective stress applied during laboratory reconsolidation. The overconsolidation ratio is defined as , where is the vertical yield stress, commonly referred to as the preconsolidation stress () that is derived from laboratory consolidation tests. is the normalised strength ratio in the NC state, and is an empirical stress-history exponent.
Such a framework has been validated across a wide range of natural and reconstituted clays (Ladd et al., 1977; Ladd & DeGroot, 2003; Karlsrud and Hernandez-Martinez, 2013), where is obtained either from undisturbed samples reconsolidated to the in situ stress state, or from recompressed specimens in which an artificial is imposed by consolidation to a prescribed preconsolidation stress followed by unloading to the target vertical effective stress. It provides a consistent basis for rationalising the influence of stress history, enabling extrapolation from laboratory data and databases to field conditions.
The parameters and are load-path dependent, meaning that undrained TXC, TXE and DSS tests yield to different values (Ladd & DeGroot, 2003; DeGroot et al., 2019). For TXC, typical values of range between 0·28 and 0·35 (Andersen, 2015; DeGroot et al., 2019; Paniagua et al., 2019; Yang et al., 2019; Andersen et al., 2023), whereas for DSS they are from 0·20 to 0·28 (Jamiolkowski, 1985; Ladd & DeGroot, 2003; Andersen, 2015; Westerberg et al., 2015; D’Ignazio et al., 2016; D’Ignazio & Länsivaara, 2024). Larsson (1980) observed from DSS and TXE to increase linearly with the soil’s liquid limit , with from TXC being independent on .
Reported values of the stress exponent typically lie between 0·7 and 1·0 for OCR < 4, with somewhat higher values in extension (Ladd, 1991; DeGroot et al., 2019; Paniagua et al., 2019). Some studies indicate ≈ 0·8 is a reasonable general value for clays (Larsson, 1980; Ladd, 1991; Andersen, 2004; D’Ignazio et al., 2016, 2017). Mitchell & Soga (2005) reported between 0·7 and 0·9 for low- to medium-sensitivity clays, while Ladd & DeGroot (2003) observed a higher value of about 1·0 in structured soils and sensitive clays.
Karlsrud and Hernandez-Martinez (2013) and Paniagua et al. (2019) observed a dependency of and on the natural water content for all three basic shearing modes based on a high-quality database of block samples of Norwegian sensitive clays. No dependency of and on index parameters was observed from FVT in Finnish clays (D’Ignazio et al., 2016).
CPTU interpretation of the engineering parameters of clays
Undrained shear strength
In practice, CPTU results are interpreted using empirical cone factors, the most common being , and . For the cone tip resistance
where is the measured cone resistance corrected for pore pressure effects (Lunne et al., 2002) and is the total overburden stress. The quantity is referred to as the net cone resistance . Alternatively, pore-pressure measurements allow the use of
where is the pore pressure measured behind the cone tip and is the equilibrium pore pressure. The quantity is referred to as the effective cone resistance .
Cone factors are usually obtained by back-analysis against laboratory or FVT results. For low- offshore and onshore clays, Low et al. (2010) reported = 8·6–15·3 and = 3·3–8·8 for TXC and = 11–20 and = 4·8–11·9 for FVT. For DSS, Westerberg et al. (2015) reported ≈ 20 for organic sulfide clays and silts from Sweden. Paniagua et al. (2019) found = 5–16 and = 5–10 for TXC in onshore Norwegian clays with OCR less than 6. In contrast, Lunne et al. (1983) found > 30 at shallow depths for a heavily OC North Sea clay deposit. Moreover, for OC and fissured clays, Powell et al. (1989) found 20 < < 30 to match reference values of obtained from laboratory TXC tests and field plate load test results. Ching et al. (2014) reported = 1·5–40 from a large global database and a wide range of test types, with decreasing with increasing normalised pore pressure parameter . Paniagua et al. (2019) observed = 1·2–10 for TXC mode, confirming the trend with .
Mayne & Peuchen (2018) and Mayne & Peuchen (2022) observed a semi-logarithmic dependence of on , with increasing with decreasing , based on a large dataset of TXC tests and CPTU data consisting of 62 clays and 497 triaxial tests. They reported in the range 6–30, where the lowest values related to soft sensitive and quick clay deposits, while the higher values related to stiff, OC to fissured clays.
Yield stress
The CPTU derivation of yield stress and, therefore, , relies on empirical correlations, as for the . These correlations are calibrated against laboratory-derived or , typically obtained from oedometer or constant-rate-of-strain (CRS) consolidation tests. For instance, Chen & Mayne (1996) suggested
where , and are unit- or layer-specific empirical coefficients that for OCR < 5 vary in the range 0·15–0·5, 0·3–0·8 and 0·2–0·9, respectively (D’Ignazio et al., 2019). Mean values of = 0·3, = 0·53 and = 0·50 are reported by Chen & Mayne (1996) for clays worldwide. Di Buò et al. (2020) suggested = 0·3 and = 0·39 for slightly OC Finnish soft clays. D’Ignazio et al. (2020) reported = 0·2 for a heavily OC North Sea clay deposit. Furthermore, D’Ignazio et al. (2019) found the correlation coefficients to be independent of basic clay properties.
Effective friction angle
When CPTU soundings are carried out in clays and other fine-grained soils at the standard penetration rate, interpretation is usually based on a total stress approach, with emphasis on . It is, however, well established that the fundamental behaviour of soils is governed by an effective stress framework (Schofield & Wroth, 1968; Lamb & Whitman, 1979). As suggested by Ouyang & Mayne (2018, 2019), the interpretation of the effective friction angle from CPTU data for NC to lightly OC clays and clayey silts is carried out according to the following equation (8)
where the cone resistance number is equal to the normalised cone resistance when the effective cohesion = 0. The equation is applicable in the range and and for intact clays and clayey silts with .
The above equation was originally developed by the Norwegian Technical University (NTH) (Senneset et al., 1989). Therefore, this solution is hereinafter referred to as the NTH solution.
For OC clays, a modified NTH solution can be used as suggested by Ouyang & Mayne (2019), where the stress history effects are accounted for by revising the cone resistance number . The relationship between the original and the revised is
From CSSM, the stress exponent is theoretically defined as where and are the swelling and compression indices from isotropic or one-dimensional consolidation tests (Schofield & Wroth, 1968). For undrained conditions, when the stress state reaches the yield surface, the tendency for plastic volumetric compression must be balanced by an equal amount of elastic volumetric expansion, resulting in a reduction of the effective mean stress . The ratio therefore governs the direction of the effective stress path. The smaller this ratio, or the higher the corresponding value, the greater the reduction in effective stress, meaning that the critical state line is reached at a lower , and thus at a lower . In reality, creep is always present; that is, the plastic component actually consists of viscoplastic strains. Consequently, can also be interpreted as a parameter that accounts for strain rate effects. At lower strain rates, there is more time for creep to occur, leading to larger viscoplastic strains. Therefore, a lower ratio or a higher value corresponds to lower strain rates, and hence to a lower .
Following the CSSM concept, the stress exponent can also be linked to the empirical SHANSEP procedure, where it is termed (Ladd, 1991; Ouyang & Mayne, 2019). Ladd (1991) also provided recommendations for , which typically takes values slightly lower than . The parameter approaches 1 when the ratio approaches zero. This condition may occur in brittle or cemented materials that exhibit high OC stiffness, followed by a marked increase in compressibility in the NC state. These characteristics are consistent with the observations of Ladd & DeGroot (2003) on sensitive clays.
Linking normalised parameters to fundamental soil properties
Critical state soil mechanics, through the modified Cam Clay (MCC) model, provides closed-form solutions for the undrained strength ratio of NC clays (Wroth, 1984; Mayne, 2001). The normalised strength ratio can be expressed as a function of the critical state friction angle , the stress path and the compressibility characteristics of the soil through . Analytical solutions for common laboratory loading conditions are
where and . The subscripts and indicate triaxial isotropically consolidated undrained compression and consolidated undrained compression, respectively.
Although is defined at critical state (large strains), it controls the inclination and position of the yield surface in stress space. As shown by Länsivaara (1999), the higher the friction angle, the higher is the inclination of the yield surface and the ratio . Undrained failure, even when occurring at small strains, is governed by the intersection of the stress path with this yield surface, with the mobilised strength additionally influenced by strain-rate effects through the viscoplastic response of the soil.
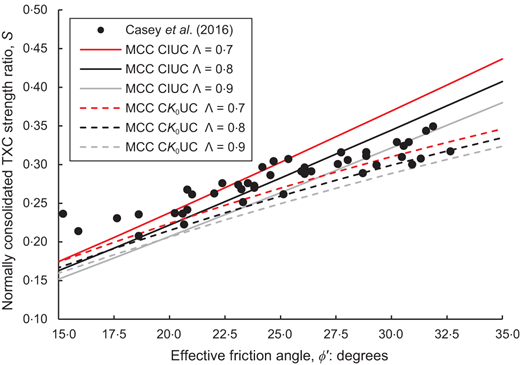
Casey et al. (2016) reported measurements of over a wide stress range (0·1–100 MPa) for varying initial stress ratios, with assumed to follow Jaky’s expression . Comparison of these data with equations (10) and (11) indicates that the anisotropic solution (equation (3)) provides a closer fit to the experimental trend for , and effectively represents a lower-bound envelope for values between 0·7 and 0·9 (see Fig. 1). As previously discussed, when applying to evaluate , as in equations (10) and (11), its value is not merely a clay-dependent parameter, but it is also influenced by the test procedure, particularly by the applied strain rate. In Fig. 1, this means that the lower lines (i.e. higher values) correspond to values obtained at lower strain rates.
SHANSEP-BASED CPTU INTERPRETATION OF CONE FACTORS
By combining the SHANSEP framework with CPTU interpretation, cone factors can be expressed as functions of stress history rather than empirical constants. This allows the influence of and soil behaviour to be captured explicitly, leading to semi-empirical expressions for , and .
The derivation follows from combining the SHANSEP expression for with CPTU interpretation equations, together with CPTU-based correlations for yield stress. The resulting equations (13)–(15) are established from the combination of equations (1), (2), (5), equations (1), (3), (6) and equations (1), (4), (7) respectively.
Equations (13)–(15) show that cone factors increase with OCR provided m ≤ 1. In equations (13)–(15), the in situ vertical effective stress is obtained from the effective stress profile, while the yield stress and corresponding are obtained either from site-specific laboratory consolidation data or from CPTU-based correlations (see earlier section ‘Yield stress’). The friction angle is estimated from equation (8) or triaxial data where available, and the exponent is adopted from SHANSEP based on laboratory data or literature recommendations ( = 0·7–0·9).
For the NC state (), adopting and (corresponding to according to equation (12)) gives , consistent with the recommendation of Robertson (2009) for DSS shearing. For TXC, and (), , in agreement with Paniagua et al. (2019) and the lower bound reported by Low et al. (2010). Similarly, for and , Equation (13) gives , close to the mean field vane values reported by Low et al. (2010). For triaxial compression with and , the results and again align with published data (Low et al., 2010; Paniagua et al., 2019).
This framework demonstrates that cone factors should not generally be assumed constant for a given soil unit or layer, as they are stress-history-dependent parameters that may vary where stress history changes within a site. It therefore provides a transparent and soil-mechanics-based basis for CPTU interpretation across a wide range of clay deposits and site conditions.
VALIDATION OF THE SHANSEP–CPTU FRAMEWORK
Database of overconsolidated clays
For the validation of the proposed framework, a database of OC clays was compiled from selected studies (Rad & Lunne, 1988; Mayne & Peuchen, 2018, 2022; Paniagua et al., 2019) where CPTU measurements were presented alongside independent measurements of . To maintain consistency, only cases reporting from TXC tests () were included as the reference. Although DSS tests are highly relevant to design in many practical situations, very few studies report DSS data in combination with CPTU (e.g. Westerberg et al., 2015), and such cases could not be incorporated into the present compilation.
It is acknowledged that CPTU penetration and laboratory shear tests (TXC or DSS) involve different stress paths and failure mechanisms. This limitation is inherent to all CPTU–laboratory comparisons and should be borne in mind when interpreting the agreement between CPTU-derived and laboratory-measured .
The database is multivariate and contains 219 data points collected from 45 sites worldwide. It brings together both offshore and onshore deposits including both intact and fissured clays, covering a range of geological settings including marine and glacial clays. Reported laboratory values extend from about 1 in NC clays to 60 in heavily OC deposits. This breadth ensures that the evaluation of the SHANSEP–CPTU framework can be carried out across the full spectrum of stress histories typically encountered in natural clays. The natural water content and plasticity index vary in the range 9–155% and 4–87%, respectively. The undrained shear strength for TXC mode is 7–380 kPa, with normalised = 0·29–4·35.
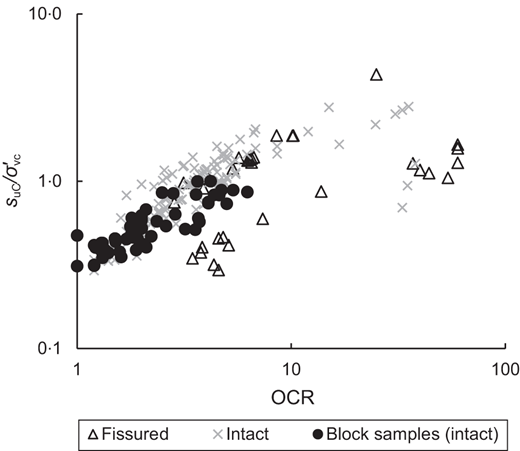
The present database includes a subset of high-quality 250 mm dia. block samples (Paniagua et al., 2019), comprising 17 sites and 61 data points, together with intact and fissured specimens from a wider range of sources, typically obtained using conventional smaller-diameter tube sampling techniques. Sample quality is a recognised source of uncertainty in laboratory determination of , particularly in sensitive, fissured or structured clays. The variable and partly undocumented sample quality across the database therefore remains a limitation that should be considered when interpreting the results. Figure 2 compares the normalised undrained shear strength ratio obtained from block samples of Norwegian sensitive clays with intact and fissured samples from onshore and offshore clay deposits worldwide. The block sample data align well with the overall trends observed in the database, while fissured samples exhibit increased scatter and, in some cases, partial deviation from the mean trend. This suggests that fissuring and associated sample disturbance may influence the reference laboratory strength in certain cases, contributing to variability in the derived cone factors. Nevertheless, the absence of a consistent offset relative to the block sample response indicates that these effects do not systematically bias the SHANSEP–CPTU relationships derived in this study.
A summary of the key properties for each selected source is given in Table 1. Descriptive statistics for the database are summarised in Table 2.
The organic content of the soils in the database is not consistently reported in the original sources, and a strict classification between inorganic and organic clays is therefore not possible. Based on the reported index properties and geological context, most deposits are considered to be inorganic. Highly organic clays and peats are thus unlikely to be significantly represented, and the applicability of the proposed framework to organic soils requires further validation.
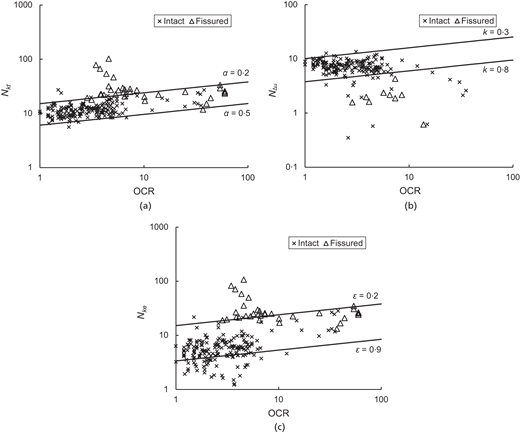
Figure 3 presents the database in terms of , and plotted against . For comparison, the SHANSEP-based predictions from equations (12) and (13) are shown for typical TXC values of and , with , k and according to literature ranges indicated in the earlier section ‘Yield stress’. The SHANSEP-based envelopes capture the overall trend of increasing cone factors with , consistent with theoretical expectations. In particular, for the literature range for α = 0·2–0·5 includes most of the data points, while the framework also reproduces the general increase of with . For the OCR relationship is less distinct, although the model captures the majority of observations for OCR < 7. This behaviour is expected, as pore pressure measurements in highly OC or fissured clays may be affected by drainage or sensor response limitations.
The values play a key role in the prediction of and therefore strongly influence the resulting cone factors and . While literature-based mean values of are adequate for database-scale analyses and for capturing general trends, calibration against site-specific values improves the reliability of the prediction whenever representative laboratory data are available.
Figure 3 also highlights that some cone factors measured in fissured clays appear as outliers relative to the mean trends. Specifically, for and (five data points), the normalised strength ratio ranges between 0·29 and 0·41. Such values typical of NC to lightly OC clays, suggesting that sample disturbance might have influenced the reference measurements.
Overall, the database highlights substantial variability in cone factors at given levels. This scatter is likely to reflect natural variability between sites, differences in piezocone equipment and sample quality, as well as the inherent simplifications of semi-empirical correlations, rather than deficiencies in data quality.
Evaluation metrics and validation procedure
Although the SHANSEP–CPTU predictions shown in Fig. 3 capture the overall increase cone factors with , the scatter in the database is significant. To assess the framework more rigorously, the comparison between predicted and observed values is expressed in terms of a bias factor , defined as the mean of the ratio of actual to predicted values, and the coefficient of variation of , defined as the ratio of the standard deviation to the mean. These metrics have been successfully used in the literature to validate transformation models for different soil parameters (Ching & Phoon, 2014; D’Ignazio et al., 2016; Di Buò et al., 2018, 2020; Selänpää et al., 2018; Löfman and Korkiala-Tanttu, 2022). The bias factor provides a measure of the systematic accuracy of the transformation model, while the associated reflects the combined influence of inherent soil variability, measurement uncertainty and model uncertainty. Thus, they provide a consistent means of quantifying both the predictive accuracy of the framework and the variability associated with CPTU-based transformations across different sites and stress histories, rather than the intrinsic variability of the soil alone.
The validation procedure was carried out as follows. The SHANSEP parameter for triaxial compression was estimated from theoretical MCC expressions, namely equation (10) for isotropic loading and equation (11) for anisotropic loading conditions. The effective friction angle was derived from CPTU data where (192/219 points) using the modified NTH solution (equations (8) and (9)). Calculated values are in the range 16–38°, with mean and . These values are in line with typical values for clays (Kulhawy & Mayne, 1990; Ouyang & Mayne, 2019). The relatively wide spread of derived values may partly reflect the presence of a significant silty component in some deposits, although detailed grain size information is not consistently available for all data points. Additional scatter is introduced by natural variability in soil properties and by uncertainty associated with CPTU-based interpretation of .
The stress-history exponent was fixed at 0·8 as a representative value for clays, consistent with a wide body of published studies. To examine sensitivity, additional analyses were performed for and , thereby covering the plausible range of reported values.
This procedure enables a systematic evaluation of how well the semi-empirical framework reproduces the observed variation of cone factors with . The bias factor and associated provide quantitative measures of model performance, while the parameter choices for and allow the influence of fundamental soil properties and stress-history assumptions to be explored.
Tables 3 and 4 present and obtained for the three cone factors , and , for both isotropic and anisotropic MCC solutions for the SHANSEP -parameter and for three exponents ( = 0·7, 0·8 and 0·9). Table 3 reports the full database (n = 192); Table 4 reports the intact clays subset (n = 182).
Across all cases, the bias factors remain close to unity (), confirming that both isotropic and anisotropic formulations reproduce the measured cone factors with negligible bias. The isotropic solution gives slightly higher mean values (1·01–1·13) than the anisotropic one (0·87–1·03), suggesting a mild overestimation of cone factors when anisotropy is explicitly introduced. The difference, however, becomes negligible when only intact clays are considered, implying that sample disturbance and soil heterogeneity, rather than inherent anisotropy, are the main sources of bias in the full dataset.
The values are consistently low (0·19–0·27 for the full dataset and 0·18–0·25 for intact clays), showing limited sensitivity to either the constitutive model assumption or the chosen SHANSEP exponent. Increasing produces only a minor increase in , with no discernible change in . The similar performance of , and indicates that all three formulations capture the stress-history dependence of the cone factors with comparable accuracy, and that a single representative expression may suffice for practical applications.
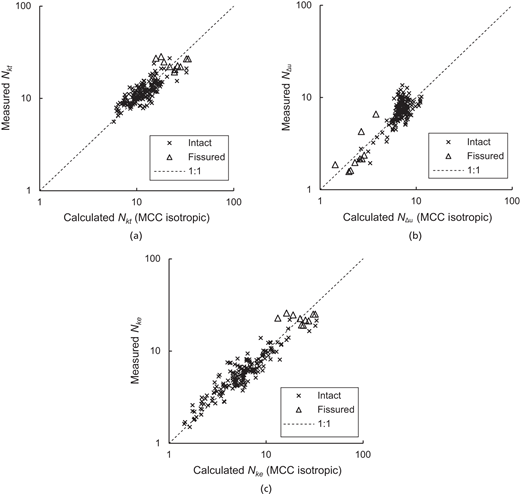
The agreement between the measured and calculated cone factors , and , obtained using the isotropic MCC solution with from equation (10) and , is shown in Fig. 4. Overall, the results indicate very good correspondence between measured and predicted values, with most data points closely following the 1:1 line. The scatter is limited and largely comparable among the three factors, confirming the internal consistency of the SHANSEP–CPTU formulation.
For and , the majority of points fall within a narrow band around the 1:1 line, while exhibits slightly greater dispersion, consistent with the higher measurement uncertainty associated with pore pressure data. Nevertheless, the overall agreement supports the robustness of the proposed framework in capturing the mean response of natural clays with good accuracy.
DISCUSSION
The results demonstrate that the CSSM–SHANSEP CPTU framework provides a rational and soil-mechanics-based means of interpreting cone factors in clays. Despite its simplicity, the framework reproduces the main experimental trends across a wide range of stress histories and soil types. The low bias and moderate scatter observed in all formulations indicate that the MCC expressions for the SHANSEP parameter are adequate to capture the average behaviour of natural clays at the database scale.
The comparison between isotropic and anisotropic MCC solutions highlights how constitutive assumptions influence interpretation. The anisotropic solution represents the stress path in triaxial compression more accurately, yet it does not significantly improve the predictive accuracy compared with the isotropic formulation. This outcome suggests that the effects of inherent anisotropy are masked by broader sources of uncertainty such as natural variability, sample disturbance and site heterogeneity. For practical purposes, the isotropic formulation captures the essential stress-history dependence with sufficient precision for design, while the anisotropic solution may be reserved for detailed numerical studies and/or site-specific modelling.
A key conceptual implication is that the proposed equations for cone factors are derived directly from the SHANSEP expression of in equation (1). Once is obtained from CPTU and, when available, oedometer data, an engineer can therefore establish a continuous profile using realistic values of and from laboratory data or literature references, without the explicit need to rely solely on fixed empirical cone factors such as , or . The framework hence generalises the conventional approach, making -values an outcome rather than an input. Conversely, it can also serve to validate empirical correlations or to detect inconsistent or disturbed data when measured and predicted factors diverge.
The coefficients of variation around 0·2–0·25 are comparable with those of empirical CPTU correlations, but are achieved here through a physically consistent formulation. The lower scatter obtained for intact clays confirms that data quality and representativeness remain the dominant sources of uncertainty. In the present study, was not measured directly, but derived from CPTU data using the Ouyang & Mayne (2019) modified NTH solution for OC clays. The good agreement between measured and predicted cone factors therefore supports the reliability of this approach. Nonetheless, future work should verify the framework against datasets where is determined independently from laboratory triaxial measurements to further assess its general validity.
Although the three cone factors , and exhibit similar bias and scatter, practical considerations often favour the use of . The cone resistance is generally more robust and less sensitive to equipment type or filter condition than the pore pressure measurement , particularly in OC and fissured clays. For this reason, the formulation is likely to provide the most consistent results when literature-based parameters are adopted, as illustrated in Fig. 3. Nevertheless, when high-quality pore pressure data are available, or can offer additional insight into effective stress changes and partial drainage effects. The choice of cone factor should therefore remain guided by data quality and the intended level of interpretation, rather than by intrinsic differences in model performance.
The limited influence of the stress-history exponent supports the use of the conventional value for general application, although structured or cemented clays may require case-specific calibration.
For a given site, the framework should preferably be applied using site-specific input parameters, as calibration of , OCR and against laboratory data improves reliability and reduces uncertainty. Where laboratory data are sparse or unavailable, the framework provides a transparent baseline prediction, while sensitivity analyses can be used to evaluate the influence of key parameters on the resulting profile and to support engineering judgement. In such cases, input parameters (for example values used in correlations) may be selected based on regional experience, geological similarity and literature-based ranges, with CPTU-based correlations primarily serving as first-order estimates or consistency checks. When available, undisturbed laboratory measurements of provide the primary reference for assessing the validity of the CPTU-based interpretation and for verifying the consistency of the derived strength profile.
The results further indicate that cone factors vary systematically with stress history and soil state, rather than being fixed empirical constants. The SHANSEP–CPTU framework provides a consistent mean of rationalising such variation, improving transparency in design and CPTU interpretation. As larger and more diverse datasets become available, particularly for glacial, structured and organic clays, the framework could be extended to capture broader behavioural trends, representing a step towards a unified interpretation of CPTU data grounded in critical state concepts.
CONCLUSIONS
This study has developed and validated a SHANSEP–CPTU framework that links cone factors in clays to fundamental soil parameters and stress history for the evaluation of undrained shear strength . The main findings are summarised below.
The CSSM–SHANSEP formulation provides a rational basis for expressing cone factors (, and ) as functions of overconsolidation ratio and effective friction angle . The resulting semi-empirical equations capture the observed increase of cone factors with across a large database of onshore and offshore clays.
Validation against independent data shows that both isotropic and anisotropic MCC solutions reproduce measured trends with low bias and limited scatter (COV 0·18–0·27). The isotropic formulation provides accuracy comparable to the anisotropic one, indicating that additional model complexity yields only marginal benefit at the database scale.
The framework is derived directly from the SHANSEP definition of and therefore allows engineers to establish strength profiles from CPTU-derived OCR values using realistic and parameters, so that cone factors become an outcome of the framework rather than fixed empirical inputs. Conversely, it can be employed to validate existing -values and to assess data quality or potential sample disturbance.
In this study, the effective friction angle was not measured directly but inferred from CPTU data using the Ouyang & Mayne (2019) modified NTH solution for OC clays. The good agreement obtained indicates that this approach is suitable for practical use, although future work should verify the framework against datasets where is determined independently from laboratory measurements.
The three cone factors , and show comparable predictive performance. However, in practice, is often preferred owing to the robustness of cone resistance measurements and their lower sensitivity to equipment and filter effects. The choice of factor should ultimately depend on data quality and project requirements.
The limited sensitivity of the results to the stress-history exponent supports the use of for general application, while structured or cemented clays may require site-specific calibration of and .
The SHANSEP–CPTU framework provides a rational alternative to fixed empirical cone factors and supports a consistent, soil-mechanics-based interpretation of CPTU data. It enables transparent parameter selection, consistent comparison across sites and a stronger theoretical link between in situ and laboratory characterisation.
Overall, the framework represents a step towards a more mechanistic interpretation of CPTU results grounded in critical-state concepts, offering both predictive and diagnostic value for the assessment of undrained shear strength in natural clays.
ACKNOWLEDGEMENTS
The authors gratefully acknowledge Professor Paul Mayne (Georgia Institute of Technology) for providing a substantial portion of the experimental data used in this study. Appreciation is also extended to colleagues and collaborators for valuable discussions during the development of this work, in particular to Knut H. Andersen (Norwegian Geotechnical Institute).
REFERENCES
Discussion on this paper closes six months after article publication; for further details see p. ii.