

The author has prepared an interesting technical note that concerns the use of pore water pressure measurements to estimate the coefficient of consolidation, Cv. The objective of this discussion is to comment on the author's analysis. The time to reach peak pore pressure is very large, of the order of t50. Information on the author's pore water pressure measuring system and the transducer's manufacturer, model number, and volume change against pressure would be useful. For example, ASTM D4186 requires the pore pressure measuring system to have volume change characteristics less than 0·000024 cubic metres per GPa (ASTM, 1997). This is to minimize the amount of water that will to go into or out of the specimen. Rowe (1965), ASTM (1997), and others recommend that a back pressure should be applied to soil specimens if pore pressure changes are to be measured. The author's specimens were made from slurry, so the saturation levels were probably high. Therefore, the measured pore water pressure, presented Fig. 2(b), which increases gradually to a peak before decaying, is probably due to water flowing into and out of the pore pressure measurement system. If this is the case, only the peak and late time pore pressure values represent no flow of water into or out of the pore water pressure measurement system. As such, measured pore water pressure before the peak underestimates the specimen's pore water pressure, and measured pore water pressure after the peak overestimates the pore water pressure. The influence of water flowing into or out of the pore pressure measuring system changes the drainage conditions at the boundary at the bottom of the soil specimen. The author appears to have assumed that the bottom of the soil specimen is an impermeable boundary.
The author uses late time pore water pressure to determine Cv by assuming a linear relationship exists between the degree of consolidation at the boundary and compression. The author states: ‘A linear relationship between Ub and the settlement was reported by Crawford (1964) for a marine clay from Ottawa.’ Crawford states in his conclusions that ‘pressure dissipates as a direct function of deflection’ for ‘pore pressures measured manually, using the Norwegian null-indicator device.’ However, Crawford also states that ‘recent tests of a similar soil (with pore pressure measurements by transducers) indicate more curvature and longer periods of pore pressure dissipation.’ Crawford simply approximated the pore pressure against settlement with a straight line. The actual date show curvature. The theoretical ratios of the average pore water pressure to the pore water pressure at the base for an external step load are not linear (Terzaghi, 1943). The ratio varies from 1 initially to 0·63 as the time factor approaches 0·3. An approximated linear relationship only exists for time factors greater than 0·3.
As such, the method presented by the author is, at best, an approximation. The large time lag in the author's pore pressure response can be reduced by back-pressure saturation and using a stiff pore water pressure measuring system. However, the assumption of a linear relationship between the degree of primary consolidation at the boundary and compression is not theoretically valid.
Author's reply
The author would like to thank the discusser for his comments on the technical note. The pore water pressure at the base of the sample during consolidation was measured using the geotechical digital system (GDS) controller. Unfortunately, the author does not have the other details about the measuring system but clearly it is a flexible measuring system. The technical note suggests a method to analyse the consolidation data when the pore pressure is recorded using a flexible measuring system, without the knowledge of the stiffness of the measuring system.
The author agrees with the discusser that measurements of pore water pressure using a stiff measuring system under backpressure saturation will reduce the time lag. One such set of experimental data, obtained using Rowe's cell, on a kaolin clay is shown in Fig. 7(a). As expected, the response of the measuring system is immediate. The corresponding degree of consolidation–settlement data is shown in Fig. 7(b). A well-defined linear relationship is obtained.
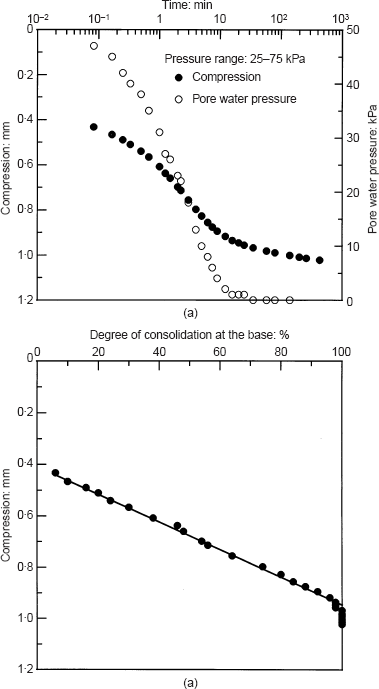
Graphs showing: (a) time-compression-pore water pressure curves for kaolinite; (b) corresponding degree of consolidation-compression plot
Graphs showing: (a) time-compression-pore water pressure curves for kaolinite; (b) corresponding degree of consolidation-compression plot
The discusser has pointed out that the theoretical ratios of the average pore water pressure (Uav) to the Pore water pressure at the base (Ub) of an external step load is not linear. But a linear relationship exists between Uav and Ub for Ub greater than about 22%, as shown in Fig. 8. Thus the linear relationship between the degree of consolidation at the boundary and compression assumed by the author is theoretically valid for Ub > 22%. However, experimental data (Fig. 7(b) show linearity much earlier than Ub = 22%.
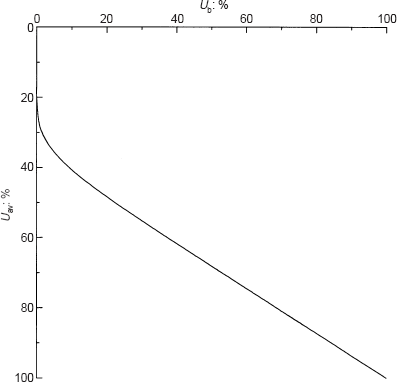
Variation of theoretical average degree of consolidation and the degree of consolidation at the boundary
Variation of theoretical average degree of consolidation and the degree of consolidation at the boundary

