

The author's interesting analysis relies on a strain-softening model developed, in part, from ring-shear experiments reported by Tika & Hutchinson (1999). However, earlier research by the writer (Lemos et al., 1985; Lemos, 1986; Lemos, 1991), with the same apparatus, identified four important features of fast shearing behaviour that were not captured in the author's model, yet would have a significant influence in a real landslide. These features are as follows:
Shear resistance increases immediately when the rate of displacement is increased. The writer considered this to be due to a combination of viscous effects in plastic clays and undrained (suppressed) dilation in more granular soils.
With more plastic clays the shearing resistance continues to increase with displacement until a peak is reached, attaining a steady state that reflects the degree of clay particle alignment permitted in the shear zone by the applied displacement rate.
Clay soils containing larger rotund particles, which show a weaker tendency for particles to align parallel to the direction of shear can exhibit drastic reductions in shearing resistance once the displacement rate exceeds a certain threshold value.
As noted by Lemos (1986) and Lemos (1991), the very low shear resistances observed at fast shear rates in the less plastic clays developed only when water was available to enter the shear zone. If the water bath surrounding the samples was emptied, no such drop was noted. Free water allows the soil within the shear zone to expand rapidly during fast shearing, wetting the clay matrix to a hyper-loose state and causing the drop in shearing resistance.
Lemos & Coelho (1991) and Lemos et al. (1994) presented a model considering most of the features referred to above in (a)–(c) to predict the final displacements of an old landslide when submitted to earthquake loading.
The author has assumed that the decrease in shear strength with displacement shown in Fig. 3 is independent of the strain rate, tending to a minimum value that is a function of the displacement rate, as shown in Fig. 4. If the features described above in (a)–(c) were considered, then the decrease in strength with displacement would be a function of the displacement rate, and consequently the sudden increase in the acceleration shown in Fig. 1 would not be effective. This would imply lower velocities, and less heat generation, so challenging the main conclusion of the paper.
Author's reply
In his discussion Professor Lemos introduces a set of empirical observations, and then goes on to speculate as to how these observations would affect our analysis, if they were included.
First, he is addressing the issue of an initial increase in shear strength: that is, from slow residual (static) to the threshold and then to the fast peak value (Tika et al., 1996). As he states, this initial increase is due to ‘viscous and suppressed-dilatancy effects’.
Undrained dilatant hardening, as it is observed in kinematically controlled experiments, should not be considered as a stabilising factor. It has been shown that undrained dilatant hardening becomes unstable at about maximum shear stress, with or without viscosity (Rice, 1975; Vardoulakis, 1985, 1986, 1996): this is known as a ‘flutter’-type instability (and Loret et al., 1997; and Benallal & Comi, 2002). A numerical simulation of a rapid shearing motion in the hardening regime could be useful in order to obtain the initial conditions for our analysis as well as the true shear-band geometry. Considering the mathematical difficulties and uncertainties, which are related to the stability of dilatant hardening and progressive strain localisation, we did not address such an initial, progressive-failure phase in our paper. Our simplified analysis starts in the softening regime, with a fully formed, non-dilatant shear band. The failure arc and the initial value for the mobilised friction (taken slightly below the limit-equilibrium value) are estimated conventionally.
The second issue raised in the discussion is related to the constitutive modelling of the clay in the fast post-peak shearing phase. It is stated that a different coupling between displacement and velocity softening will not lead to the ‘sudden increase in the acceleration’ presented in our paper, and therefore to ‘lower velocities and less heat generation’, ‘so challenging the main conclusions of the paper’.
In order to investigate the meaning and the validity of this criticism, we performed additional computations, which are run using the model presented in our paper and the set of parameters listed in Table 2 therein. With these computations (Fig. 25) we explore the validity of Professor Lemos's speculation by testing various extreme scenarios concerning the frictional softening of the clay, as his model is falling within this range. Curves (2) hold for the scenario of zero strain-rate softening. One can see that neither velocity nor heat generation becomes less significant. Curves (1) correspond to the case of a perfectly plastic soil (zero softening) show the same behaviour, and also make it clear that thermal pressurisation alone could lead to catastrophic accelerations (cf. Voight & Faust, 1982). Curves (3) correspond to the clay softening model, as discussed in our paper (weakly coupled displacement and velocity softening). (With dB = 5 mm as opposed to dB = 1·4 mm in our paper, we try to show that shear-band thickness is also not a critical parameter.) In all three cases, velocities, temperatures, heat dissipation etc. are of the same order of magnitude. Note that these computations show that suppressing partially or totally frictional softening leads, contrary to the discusser's statement, to higher frictional energy dissipation. From all three examples, case (3) is actually the least dissipative one, contrary to the claim in the discussion. As shown in Fig. 25 (a), the various models of frictional softening will in practice influence only the initial phase of the slide acceleration, by making it more or less explosive. Thus our main conclusions are not bound to the selection of a specific softening model. In our opinion the most critical parameter for the validity of such a catastrophic failure mechanism is the actual value of the pore pressure–temperature coupling coefficient.
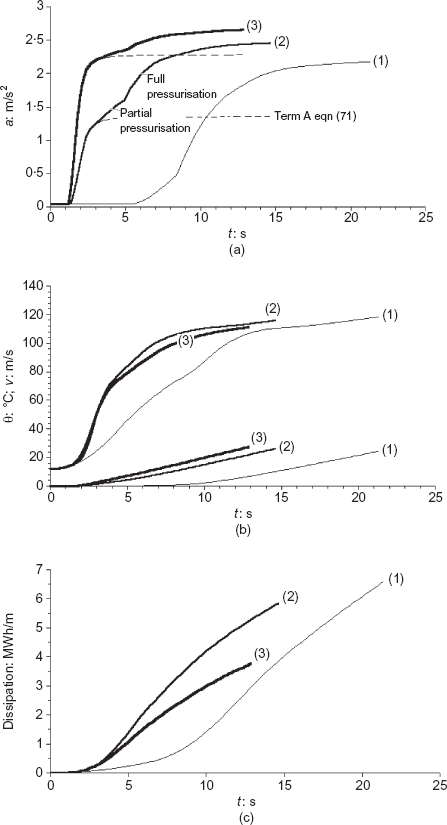
Evolution of: (a) acceleration; (b) temperature and velocity; (c) dissipation (all computations terminated at umax = R/10 ≈ 150 m; dB = 5 mm; ϕF = 22·3°). (1) Perfectly plastic limit (ϕm = 22° = const.). (2) Rate-independent limit (ϕr,stat = 12°). (3) Displacement and velocity softening (ϕr,stat = 12°; ϕr,dyn = 4·4°)
Evolution of: (a) acceleration; (b) temperature and velocity; (c) dissipation (all computations terminated at umax = R/10 ≈ 150 m; dB = 5 mm; ϕF = 22·3°). (1) Perfectly plastic limit (ϕm = 22° = const.). (2) Rate-independent limit (ϕr,stat = 12°). (3) Displacement and velocity softening (ϕr,stat = 12°; ϕr,dyn = 4·4°)

