

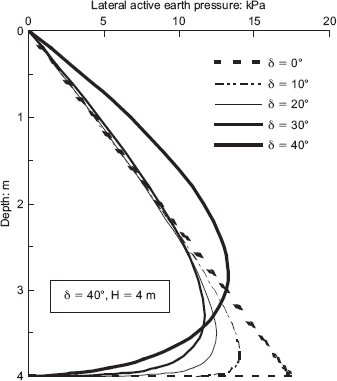
The following error was printed in the following paper: Paik, K. H. & Salgado, R. (2003). Estimation of active earth pressure against rigid retaining walls considering arching effects. Géotechnique 53, No. 7, 643–654. Figs 10 and 11 were incorrect as they appeared in the paper. Corrected versions of these two figures are reproduced below.
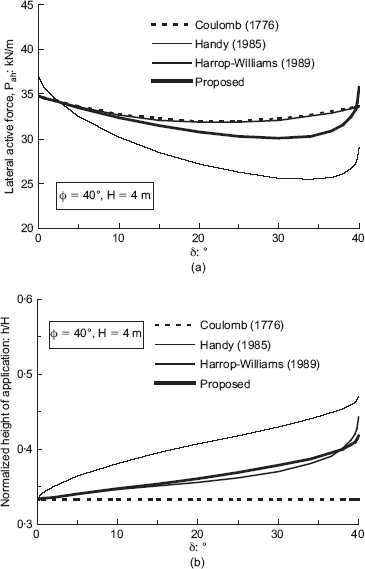
Effect of δ: (a) on lateral active force; (b) on normalised height of application of lateral active force
Effect of δ: (a) on lateral active force; (b) on normalised height of application of lateral active force
The second paragraph of the section ‘Soil–wall interface friction angle’ should read as follows.
It is seen in Fig. 11(a) that the lateral active force calculated using the proposed equation is lower than the values calculated using both the Coulomb and the Harrop-Williams formulations for values of δ less than about 39·5°. For values of δ exceeding 39·5°, the lateral active force becomes larger than the values calculated using both the Coulomb and the Harrop-Williams equations. The Handy (1985) equation gives the largest lateral active force of all four formulations for δ less than about 2·5° and the lowest of all for δ greater than about 2·5°.
Figure 11(b) shows that the height of the point of application of the lateral active force from the base of the wall, normalised with respect to wall height, increases with increasing soil-wall interface friction angle for all lateral earth pressure formulations. The proposed formulation provides slightly higher values than the Harrop-Williams equation for δ less than 37·5°, but lower values for δ greater than 37·5°. However, the normalised application height obtained from the proposed formulation is always lower than that from the Handy formulation irrespective of the value of δ.
The following errors were printed in Rocchi, G., Fontana, M. & Da Prat, M. (2003). Modelling of natural soft clay destruction processes using viscoplasticity theory. Géotechnique 53, No. 8, 729–745.
In Fig. 1 the label on the p' axis should read p'*ci0.
In Fig. 3 cae = cae/(1+e0) should read cαε = c αε/(1+e0) and cae = 0·1–0·2% should read cαε = 0·1–0·2%.
In Fig. 10, on the x axis label, pcn should read p′cn.
In Fig. 13 all instances of cae should read cαε.
In the Notation list M = 6 sin φj′cv/3-sin φ′cv should read M = 6 sin φ′cv/(3-sin φ′cv). The caption for the solid thick line should read ‘From initial portion of…’ and not ‘From final portion of…
In the Notation list p′ = σ′1+ σ′2+σ′3/3 = generic or current mean effective stress should read p′ = (σ′1+σ′2+σ′3)/3 = generic or current mean effective stress
The following error was printed in Sun, H., Chen, J. F. & Ge, X. R. (2004). Deformation characteristics of silty clay subjected to triaxial loading, by computerised tomography. Géotechnique 54, No. 5, 307–314. Fig. 14 (p. 314) should have been labeled as below.
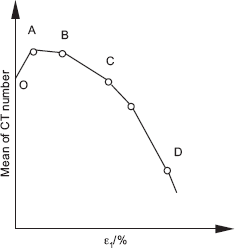
Sketch map of the whole meso process for silty clay subjected to triaxial stress: OA, initial microdefects close up; AB, new microcracks appear and develop slightly, and damage starts; BC, local deformation and damage develop quickly; CD, softening failure, and post damage (after peak value) develop rapidly
Sketch map of the whole meso process for silty clay subjected to triaxial stress: OA, initial microdefects close up; AB, new microcracks appear and develop slightly, and damage starts; BC, local deformation and damage develop quickly; CD, softening failure, and post damage (after peak value) develop rapidly
The following error was printed in Low, B. K. (2005). Reliability-based design applied to retaining walls. Géotechnique 55, No. 1, 63–75: in Fig. 7, the number 0.1 in the correlation matrix at point z2, z2, should read 1.

