


J. A. Schneider, The University of Western Australia
The authors report a much-needed, high-quality study on the increase in shaft capacity with time for relatively large-diameter open-ended driven piles in a sandy soil. This discussion compares the ‘fresh’ test results reported by the authors at Dunkirk (i.e. load tests on piles that have not previously been load-tested) with an additional long-term fresh tension test on an open-ended pile in dense North Sea sand presented by Jardine et al. (1998). Some contradictions to conclusions within the authors' paper arise from this comparison, and need clarification.
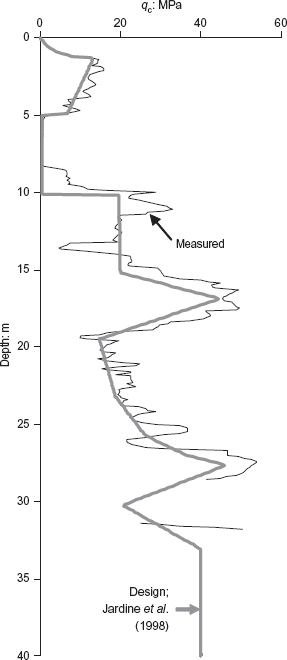
In August 1969 a tension test to failure was performed 80 days after installation on a driven conductor at the Leman BD offshore platform in the North Sea (Jardine et al., 1998). The conductor had a diameter of 0·66 m, a length of 38·1 m, and a wall thickness of 32 mm in the lower 0·76 m, owing to the presence of an internal drive shoe. Both Dunkirk and Leman BD consist primarily of dense fine sands, and both load tests were performed on open-ended steel tubes. The Leman BD conductor is slightly larger than the piles at Dunkirk, and closer to dimensions typical of offshore piles. A CPT qc profile recorded in 1969 close to the conductor location and the conservative design profile used by Jardine et al. (1998) are shown in Fig. 17. The CPT appears to meet refusal at approximately 32 m, or 6 m above the tip of the pile. Piledriving blow counts indicate that very dense sand continues to the tip of the pile. Load test results and a back-calculation of the pile capacity presented in Jardine et al. (1998) are contained in Table 5. When using the design qc profile in Fig. 17, very good agreement is achieved between the Imperial College Pile (ICP) design method and the load test results.
Measured and calculated pile capacity for Leman BD conductor pullout test at 80 days (Jardine et al., 1998)
| Tension capacity, Qs:MN | Qs ICP/Qs(t) | |
|---|---|---|
| Measured | 4·71 | – |
| Imperial College method using R* | 4·96 | 1·05 |
Figure 18 presents load test capacity normalised to that calculated using the ICP method against time for the fresh Dunkirk piles (taken from Fig. 12 of the authors' paper) as well as for the test at the Leman DB site (using calculations from Jardine et al., 1998). The ratio of Qs(t)/Qs ICP for Dunkirk to Qs(t)/Qs ICP for Leman BD at about 80 days is greater than 1·5. Although there is obviously an increase in capacity with time for the piles at Dunkirk, there does not seem to be a conservative time bias in the design method for predictions at different sites. If a time-dependent increase in shaft capacity is added onto an empirical design method formulation, an unconservative bias may be introduced into the design method.
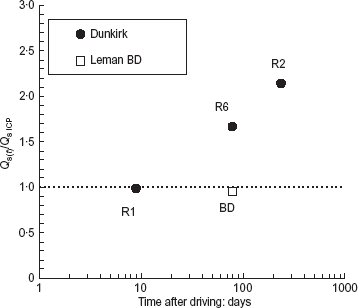
Normalised shaft capacities against time for fresh 19 m long reaction piles at Dunkirk compared with 38·1 m long conductor at Leman DB
Normalised shaft capacities against time for fresh 19 m long reaction piles at Dunkirk compared with 38·1 m long conductor at Leman DB
This discussion raises some contradictions to conclusions within the authors' paper that need clarification (the letters identify the corresponding conclusion in the authors' paper).
Although shaft capacity at a given site tends to increase with time, the capacity observed at 80 days after driving does not necessarily differ from that calculated using design procedures intended to match short-term test capacities.
When comparing pile capacity with that calculated using a design method, there does not seem to be a unique intact ageing characteristic (IAC), even for similar sand types and pile characteristics.
The ICP procedures tend to match well at Dunkirk at 10 days, but for Leman BD at 80 days. There does not seem to be a unique time associated with the ICP method. If current axial pile design methods for sands attempt to account empirically for time effects, uncertainty will increase and methods may become unconservative, although, ‘fresh’ load tests at long times after installation may result in increased design efficiency at a given site.
Authors' reply
The authors thank the discusser for an opportunity to revisit the 1969 tension load test on the Leman BD North Sea driven gas well conductor. The capacity reported by Jardine et al. (1998), for this test performed 80 days after driving, is close to that predicted by the ICP approach advocated by Jardine et al. (2005), whereas our paper indicates that, on average, ICP calculations match shaft capacities developed at an earlier stage (around 10 days). Our reply considers whether this single observation calls into question our paper's conclusions.
As emphasised by many authors, individual shaft capacity predictions for piles driven in sand are subject to considerable scatter: database assessments indicate standard deviations in Qc/Qm from around 0·3, for CPT-based methods such as the ICP, to 0·6 or higher for routine procedures such as those specified in API RP2A (e.g. Jardine et al., 2005). For example, Table 4 in our paper shows that local ground variations and slight differences in penetration depths (18·85–19·31 m) led to a range of ICP axial capacity predictions between 1270 and 1700 kN for six nominally identical piles (R1 to R6) driven in the same test area at Dunkirk. Such inherent scatter hinders the study of specific features, such as time effects, unless a systematic approach is taken to address variability in site conditions, soil parameter assessment, pile installation and test procedures. With this in mind, we performed multiple CPT tests and research-quality tests on 11 piles, all driven in a small area at Dunkirk, five of which can be considered as unambiguously ‘fresh’ piles when they were first tested to failure. Our paper's main emphasis is on the remarkably strong capacity growth with time and the new finding that ‘fresh’ piles behaved differently from those that were tested to failure more than once. We also showed that the Dunkirk pile ageing dataset is at least broadly compatible with a larger database assembled from the literature of 124 tests on sets of piles driven at various times at 12 sites; 33 of these cases could count as ‘fresh’ tests. As our figures reveal, the latter tests scatter considerably around the proposed trend lines, and the early stages of the ageing curves are open to some speculation. To find that the single Leman BD data point deviates from the trend over the first 3 months is not as significant as the discusser suggests, particularly when we recall that the Leman site's clay layer (at 5–10 m depth) introduces further uncertainty, and that the conductor tests and site investigations undertaken 37 years ago were not in accordance with modern practice.
The Leman test remains valuable as our sole North Sea sand offshore test, and it is worthwhile considering whether any additional factors might have applied that were not recognised in the earlier interpretation offered by Jardine et al. (1998). Renewed research of the archived files identified further factors of interest.
Twelve similar conductors were driven through the Leman BD well template in June 1969. Driving terminated with 10 of these at 16·8–20·1 m owing to excessive blow counts developing in a dense sand layer, whereas the test conductor, and one other, were driven to 38·1 m. The easier driving of the test conductor may indicate a lower-than-typical capacity for this installation or location.
The test conductor driving was halted for 14 h at 29·6 m to allow a new section to be welded on before driving on to 38·1 m. The pause period and re-driving may have retarded the set-up process in a similar way to the Dunkirk restrikes discussed in our paper.
The conductor load test was performed in August 1969. All 12 conductors are recorded as extending down to about 38 m penetration around one month later when gas well drilling operations commenced. Unfortunately, it is not clear when this was done, or whether 10 ten ‘refusing’ conductors had been driven on to their final depths using a more powerful hammer, or whether a drill-drive technique had been applied. The latter was the default installation method when refusals occurred; jetting was also used to assist driving in some early southern North Sea projects. If applied between driving in June and the load test in August, such operations could have affected the stress regime applying around the test conductor, reducing its axial capacity.
The conductor test included two post-failure cycles that, unlike the comparably aged Dunkirk piles, showed only a modest reduction in capacity, suggesting that only limited brittleness, and perhaps less marked overall capacity growth, had developed by the time of the first test.
Overall, our re-review identified some possible areas of uncertainty, further indicating that it may be inappropriate to read too much into the possibly slower ageing of the single Leman BD conductor case. In replying to the discusser's critique of our conclusions we recall that our paragraph (h) warned that ‘It is not certain how scale, or sand type and state, affect shaft capacity growth with time’ and our final sentence emphasised that ‘Further research into the underlying processes, their quantification and possible practical exploitation is required urgently’. The discusser's main focus is on whether a unique IAC exists and therefore on the reliability of our paragraph (j), which noted
Pile capacity calculation procedures that take no account of time will be subject to considerable error unless they consider only a tightly specified age range. In the case of the ICP procedures, the standard calculation is most likely to match field capacities in tests conducted around 10 days after installation.
We agree that caution is needed when considering taking any practical benefit from the early ageing processes; future research might also cause us to revisit the second sentence. However, we consider that this qualified statement provides a useful indicator of our current interpretation of the available data. It will certainly be difficult to predict the rate at which capacities change during the first months after driving until the underlying phenomena are better understood.
A. Corfdir and V. De Gennaro, Ecole Nationale des Ponts et Chaussées (CERMES, Navier Institute), Paris, G. Chambon, Cemagref, Grenoble
The authors present an interesting work, which gives a rich overview of and deep insights into a series of pile tests conducted in Dunkirk, France. The attention is focused on the effect of time, mainly in terms of ageing, on the bearing capacity gain of driven piles in sands.
The objective of this discussion is twofold
to integrate the in situ results presented by Jardine and co-workers with some laboratory tests results on sand/steel interfaces
to provide some hints to interpret part of the complex phenomena that have been observed by the authors.
Results provided in this discussion were obtained from tests carried out with the ACSA apparatus, a cylinder shear apparatus that allows testing of sand/steel interfaces with very large displacement by means of a rotating drum shearing the inner surface of a hollow cylindrical sample (Corfdir et al., 2004). Details of the apparatus can be found in the quoted reference, and are omitted here for the sake of space. We refer here to tests on Hostun sand under various loading paths (Chambon et al., 2006a, 2006b).
We shall focus our attention on three main points tackled by the authors in the paper
the effect of local changes in terms of shaft capacity gain
the effect of shear reversal
the effect of cycling loading.
LOCAL CHANGES AND SHAFT CAPACITY GAIN
Local rearrangement of grains has been discussed as a possible factor leading to time-reinforcing effects on the pile shaft. Results from interface tests on uniformly graded dense Hostun sand samples carried out under a constant confining pressure show that the effect of hold time on the shear stress results in an increase that could be roughly reproduced by a logarithmic law of the type
where Δτp is the difference between the post-hold peak shear stress and the average stress before the hold after a hold duration thold, and σn is the normal stress acting on the interface.
The coefficient A in equation (5) evaluated for a highly degraded interface (that is, a sand/steel interface that has undergone displacement along more than 1 m, as in piles following the driving process) was found to be 2·5 × 10−3 (Chambon et al., 2006b). If equation (5) also holds true for in situ data provided by the authors, the friction coefficient should increase by about 1·7 × 10−2 from an early pile test (i.e. one day after driving) to a pile test performed 1000 days after driving. Although qualitatively in agreement with the observed in situ trends, this is still quantitatively far from in situ measurements, and seems to suggest that non-local phenomena, possibly inducing creep arching, have to be considered to justify shaft capacity gain.
EFFECT OF SHEAR REVERSAL
If interpreted in terms of local behaviour at the interface, first tension pile tests and tests on pre-failed piles are quite different. During first tension testing, the interface is sheared upwards after a rather large downward displacement during driving. This corresponds to a ‘shear reversal’ for the interface (Fig. 19). A tension test on a tension pre-failed pile can be considered as a ‘shear unloading’ during an upward displacement. In this case the interface behaviour shows a difference even in the short term. As an example, in Fig. 20 results from tests including shear unloading and shear reversal phases are presented. As can be seen, the peak is larger when shear reversals are involved. This was observed systematically, even if the exact value of the difference was not easy to evaluate. Note that shear stress at the interface during tests with shear reversal is fully mobilised for a tangential displacement much larger than that necessary during testing involving shear unloading phases. Moreover, the softening phase is more pronounced for ‘shear unloading’ tests than for ‘shear reversal’ tests. In other words, the interface is much more brittle along a ‘shear reversal’. The same conclusion has been drawn by the authors comparing the first tension test and second tension test on a pre-failed pile.
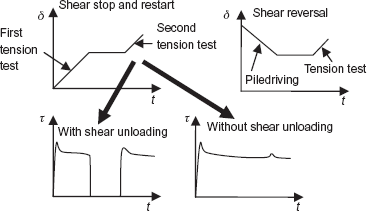
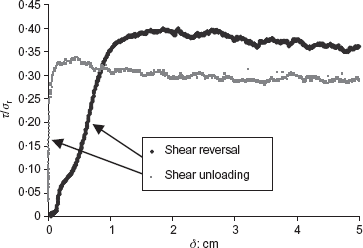
Typical results from tests with shear unloading and shear reversal (after Chambon et al., 2006a)
Typical results from tests with shear unloading and shear reversal (after Chambon et al., 2006a)
EFFECT OF CYCLIC LOADING
As far as cyclic loading is concerned, prior to the pile test it is expected that the induced volumetric changes around the pile will affect the overall pile response.
Comparing results from tests R3 and R4 (Table 3), the authors infer that pile capacity growth was probably due to the previous imposed low-level cycling, which accelerated arching creep processes. In our opinion this result most likely reflects a short-term phenomenon due to cycling compaction, rather than a ‘rapid’ creep process.
To justify this alternative point of view a typical result for a cyclic interface test performed using ACSA on a sample of dense coarse Hostun sand and rough steel is presented in Fig. 21. The shear stress curves (Fig. 21(a)) show a rapid increase at the start of shear. As can be observed, small shear amplitudes (here ±1 mm) are sufficient to induce an overall compaction of the sample (Fig. 21(b)), even if the latter was reconstituted to be rather dense at the beginning of the experiment. It is worth noting that the global compaction of the soils sample is simultaneous with consecutive phases of dilatancy and compaction (Fig. 21(b) inset). Analogous behaviour has been observed for constant-volume tests (De Gennaro & Lerat, 1999).
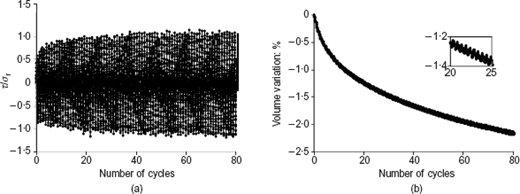
Results of cyclic test on coarse Hostun sand and rough steel: (a) shear stress; (b) volume variation (σr = 100 kPa, shear amplitude = ±1 mm)
Results of cyclic test on coarse Hostun sand and rough steel: (a) shear stress; (b) volume variation (σr = 100 kPa, shear amplitude = ±1 mm)
During the in situ test R4 in Dunkirk, cycles were applied over a 16 h period and were then followed by a tension test to failure on the following day. As a consequence, the soil/pile system experienced a rather short creep phase after cyclic testing compared with the 5 months creep period before retesting.
Comparisons of test results R3 and R4 and laboratory experiments performed with ACSA (Fig. 21) suggest that the effect of cycling is primarily reflected by the overall compaction of the zone around the pile, irrespective of its density state. Owing to the denser state, shaft capacity could possibly be enhanced by this densification process without invoking accelerated arching creep.
Authors' reply
The authors thank the discussers for providing supplementary views on the mechanisms taking place in the vicinity of the pile/soil interface. The discussers present interesting results from their cylindrical interface shear experiments, and raise three main points regarding the field observations made at Dunkirk. First, they report that ‘holding stages’ applied in their laboratory tests led to a logarithmic gain in shear capacity with time under constant normal stress. During their ageing periods the Dunkirk test piles would have sustained only the system of relatively modest residual shaft shear stresses required to resist any base loads locked in after driving, and the effects of maintained shear stresses (τ) were probably minor. It is not clear whether shear stresses were applied during the discussers' holding tests or, if so, whether the level of any such shear stress affected the discussers' parameter A.
Chow (1997) conducted four conventional direct interface shear tests on dry Dunkirk sand, the results of which are presented in Fig. 22. The samples spent up to 63 days under constant normal stress σ′n without any shear stress being applied before the final shear tests. Chow concluded that the shear resistance against horizontal displacement relationships, expressed here in terms of δ = tan (τ/σ′n), remained practically unchanged, although the older samples showed more dilation. The discussers' value of A suggests a gain in δ over 63 days of less than one degree, and a change of this magnitude might have been impossible to resolve in Chow's tests. As noted by the discussers, the pile capacity increases seen in the field developed at a much faster rate than either set of laboratory shear tests, so there must be other important in situ time-dependent processes, such as those discussed in our paper.
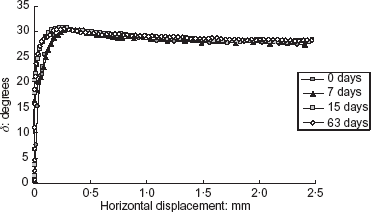
Interface shear tests by Chow (1997) on Dunkirk sand and stainless steel interface (with around 10 μm CLA roughness)
Interface shear tests by Chow (1997) on Dunkirk sand and stainless steel interface (with around 10 μm CLA roughness)
The discussers' second point concerns shear reversal effects. We agree that the associated principal stress axis rotation process is one of the factors that cause a difference between first-time compression and tension pile tests in sands; comments on this effect and the additional contribution made by ‘Poisson contraction’ are given by Jardine et al. (2005). We also note that the effects experienced by a pile shaft in situ are more acute than those developed in constant normal stress laboratory shear tests because of the constraining effects of the surrounding soil mass, particularly when the pile experiences multiple failures.
Finally, the discussers offer an alternative interpretation of the low-level cycling performed on pile R4. Their interface shear test on rough steel and coarse sand showed the interesting trend that compaction continues under cycling even with dense samples. The tests appear to involve fixed cyclic tangential displacements that lead to high mobilised values of τ/σ′n, corresponding to peak δ values of around 45°. The feature of greatest interest regarding the long-term, low-level cyclic test on R4 was that the capacity rose markedly as a result of low-level cycling, whereas other high-level cyclic loading pile tests conducted at Dunkirk led to rapid reductions in capacity. In presenting these results Jardine et al. (2005) argued that the local cyclic densification at the shaft described by the discussers combines with the constraining boundary conditions provided by the sand mass to lead to failure through marked reductions in σ′r at the pile/soil interface. These capacity reductions would take place despite the local peak δ values rising as a result of densification near the interface, as seen in the discussers' tests. It would be interesting to discover whether the discussers have conducted lower-level (stress-controlled) cyclic interface tests that might match the long-term R4 field test conditions. The latter involved 1000 cycles, with the mean shaft load and cyclic amplitude both set around 20% static capacity; the pile shaft had a CLA roughness of around 10 μm. It would be interesting to know whether significant densification or even dilation took place under these conditions; this could help to resolve whether particle rearrangement and stress changes in the soil mass away from the interface controlled the gains observed in R4's shaft resistance. As noted by the discussers, any such changes would have had to take place within a relatively short duration.

