Numerical simulation of piezocone dissipation test in clays. Géotechnique 64, No. 8, 657–666, 680, http://dx.doi.org/10.1680/geot.14.P.011. The authors are embarrassed to admit to a systematic error that affected the normalised plots of pore pressure dissipation and one of the primary conclusions from the above paper. The error was in the calculation of the value of the consolidation coefficient relevant for the various numerical analyses, where the authors had failed to take account of changes in initial void ratio, and hence also rigidity index, that resulted from varying different input parameters.
The authors would like to take this opportunity to provide corrected versions of the affected figures, and also revise the conclusion regarding the relationship between the coefficients of consolidation that result from (a) laboratory oedometric compression (cv) and (b) piezocone dissipation testing (ch).
The paper presented a relationship for ch, within the idealisations of modified Cam Clay and assuming isotropic permeability, of
where ν is Poisson's ratio; e0 is the initial void ratio; p′ is the mean effective stress; k is the (isotropic) permeability; γw is the unit weight of water; and κ and λ are the gradients for swelling and consolidation in the modified Cam Clay model. A weighting factor, α, was introduced defining the contribution of elastic and plastic behaviour, and the paper went on to argue that a value of α = 0·5 led to a unified dissipation curve as input parameters such as ν, κ and λ were varied. However, once the correct values of e0 are allowed for, it turns out that a value of α = 0·75 proves superior in order to unify the dissipation responses.
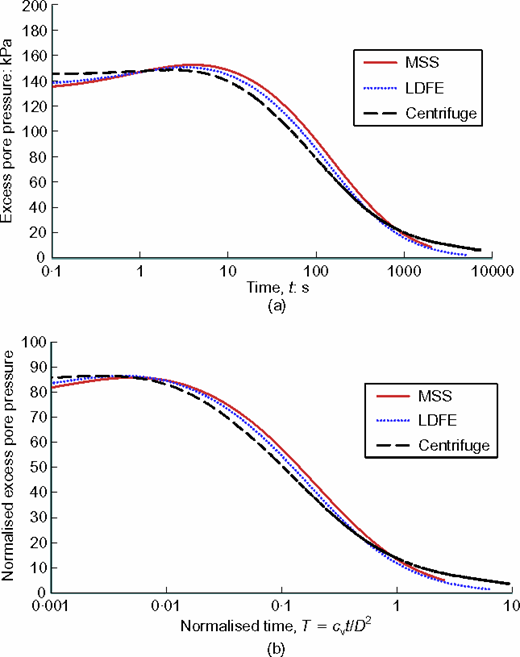
The affected figures are provided here; for completeness Figure 3(b) is also included since, although it was not affected by the error, the published version of the paper had an incorrect axis for the normalised time, T = cvt/D2, where t is the time and D is the diameter of the cone. The normalised time in the remaining figures is given by , where Ir is the rigidity index. The value of α = 0·75 implies that the dissipation response is dominated by elastic response of the soil with only minor effects of plasticity. Nevertheless, the influence of plasticity increases T*50 to about 0·08, compared with the value of 0·061 derived by Teh and Houlsby (1991).