

Contribution by J. R. Standing and B. Calderhead
The authors (Wang et al., 2014) have presented a statistical technique to facilitate the interrogation of water content profiles with depth so as to identify the lithological units of the London Clay Formation (LCF). The units were originally identified by King (1981) based on micropalaeontological evidence and the depositional facies found within the LCF (see also Royse et al., 2012). In recent years it has been realised that each of these units has strong individual physical characteristics relating to their geotechnical properties. From an engineering perspective it is therefore very useful to be able to identify and differentiate them. The authors seek to do so with the Bayesian analyses they have performed.
It might be useful to remind readers that the purpose of a Bayesian analysis in this context is to make inferences about physical quantities that are not directly measurable, based on other measurements that are more easily obtained. The Bayesian approach explicitly acknowledges the presence of uncertainty in the problem by considering the quantity of interest as a random variable. Bayes' theorem provides a mathematically consistent way of updating any prior knowledge regarding the plausible values of such quantities by defining a likelihood function that links these quantities with the data by way of a mathematical model. The result obtained is a posterior distribution, which defines the probability of the quantities of interest given the observed data. There are two key components to such an analysis.
(a) Selection of a suitable model, representing in this case how water content changes with depth. There are various approaches available, for example using change-point analysis (e.g. Fearnhead & Liu, 2007) using parametric models (e.g. a simple linear model with Gaussian noise), or non-parametric methods (e.g. using Gaussian process regression).
(b) Selection of a suitable statistical methodology for evaluating the posterior distribution, which is generally not available in closed form. Again there are various options, for example, the use of variational approximations, or exact Markov chain Monte Carlo methods (e.g. Gelman et al., 2013).
The authors' approach has been to use a simple linear model with Gaussian noise and to employ a Laplace approximation of the posterior distribution, that is, estimating the distribution using a multivariate normal distribution, which is then also used to approximate the model evidence for different proposed numbers of soil layers.
The results of the analysis will of course depend on the above choices, and it might therefore be instructive to try analysing the data using different models for comparison, to identify the most appropriate one to use, and also to investigate the error that is introduced by way of the Laplace approximation. It should be emphasised that none of these analyses is trivial and all require some form of computational code.
The St James's Park data that the authors analyse come from one of ten 40-m deep boreholes made across the park. The boreholes formed part of an investigation into why large tunnelling volume losses were observed south of the lake in the park but not north of it during construction of the Jubilee Line Extension tunnels. The intention was to ascertain whether the geology as well as the methodology used in the tunnelling influenced the volume loss values (J. R. Standing and J. B. Burland, 1999, in an unpublished report issued to London Underground Limited, entitled ‘Report on ground characterisation to explain JLEP tunnelling volume losses in the Westminster area'; also Standing & Burland (2006)). The boreholes were made in pairs from the south to the north of the park. In each pair, one borehole was for taking continuous driven U100 samples for visual observation and the other was for strength profiling using a combination of in-situ tests and laboratory tests on U100 samples taken intermittently.
In total there were about 320 U100 samples to be extruded, split and described. At the outset it was decided that taking the water content samples at a high frequency might help supplement the more subjective visual observations. Obtaining water content values is quick, straightforward and reliable, compared for example with determining Atterberg limits. When the first water content profile was produced, the usefulness of this approach was immediately evident. There had been no prior expectation and yet there were clearly defined changes, representing units within the LCF. Using these in conjunction with the observations greatly facilitated the description of the profile and those of the other boreholes. Dr Chris King came to view the laid out split samples and confirmed that the units identified based on an engineering assessment matched his units identically. The only difference was that the A3 unit was divided into two parts in the engineering description because the presence of silt and sand partings in the upper part would have a major influence on permeability and hence the consolidation characteristics of this horizon. This boundary is not readily identifiable from the water content profile except that sometimes the profile is more jagged in the upper part because of the presence of the sand and silt partings, which are not continuous and random (similar to the profile of the A2 unit at St James's Park).
The interpretation of the units was done purely by eye and confirmed by the descriptive logs made. Sub-units within unit B have been identified by King (1981) and Hight et al. (2003). The lowermost one, B1, is very silty and evidenced by a marked drop in water content. This is clearly visible in the St James's Park profiles, reproduced here in Fig. 7.
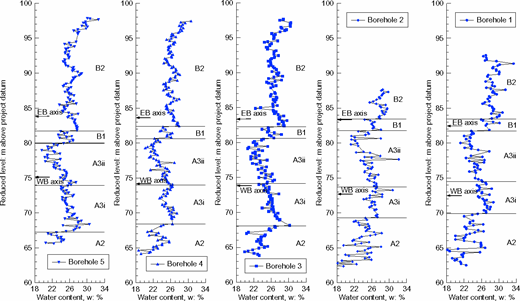
A potential benefit of the Bayesian analysis is that a more detailed investigation of the profiles might reveal patterns not identified subjectively by eye. Interestingly, the B1 unit was not identified in the analysis described by the authors, perhaps because the water content profile analysed looks as though it is from borehole 1, for which this sub-unit is not so clear. The choice of model and analysis method used may also impact the results. Given the results from the analyses, and their definitive nature, are there possibilities for identifying other hitherto unseen trends? Is it by chance that the M2 case shown in Fig. 3 has picked a boundary roughly at the interface of the A3i and A3ii sub-units? It is good that the analyses have placed the boundary between units B and A3 in Figure 3 slightly lower than that shown in Fig. 1, where the line should be slightly lower to encompass one more water content point.
The authors investigate the influence of sampling frequency and conclude that water content samples should be taken at between 0·1 and 0·3 m to define the profile sufficiently accurately. The frequency used at St James's Park was about 0·2 m, which fits well within this range. It seems that the data presented in Fig. 4 have been simulated. Would it not be possible to use the data in Fig. 1 alone and come to the same result? Are the frequencies considered starting from one point (e.g. depth of zero as marked on Fig. 4) or is this varied to start at different positions (e.g. within 0 and 0·6 m)?
The authors mention several times that gaining sufficient water content measurements at a construction site to produce a representative profile is easy to achieve. In practice it is not as easy as the authors suggest: the soil will start drying immediately after excavation (or wetting if it is raining) and even with the best will and cooperation from the site staff to gain access quickly and safely, it is difficult to take samples in this way and to know accurately the depths and locations at which they have been taken. Information from continuously sampled boreholes is much more reliable, although with rotary coring it is important to remove any drilling mud from the samples before storing them.
Authors' reply
The authors would like to thank the contributors for their interest in the paper and appreciate their general comments on Bayesian methods and the additional information they provided for the LCF and the St James's Park data. The authors agree that the Bayesian framework offers a mathematically consistent way of integrating information from various sources and it is able to extract, from the given data, additional valuable information (e.g. details on soil strata in LCF in this case) that is difficult to obtain otherwise.
One key element in the Bayesian methods is the probabilistic model that relates the observation data to the quantities of interest and properly represents the problem in hand. There are obviously many different ways of establishing such probabilistic models. It is the authors' opinion that the most suitable model should be kept as simple as possible, but at the same time, contain as much physical insight of the problem as possible. The most suitable probabilistic model tends to be problem-specific since the associated physical insight tends to be different for different problems. The authors have developed different probabilistic models for various geotechnical problems, such as characterisation of sand friction angles and soil stratum identification using cone penetration test data (Wang et al., 2010a; Cao & Wang, 2013; Wang et al., 2013). Cao & Wang (2014a, 2014b) further developed a Bayesian model comparison method to quantitatively compare various probabilistic models and to select the most suitable model for the geotechnical engineering problem in hand. It was shown that the probabilistic model with more soil mechanics insight performs better and should be used.
Another key element in the Bayesian methods, as pointed out by the discussers, is how to solve the probabilistic model for obtaining improved or updated information on the quantities of interest. Various statistical methods are available. In the soil stratum identification problems considered herein, the Laplace asymptotic approximation has been shown to perform well (Cao & Wang, 2013; Wang et al., 2013). The authors also have experience on other statistical methods, such as Markov chain Monte Carlo simulation (Wang et al., 2010b, 2011; Wang & Cao, 2013; Au & Wang, 2014; Cao & Wang, 2014a). It is the authors' opinion that the selection of solution methods should be based on the accuracy and efficiency different methods can achieve, although personal preference or experience might have considerable effect on the selection as well.
The authors wish to confirm that the water content profile (see Fig. 1) analysed in the paper is from borehole 1. The authors would also like to add that, in addition to the soil strata identified in the most probable model class (see Fig. 3), the soil strata identified in other model classes are also associated with relevant engineering significance. Wang et al. (2013) and Cao & Wang (2013) have shown that the evolution of the identified soil strata as the model class increases provides further valuable information for assisting in the data interpretation in a rational and transparent manner. The authors also wish to clarify that the data in Fig. 4 were simulated based on some statistical parameters from Fig. 1, and all data points in Figs 4(a)–4(e) start from the depth zero in the figure plus one interval considered, respectively.

