

Contribution by Y. Wang and Y. A. H. Dallo
The authors have presented a good paper with valuable information (Fonseca et al., 2014), yet the contributors here offer a simple discussion related to employing the method of Kézdi (1979) to assess the internal stability and to analyse the results of the methodology.
ABOUT EMPLOYING THE METHOD OF KEZDI
The method of Kézdi is one of the earliest methods to assess the internal stability of granular soils. It is an easy method, yet not very accurate. Li (2008) indicated that the method of Kézdi is very successful in evaluating the internal stability of gap-graded soils but the method is conservative in evaluating the internal stability of widely graded soils. Dallo et al. (2013) used Kézdi's method to assess the internal stability of data based on 47 tests, and they found there were 16 wrong predictions (34% wrong predictions) (13 of them are for continuous-graded soils while just three are for gap-graded soils). Chang & Zhang (2013) stated that Kézdi's method tends to identify stable soils as unstable, when the soil contains certain fines. Accordingly, the present contributors believe that the results obtained by the authors from tedious laboratory tests and image analysis (very accurate results) (Fig. 5 in the paper under discussion) could be correlated with an internal stability index other than that suggested by Kézdi (i.e. ), which has a questionable accuracy. A more reliable internal stability index is either (H/F)min as suggested by Kenney & Lau (1985, 1986) or (Dc35/df85)min as suggested by Dallo et al. (2013).
Because of the uncertainty associated with Kézdi's method, other methods are employed to assess the internal stability of the soils tested by the authors, namely Kenney & Lau (1985, 1986), Li & Fannin (2008) and Dallo et al. (2013) methods.
The Kenney and Lau method is an accurate one, as stated by Li (2008), Indraratna et al. (2011) and Dallo et al. (2013). The method of Li and Fannin is also accurate and has been verified against a large number of field and laboratory tests (Li et al., 2009); it is currently being evaluated for adoption in engineering practice (Semar et al., 2010). The method of Dallo et al. (2013) gives very good assessment for the data set that was tested by them. The discussion considered here employed these three methods to evaluate the internal stability of the soils tested by the authors and the results are shown in Table 4. As can be seen, all the soils, except soil G1 for the medium layer, are classified as internally stable soils according to the three methods. Soil G1 for the medium layer is classified as internally unstable according to both the Kenney and Lau and the Li and Fannin methods, while it is classified as internally stable according to the Dallo et al. method. From all these results it is possible to conclude that the three soils are internally stable.
| Soil | Internal stability assessment method | |||
|---|---|---|---|---|
| Kenney & Lau (1985) | Li & Fannin (2008) | Dallo et al. (2013) | ||
| Top | S | S | S | |
| WG | Medium | S | S | S |
| Base | S | S | S | |
| Top | S | S | S | |
| G1 | Medium | U | U | S |
| Base | S | S | S | |
| Top | S | S | S | |
| G2 | Medium | S | S | S |
| Base | S | S | S | |
Note: S: internally stable soil, U: internally unstable soil.
Based on the internal stability assessment of Kézdi's method, as shown in Fig. 5 (in the paper under discussion), it can be seen that a value of Z > 5·75 is required for internally stable soils. Following the conclusion drawn from the internal stability assessment of the Kenney and Lau, Li and Fannin, and Dallo et al. methods, the coordination number associated with internal stability cannot be obtained from the experimental tests performed by the authors. Possibly more experiments are required for soils that are classified as internally unstable according to the Kenney and Lau, Li and Fannin, or Dallo et al. methods.
ABOUT THE METHODOLOGY FOR ANALYSIS OF THE RESULTS
The authors correlate the internal stability index with the average number of contacts per soil particles expressed as the coordination number, as previously shown in Fig. 5.
To express the internal stability based on the number of contacts among soil particles, it is important to clarify the types of contacts among soil particles and the structure of the soils that undergo suffusion and internal instability problems.
There are many types of contacts among soil particles in multi-sized mixtures (Pinson et al., 1998). For a binary packing, there are several types of contacts, namely large to large (Cll), large to small (Cls), small to large (Csl) and small to small (Css) contacts. The number of each type depends on the grain size distribution of the soil (Pinson et al., 1998).
Suffusion may occur in granular materials with bimodal structure, where there are large and fine soil particles. Large soil particles are immovably fixed in their position and form the main soil skeleton, and they influence the total volume of the material. The fine particles are loosely distributed in the voids of the main soil skeleton and they do not affect the total volume of the material (Aberg, 1992). The fine soil particles may be suffused through the voids that are formed among the main soil skeleton, under the effect of seepage forces.
Based on the fact that there are many types of contacts, and there is a bimodal soil structure in the internally unstable soils, the contributors think that it is not so advantageous to correlate the average number of all contacts per particle with the internal stability behaviour of the soil. Perhaps it is more appropriate to exclude the number of Cll and Css contacts from the calculations. The larger particles are already immovably fixed in their positions and they cannot be suffused, so their number of contacts, Cll, cannot affect the suffusion process. Also, the small particles cannot be suffused without the presence of voids that are formed among the large soil particles; accordingly the number of Css may not contribute significantly to the assessment of internal stability. Since the small particles may suffuse through the voids of larger particles, the values of Cls and Csl may contribute more significantly to assessment of internal stability.
Authors' reply
The first main point raised by the discussion contributors is that other indices such as (H/F)min (Kenney & Lau, 1985, 1986) could be used to evaluate internal stability. This is correct. They note that empirical evidence from Li & Fannin (2008) suggests that the Kézdi (1979) criterion has proven to be accurate for gap-graded soils such as those tested here. Were widely graded soils to be tested, it would certainly be sensible to include an assessment according to the Kenney and Lau criterion. As well as being suited to gap-graded materials, the Kézdi criterion gives a clearer indication of the degree of instability than the Kenney and Lau method. The ratio varies systematically as materials become more gap-graded, thus it is possible to see how stable or unstable a given material is. In contrast, Kenney and Lau's (H/F)min drops sharply to almost zero once the gap ratio, > 4.
Table 5 gives the assessment of the internal stability of the micro-computed tomography (microCT) samples using both the Kézdi and Kenney and Lau (H/F)min criteria. Note that these assessments were carried out using the raw particle size distribution data and differ from the discussion contributors' assessment. Fig. 7 gives the relationship between (H/F)min and coordination number, Z. The trend is similar to that presented in Fig. 5 of the original paper (Fonseca et al., 2014); that is, (H/F)min increases with increasing Z (note that (H/F)min increases with increasing stability).
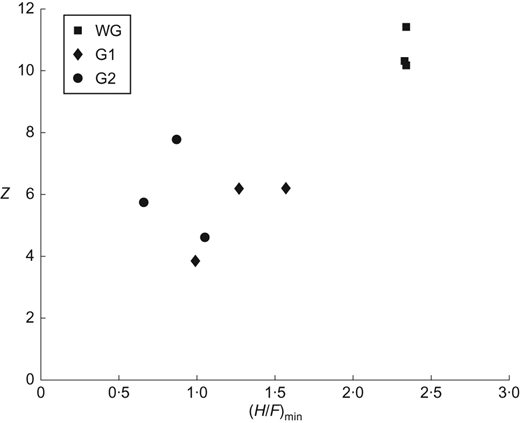
| Sample | Kézdi (1979) | Assessment | Kenney & Lau (1985) (H/F)min | Assessment |
|---|---|---|---|---|
| WG top | 1·6 | Stable | 2·34 | Stable |
| WG middle | 1·6 | Stable | 2·34 | Stable |
| WG bottom | 1·5 | Stable | 2·33 | Stable |
| G1 top | 4·7 | Unstable | 1·57 | Stable |
| G1 middle | 3·9 | Borderline stable | 0·99 | Borderline unstable |
| G1 bottom | 3·3 | Stable | 1·27 | Stable |
| G2 top | 4·0 | Borderline unstable | 0·66 | Unstable |
| G2 middle | 4·3 | Unstable | 1·05 | Borderline stable |
| G2 bottom | 4·1 | Borderline unstable | 0·87 | Unstable |
The Li & Fannin (2008) method, which is a hybrid of the Kézdi and Kenney and Lau methods validated against an extensive experimental database, does not result in a single variable representing internal instability, so, although accurate, has not been investigated as a potential proxy for soil fabric.
The discussion contributors make the point that testing of more internally unstable soils would be useful to allow a better demarcation between stable and unstable fabrics. This is also correct. However, the samples tested do allow fabric changes with level of internal instability to be studied, and the trend of coordination number, Z, increasing with increasing or falling (H/F)min is expected to be generally applicable. Development of additional suitable experimental data is non-trivial, owing to the complexity associated with interpreting the microCT data. However, the experimental data presented here are in agreement with conclusions from earlier discrete-element method simulations (Shire & O'Sullivan, 2013).
The second main point made by the discussion contributors considers the link between stability and the coordination number. They postulate that partial coordination numbers may be useful in assessing the internal stability of soil fabric. Partial coordination number data are not available for the microCT images presented here. Identifying the type of contact, namely, coarse–coarse, fine–fine or fine–coarse, requires a contact detection algorithm that identifies the grains in contact with every grain in the system, as used by Fonseca et al. (2013). This type of algorithm becomes very computationally expensive in the case of soils containing a large number of fine grains, as exhibited by the gap-graded samples. In the present study, the contacts were obtained from the watershed image-processing algorithm employed to separate or segment the contacting grains. The contacts correspond to the watershed boundaries and information on the specific grains associated with a given contact is not available. For this reason, the partial coordination numbers cannot be calculated for the microCT data.
However, the variation of partial coordination numbers with internal stability has been considered in numerical discrete-element method analysis by Shire et al. (2014a). They found that the fine coordination number Zfine (the average number of contacts each fine particle has with particles of any size) generally increased with the stress transmitted through the finer particles (and therefore with increasing stability). In addition, Shire et al. (2014b) found that a coarse to coarse coordination number Zll ≥ 4 indicates that a load-carrying matrix of coarse particles has formed.
In the context of the paper under discussion, the data from Shire et al. (2014a) have been reanalysed to give the relationship between Kézdi's and the coarse to fine and fine to coarse coordination numbers considered by the discussers, Zls and Zsl, respectively, as shown in Fig. 8. These data have been generated from discrete-element method simulations with varying density and fines content. In Fig. 8(a) it can be seen that for any given density and fines content Zsl reduces with . This is unsurprising because as the coarse to fine diameter ratio increases, each fine particle is less likely to make contact with a coarse particle. A dependence on relative density and finer material content, Ffine, can also be observed. With increasing density Zsl increases. For the loose samples Zsl also increases with Ffine. However, for the medium dense and dense samples Zsl reaches its maximum at Ffine = 30% and 25%, respectively. These correspond approximately to the critical fines contents at which the fines just fill the voids between the coarse particles for medium dense and dense samples, as discussed by Shire et al. (2014a). In Fig. 8(b) it can be seen that, for the medium dense samples and the dense samples, Zls increases rapidly with as the ratio between coarse and fine diameters increases. However, this is not observed for samples with Ffine = 18% and for loose samples with Ffine ≤ 30%, as these samples fall below the critical fines content discussed by Skempton & Brogan (1994). These results highlight the observation of Shire et al. (2014a) that an analysis of internal stability would, as a minimum, require consideration of , Ffine and relative density.
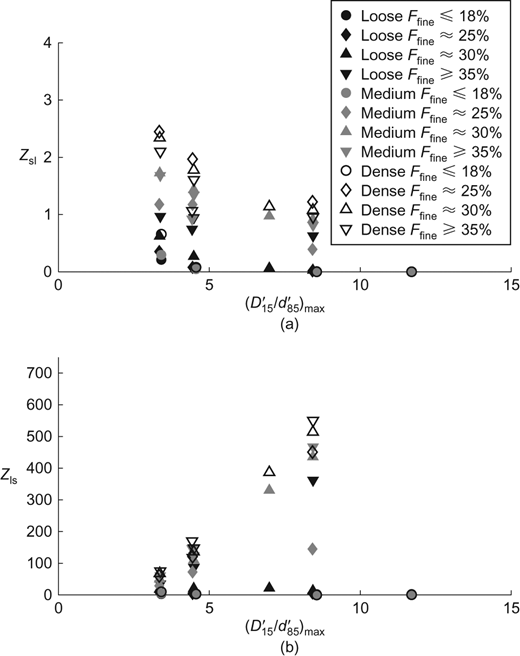
Relationship between Kézdi (1979) and partial coordination numbers: (a) fine–coarse coordination number, Zsl; (b) coarse–fine coordination number, Zls. Data taken from Shire et al. (2014a)
Relationship between Kézdi (1979) and partial coordination numbers: (a) fine–coarse coordination number, Zsl; (b) coarse–fine coordination number, Zls. Data taken from Shire et al. (2014a)
NOTATION
- Cll, Cls, Csl, Css
number of contacts, large to large particle, large to small particles, small to large particles and small to small particles, respectively
- Dc35
constriction diameter corresponding to 35% finer
diameter of coarse fraction corresponding to 15% finer
diameter of finer fraction corresponding to 85% finer
- df85
diameter corresponding to 85% finer of the fine particles
- F
finer percent corresponding to a grain size diameter D
- H + F
finer percent corresponding to the particle diameter 4D
- Z
coordination number

