


This study presents two methods of producing an insoluble biopolymer − microbially induced biopolymer formation (MIBF) and enzyme-induced biopolymer formation (EIBF) − and explores their ability to reduce hydraulic conductivity and cause bioclogging in soil from pore to column scales. The batch experiments confirm that insoluble polysaccharidic biopolymers, dextran, are successfully produced either by the model bacteria or by the extracted cell-free enzyme. The results show that the EIBF method is more efficient in producing biopolymer and reducing hydraulic conductivity compared to the MIBF method. This study also uses microfluidic chips, which reveals the pore-filling behaviour of biopolymers produced by both methods. EIBF produces larger dextran flocs than MIBF, and hence EIBF lowers the hydraulic conductivity more than MIBF for a given pore occupancy of dextran. Column experiments demonstrate that both MIBF and EIBF can significantly lower the hydraulic conductivity of coarse sands by two orders of magnitude with only 3% biopolymer pore saturation. The presented results suggest that both methods have the potential to induce well-controlled, engineered bioclogging in coarse-grained soils, and have applications in various geotechnical practices, such as sealing leakage in water-front structures, installing hydraulic barriers and mitigating soil erosion.
INTRODUCTION
The concentration of microorganisms per kilogramme of soil near the ground surface exceeds 109 to 1012 (Mitchell & Santamarina, 2005). This diverse community includes all types of bacteria, archaea and eukarya. Among these, bacteria stand out as the most abundant, and bacteria can produce various byproducts, such as biofilms, extracellular polymeric substances (EPS), biominerals and biogases. Accordingly, the utilisation of microbial activities in subsurface engineering practices has garnered a huge interest as the formation of microbial products within pores can impact soil properties, including strength, stiffness and hydraulic conductivity (e.g. Ivanov & Chu, 2008; DeJong et al., 2010; Cunningham et al., 2014; Phillips et al., 2016; Choi et al., 2020). Particularly noteworthy is the phenomenon known as bioclogging, where microbial activities and byproducts substantially reduce the hydraulic conductivity of porous media, such as soils and rocks (Kim & Fogler, 2000; Dunsmore et al., 2004). Bioclogging presents challenges in areas related to fluid flow through pipes and membranes, such as in wastewater treatment. However, it is worth mentioning that there are intriguing proposals to leverage engineered bioclogging as a potential solution in various applications, such as soil erosion mitigation, enhanced oil recovery, hydraulic barrier installation in the subsurface, soil bioremediation and leakage sealing in water-front earth structures (e.g. Vogel, 1996; Stewart & Fogler, 2001; Kalin, 2004; Ivanov, 2006; Ham et al., 2018; Kim et al., 2019; Kim & Kwon, 2022).
Engineered bioclogging in the subsurface can be achieved through bacterial activity or cell-free enzyme reactions. Stimulating the growth of specific microbial species and by-product production by way of biostimulation or introducing proven bacteria for bioaugmentation can achieve bioclogging. However, challenges may arise in adapting to new environments or fine-grained soils with limited bacterial growth (England et al., 1993; Mitchell & Santamarina, 2005; Rebata-Landa & Santamarina, 2006). Some countries restrict new species introduction to protect ecosystems (van Elsas et al., 1998; Murphy & Ginn, 2000; Kavazanjian & Hamdan, 2015). Alternatively, cell-free enzyme reactions offer an effective approach to induce bioclogging when bacterial activities are restricted. Enzymes in aqueous solutions can easily be introduced in the subsurface, their transport controlled by advective flows, and their reactions less impacted by indigenous microorganisms. There is ongoing research on enzyme-induced calcium carbonate precipitation (EICP) for improving soil mechanical properties (Hamdan & Kavazanjian, 2016; Lin et al., 2016; Almajed et al., 2018).
Among soft biomasses, the insoluble bacterial biopolymer has shown remarkable effectiveness in reducing the permeability of porous media (e.g. Lappan & Fogler, 1996; Kwon & Ajo-Franklin, 2013; Noh et al., 2016; Ta et al., 2017; Kim et al., 2019). One such example is dextran, an insoluble polysaccharidic biopolymer produced by Leuconostoc mesenteroides, which exhibits long-term stability and retains its clogging effect even under nutrient-poor conditions (Kim et al., 2019). In contrast, certain biomasses such as biofilms and cells are easily removed by water flows and degrade in nutrient-depleted environments (Taylor & Jaffé, 1990; Hand et al., 2008; Kim & Kwon, 2022). Previous studies have investigated bioclogging caused by bacteria in soils (e.g. Cunningham et al., 1991; Seifert & Engesgaard, 2007; Abdel Aal et al., 2010; Zhong et al., 2013; Zhong & Wu, 2013; Xia et al., 2016); however, there is currently no research on utilising enzymes to produce soft biomasses and induce bioclogging in soils. In addition, the impact of bacterial cells on biopolymer formation patterns and bioclogging behaviour remains poorly examined.
Understanding bioclogging requires insight into how biopolymer forms and grows at a pore scale. Scanning electron microscopy (SEM) has been widely used for this purpose (e.g. Choi et al., 2020; Won et al., 2021; Kim & Kwon, 2022). However, SEM requires pretreatment, which can disturb the sample and lacks continuous and in situ monitoring during microbial growth. Meanwhile, microfluidic chips have been used for real-time monitoring of microbially induced calcium carbonate precipitation (MICP) (Wang et al., 2019a, 2019b; Kim et al., 2020). Surprisingly, despite various advantages, microfluidic chips have not been used to study enzyme-induced biopolymer formation and visualise internal processes in transparent models with controlled pore geometry.
The present study explores microbially induced biopolymer formation (MIBF) and enzyme-induced biopolymer formation (EIBF) and their ability to reduce hydraulic conductivity and cause bioclogging in soil across multiple scales from batch to column scale. Emphasis is on using extracted cell-free enzymes for biopolymer formation, in particular, ‘dextransucrase’ extracted from L. mesenteroides NRRL B-523 (ATCC 14935; Jeanes et al., 1954), which synthesises the biopolymer ‘dextran’ from sucrose. First, batch culture experiments determine optimal conditions for insoluble dextran production and its formation kinetics. Second, microfluidic chip experiments investigate pore-scale biopolymer formation patterns and bioclogging mechanisms in MIBF and EIBF. Third and last, column experiments compare the extent and rate of hydraulic conductivity reduction of coarse sands caused by MIBF and EIBF methods.
MATERIALS AND METHODS
Materials
Model bacteria
In this study, L. mesenteroides strain NRRL B-523 (ATCC 14935) was chosen as the model bacterium for both the MIBF and EIBF treatments (see Fig. S1 in the online supplementary material). L. mesenteroides has been widely used in bioclogging experiments in soils because of its versatile characteristics (e.g. Lappan & Fogler, 1996; Kwon & Ajo-Franklin, 2013; Noh et al., 2016; Ham et al., 2018; Kim et al., 2019). As a facultative anaerobe, it thrives in anoxic conditions, posing no harm to humans (biosafety level 1). In addition, its growth kinetics are well identified (Martinez-Espindola & Lopez-Munguia, 1985). One of its most significant attributes is the production of the enzyme dextransucrase when fed with sucrose, enabling the synthesis of substantial amounts of the insoluble polysaccharidic biopolymer, dextran (Neely & Nott, 1962).
Dextran is a glucose-based polysaccharide (D-glucans (C6H10O6)n) with a significant proportion of consecutive α-1 and α−6 glycosidic linkages in its major chains, typically comprising over 50% of the total linkages (Naessens et al., 2005). The exact structure varies with the microbial strain producing it. Originally found as a food thickener, dextran was also used in synthetic blood plasma substitutes for clinical uses. Dextran can be synthesised from sucrose by dextransucrase enzymes secreted by Leuconostoc, Streptococcus and Lactobacillus species (Naessens et al., 2005). Accordingly, dextran exhibits a wide range of properties, including solubility and viscosity, which are mainly dependent on the polymer chain length and molecular structure. L. mesetenroides B-523, chosen in this study, is known to produce insoluble dextrans, particularly class 3 dextrans, owing to their high α(1,3)-linkage content. In this study, visible gel-like dextran slimes were observed within 24 h, owing to their low aqueous solubility (see Fig. S1 in the online supplementary material). Hydrolysis of dextrans requires a temperature higher than 70°C and extremely acidic pHs of less than 2, and the dextrans are generally stable at pHs greater than 4 and ambient temperature (Karthikeyan et al., 1996; Iqbal et al., 2017).
Preparation of enzyme solution
Figure 1 illustrates the process of extracting the enzyme dextransucrase from a bacterial culture of L. mesenteroides. To initiate each extraction, a frozen stock was resuscitated and pre-cultured with no shaking at 30°C for ∼24 h. The pre-cultured inoculum was then aseptically transferred to the enzyme production medium at a 1 : 40 volumetric ratio (2·5% v/v). The enzyme production medium consisted of 10 g/l yeast extract, 20 g/l sucrose, 40 ml/l of 1 M monobasic potassium phosphate (KH2PO4), and 60 ml/l of 1 M dibasic potassium phosphate (K2HPO4) to culture the model bacteria and stimulate the enzyme production (see Table S1 in the online supplementary material). The pH of the solution was adjusted to 6·9, which is optimal for bacterial cell growth and enzyme production (Santos et al., 2000).
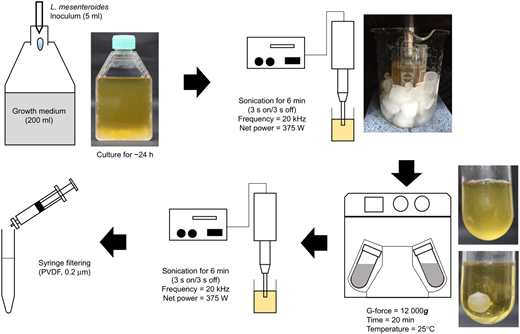
After ∼24 h of incubation at 30°C in the enzyme production medium, the inoculum was sonicated for 6 min (375 W, 20 kHz) under a run-cool cycle and then centrifuged at 12 000 r/min for 15 min at 25°C. This process yielded extracellular dextransucrase while bacterial cells and extracellular polymeric substrates (EPS) were removed in the pellets. The supernatant was repeatedly sonicated under the same run-cool cycle, and was then filtered with a hydrophilic polyvinylidene fluoride (PVDF) syringe filter (0·2 μm) to ensure the removal of bacterial cells. The resulting supernatant, containing biomass-free, dissolved dextransucrase, was designated as ‘the enzyme solution’. Throughout the experiments involving the enzyme solution, fresh enzyme solution was used immediately after extraction to minimise enzyme activity degradation.
Batch experiment programme
In EIBF, insoluble dextran forms when the extracted enzyme solution is mixed with a sucrose solution. The Fourier-transform infrared spectroscopy analysis confirmed that this EIBF approach produced insoluble biopolymers, dextran (Text S1 and Fig. S2 in the online supplementary material). The sucrose solution is easily prepared by dissolving pure sucrose in deionised water at predetermined concentrations. To determine the optimal conditions for EIBF with the extracted cell-free enzyme solution, a series of batch tests was conducted. The main test variables were the mixing ratio between the enzyme solution and sucrose solution (E/S ratio) and the sucrose concentration. The mass of the dextran produced was then compared to evaluate the enzyme reaction. Through these experiments, in this study the optimum E/S ratio was identified as 0·2–0·5 and the optimum sucrose concentration as 40 g/l. This range resulted in a sufficient amount of dextran yield while maintaining resource efficiency with the enzyme solution and sucrose. Further details on the batch experiment programme, methods and results can be found in the online supplementary material (Text S2, Table S2, Table S3, Fig. S3, Fig. S4).
The dextran formation kinetics were assessed under the determined optimum condition: sucrose concentration of 40 g/l and an E/S ratio of 0·5. The enzyme solution (13·3 ml) was mixed with 60 g/l sucrose solution (26·7 ml). Thereafter, the dextran produced was separated and washed by centrifugation at predetermined intervals until 72 h had elapsed. The sucrose-to-dextran conversion ratio from EIBF was calculated as the mass ratio of dextran produced to sucrose consumed, measured at 72 h of elapsed time. For comparison, MIBF batch experiments were also conducted twice with a final sucrose concentration of 40 g/l. In the second MIBF batch test (MIBF-batch 2), the amounts of sucrose consumed and dextran produced, and the cell density were monitored over time, and the sucrose-to-dextran conversion ratio was estimated. All the batch experiments were performed in triplicate.
Pore-scale experiment programme using microfluidic chips
The microfluidic chip experiments allowed pore-scale examination of the patterns of biopolymer formation with different mechanisms (EIBP and MIBF) and their effect on changes in the hydraulic conductivity of porous media over time.
Microfluidic chip specification
Pore-scale experiments utilised two-dimensional (2D) transparent microfluidic chips (Microfit, South Korea) fabricated with polydimethylsiloxane (PDMS; Sylgard 184, Dow Corning, NY, USA) following the standard fabrication methods (Hassanpourfard et al., 2014). Figs 2(a)–2(c) depict the detailed geometric configurations of the microfluidic chips used in this study. The chip contained circular pillars with a diameter of 150 μm, arranged in a triangular pattern with uniform-sized pore throats of 30 μm. This pore geometry closely resembles a sand pack with an effective diameter (D10) of 150–300 μm as the pore size is generally in the range 10–20% of D10. Two types of chips were used in this study: a large microfluidic chip (14 mm long, 7 mm wide, aperture height of 50 μm and internal volume of 1·324 μl) to monitor the biopolymer formation patterns in the EIBF and MIBF methods, and a small microfluidic chip (7·14 mm long, 3·6 mm wide, aperture height of 25 μm and internal volume of 0·298 μl) to track evolutions of biopolymer saturation and hydraulic conductivity.
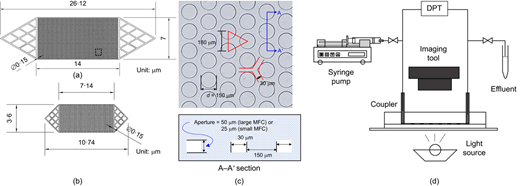
Geometry of the microfluidic chips used in this study: (a) the large microfluidic chip; (b) the small microfluidic chip; and (c) the detailed geometry of the chips. Note that part (c) shows an enlarged image of the dotted square in part (a). (d) A schematic diagram of the microfluidic chip test set-up (drawn not to scale). DPT indicates the differential pressure transducer. A 1 mm thick lower PDMS without a pattern was attached to the slide glass, and a 3 mm thick upper PDMS with an etched channel pattern was then overlapped on the lower PDMS
Geometry of the microfluidic chips used in this study: (a) the large microfluidic chip; (b) the small microfluidic chip; and (c) the detailed geometry of the chips. Note that part (c) shows an enlarged image of the dotted square in part (a). (d) A schematic diagram of the microfluidic chip test set-up (drawn not to scale). DPT indicates the differential pressure transducer. A 1 mm thick lower PDMS without a pattern was attached to the slide glass, and a 3 mm thick upper PDMS with an etched channel pattern was then overlapped on the lower PDMS
Microfluidic chip test set-up and programme
Figure 2(d) displays the experimental set-up of the microfluidic chip. The top view was captured using either optical microscopy or a high-resolution digital camera. A syringe pump (Standard Infuse/Withdraw PHD Ultra Syringe Pump, Harvard Apparatus, MA, USA) provided a continuous flow of fluids at constant rates. To avoid air bubble intrusion and fluid leakage at high pressure, 1/16 inch (1·59 mm) Tygon tubing was connected to 23G stainless steel coupler. All experiments used newly fabricated chips to prevent cross-contamination.
Table 1 lists the test cases for the microfluidic chip experiments. The EIBF method used the enzyme−sucrose solution (E/S solution) with an E/S ratio of 0·5 and a final sucrose concentration of 40 g/l. The prepared E/S solution was injected until full saturation through the outlet to avoid introducing dextran formed outside and to minimise clogging near the inlet. After injection of the E/S solution, the flow was stopped for ∼6 h to prevent instant wash-off of floating enzymes. Subsequently, a 40 g/l sucrose solution was continuously injected from the inlet until either no more biopolymer formation occurred or the fluid could no longer be injected due to pore clogging.
Programme for microfluidic chip experiments
| Run | Mechanism | Chip type | Sucrose concentration: g/l | Flow rate, Q: nl/min | Flow velocity, v: mm/min | Time required for 1 PV sweeping: min | Reynolds number, Re |
|---|---|---|---|---|---|---|---|
| MIBF_L_su40 | MIBF | Large MFC | 40 | 318·5 | 6·64 | 4·16 | 10 |
| MIBF_S_su40 | Small MFC | 40 | 133·2 | 8·36 | 2·24 | 10 | |
| MIBF_S_su160 | Small MFC | 160 | 133·2 | 8·36 | 2·24 | 10 | |
| EIBF_L_su40 | EIBF | Large MFC | 40 | 318·5 | 6·64 | 4·16 | 10 |
| EIBF_S_su40 | Small MFC | 40 | 133·2 | 8·36 | 2·24 | 10 |
For comparison, the MIBF treatment was implemented in microfluidic chip experiments. L. mesenteroides were cultured in a glucose-based growth medium (Table S2 in the online supplementary material), similar to the enzyme production medium but with glucose instead of sucrose to prevent dextran formation in the bacterial inoculums. After ∼12 h of cultivation, the cell pellet was collected by centrifugation at 13 500 r/min for 10 min. The cell pellet was then re-suspended in a sucrose-based growth medium with a sucrose concentration to 40 g/l (see Table S2 in the online supplementary material). This bacterial solution was injected from the outlet until fully saturated, preventing the introduction of cells and dextran from the tubing, while fresh medium was supplied through the inlet. A retention time of ∼6 h was given for bacterial cells to attach to the chip surface with no mass flux. Upon cell attachment, the sucrose-based growth medium with a sucrose concentration of 40 g/l was injected from the inlet.
The aim of the large microfluidic chip test cases (MIBF_L_su40 versus EIBF_L_su40) was to observe the difference in biopolymer formation mechanisms between EIBF and MIBF. The small microfluidic chip test cases (MIBF_S_su40 versus EIBF_S_su40) were designed to track the changes in biopolymer pore saturation during continuous fluid injection over time. The flow rates in the small and large chips were 0·1332 μl/min and 0·3185 μl/min, respectively, and both correspond to a Reynolds number of 10 (Table 1). Variations in hydraulic conductivity due to biopolymer accumulation were estimated by measuring the pressure difference between the inlet and outlet using a differential pressure transducer (DPT; PX409, Omega Engineering Inc., Norwalk, CT, USA). In addition, one case with a small microfluidic chip implemented MIBF with an increased sucrose concentration to 160 g/l (MIBF_S_su160). The chip experiments continued until the pore occupancy reached a pseudo-steady state. All experiments were performed at room temperature and atmospheric pressure conditions.
The experiments with the large microfluidic chip utilised an optical microscope with 40× and 100× magnifications to capture local images within the chip. In contrast, the experiments with the small microfluidic chip used a high-resolution digital single-lens reflex camera (Canon EOS 100D, Tokyo, Japan) equipped with a 100 mm micro-lens (Canon 100 mm 2·8f macro lens, Tokyo, Japan) to acquire whole microfluidic chip images in a single frame. Digital photographs were taken every 10 min to monitor the biopolymer formation patterns and pore occupancy.
Pore occupancy was calculated by dividing the number of biopolymer pixels by the number of pore pixels, and the area of individual biopolymer flocs was assessed by using ImageJ. Note that this approach provides only an apparent indicator of the biopolymer formation rate because the biopolymer may not occupy the entire aperture height and the density of the accumulated biopolymer may vary between pixels. Further details regarding the image analysis procedure for estimating pore occupancy and dextran floc size can be found in the online supplementary material (Text S3).
Column experiment programme
Host sand
In column experiments, coarse sand (Ottawa 20/30, U.S. Silica, Frederick, MD, USA) was used as the host sand. This coarse sand had the grain size range of ∼0·6–0·85 mm with the mean grain size of 0·72 mm. Fig. 3(a) shows the grain size distribution curve of the sand used in this study.
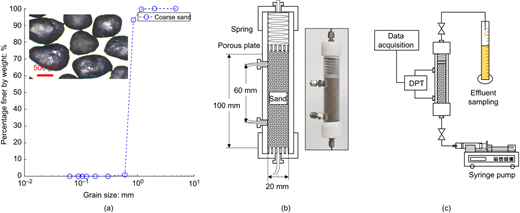
(a) Grain size distribution of the coarse sand used for column experiments; (b) schematic diagrams of the column; and (c) the column experiment set-up
(a) Grain size distribution of the coarse sand used for column experiments; (b) schematic diagrams of the column; and (c) the column experiment set-up
Column experiment set-up and procedure
The column experiments used a polycarbonate column with a diameter of 20 mm and a height of 140 mm (Figs 3(b) and 3(c)). Two pressure ports on the column wall were used to measure the pressure difference (ΔP) with a differential pressure transducer (DPT; PX409, Omega Engineering Inc., Norwalk, CT, USA). The pressure difference during fluid injection was logged using a data acquisition unit (34970A, Keysight Technologies, Santa Rosa, CA, USA). Hydraulic conductivity K was determined based on Darcy's law using the measured pressure difference ΔP, assuming a laminar flow.
The coarse sand was oven-dried for ∼24 h at 110°C after autoclaving at 121°C for 120 min. Subsequently, the sand was water-pluviated in the polycarbonate column to minimise air bubble entrapment in the pores. Column preparation methods and refiling strategies differed with the dextran production mechanisms (MIBF and EIBF). For MIBF columns, water-pluviation used L. mesenteroides inoculum cultured for ∼24 h. For EIBF columns, water-pluviation used the E/S solution with a E/S ratio of 0·5 and a final sucrose concentration of 40 g/l. The final porosity after pluviation was in the range of 0·38–0·40, and the initial hydraulic conductivity was measured as 3–4 × 10⁻⁴ m/s.
After preparing the sand column, a retention time of ∼3–4 days was allowed for biopolymer formation through MIBF or EIBF. Subsequently, the refilling process was repeated every 3–4 days, with 60 ml of the refilling treatment solution injected at a flow rate of 1 ml/min. The sand pack in the column had a pore volume of approximately 12·5 ml, and the refilling volume was about 4–5 times the pore volume. For EIBF columns, the subsequent refilling also used the cell-free E/S solution with a E/S ratio of 0·5 and a final sucrose concentration of 40 g/l. Note that the subsequent treatment injections always included the newly extracted enzymes because of the loss of enzymic activity over time and the displacement of aqueous enzymes by refilling flows. For MIBF columns, 60 ml of the refilling treatment solution was injected, which contained 10 g/l of yeast extract, 40 g/l of sucrose, 40 ml/l of 1 M monobasic potassium phosphate and 60 ml/l of 1 M dibasic potassium phosphate (see Table S2 in the online supplementary material). The refilling lasted approximately 60 min and no mass flux condition was maintained until the next refilling – that is, pulsed mode. During the refilling process, the pressure gradient was measured for a given flow rate, and the hydraulic conductivity was computed using the measured pressure gradient and Darcy's law.
In this study, six column experiments in total were carried out, as outlined in Table 2. The first two MIBF runs (MIBF_R1 and MIBF_R2) were conducted under atmospheric pressure conditions with no additional back-pressure to assess test result reproducibility. As the microbial fermentation of sucrose in MIBF produces carbon dioxide (CO2) gas (Kim et al., 2019), these runs were inevitably affected by gas bubble nucleation. In the following MIBF runs (MIBF_R3 and MIBF_R4), an additional back-pressure of 300 kPa was applied to increase carbon dioxide solubility in water and hence minimise bubble nucleation. In MIBF_R4, the sucrose concentration was increased fourfold from 40 g/l to 160 g/l to compare clogging efficiency with EIBF. Two EIBF runs were also conducted to verify the reproducibility. All the column experiments were performed at room temperature of ∼24°C.
Column experiment programme and results summary
| Test case | Mechanism | Sucrose concentration: g/l | Back-pressure: kPa | Testing period: days | Initial porosity | Initial hydraulic conductivity K0: m/s | Final hydraulic conductivity Kf: m/s | Reduction ratio |
|---|---|---|---|---|---|---|---|---|
| MIBF_R1 | MIBF | 40 | 0 | 64·1 | 0·40 | 3·9 × 10−4 | 8·9 × 10−6 | 0·023 |
| MIBF_R2 | 40 | 0 | 77·4 | 0·38 | 3·4 × 10−4 | 1·2 × 10−6 | 0·004 | |
| MIBF_R3 | 40 | 300 | 67·4 | 0·38 | 3·5 × 10−4 | 4·5 × 10−6 | 0·013 | |
| MIBF_R4 | 160 | 300 | 38·2 | 0·39 | 3·6 × 10−4 | 5·4 × 10−6 | 0·015 | |
| EIBF_R1 | EIBF | 40 | 0 | 49·2 | 0·38 | 3·2 × 10−4 | 4·6 × 10−6 | 0·014 |
| EIBF_R2 | 40 | 0 | 38·4 | 0·39 | 3·6 × 10−4 | 4·8 × 10−6 | 0·013 |
All the column tests were conducted with the coarse sand packs at a pulsed mode of refilling, where 5 PV (or 60 ml) of the refilling solutions were injected at an interval of 72–96 h. The reduction ratio is defined as the ratio of the final hydraulic conductivity to the initial hydraulic conductivity – that is, Kf/K0.
Estimation of biopolymer saturation from effluent analysis and SEM imaging
Sucrose consumption between refilling indicates the amount of dextran produced in the sand columns. In three column experiments (MIBF_R2, MIBF_R3 and EIBF_R1), the sucrose concentration in the effluent fluid during refilling was measured using a standard colorimetric assay kit (Abcam, Cambridge, UK). The mass of the biopolymer produced can be estimated based on the sucrose mass consumed and the sucrose-to-dextran conversion ratio for EIBF and MIBF. These ratios were obtained from the batch experiments (the later section ‘Sucrose-to-dextran conversion ratio in EIBF and MIBF’ provides details).
Biopolymer pore saturation Sbp is estimated as the ratio of biopolymer volume to pore volume, assuming the biopolymer density as 1·5 g/cm3 based on literature values (Noh et al., 2016). Note that the biopolymer saturation estimation for MIBF_R2 takes into account the pore fluid volume displaced by biogenic gas generation. A detailed procedure for estimation of biopolymer saturation from effluent analysis is provided in the online supplementary material (Text S4).
After completing the experiments, the morphology of the biopolymers produced by MIBF and EIBF was examined using SEM images. Sand grains associated with the dextran produced were first collected when the columns were dismantled. These dextran-associated sand grains were then imaged using field-emission SEM (FE-SEM; SU8230, Hitachi, Japan) after platinum coating. The detailed protocol for sampling and preparing sand grains for SEM imaging is provided in the online supplementary material (Text S5).
RESULTS AND ANALYSIS – BATCH EXPERIMENT
Kinetics of dextran formation
Figure 4(a) shows the variation in dextran production with time through MIBF and EIBF mechanisms. The batch was cultured for more than 72 h to ensure the completion of dextran formation. The EIBF batch experiment was conducted under the optimum condition with a sucrose concentration of 40 g/l and an E/S ratio of 0·5. The result shows a dextran mass of ∼0·229 g out of 1·6 g of sucrose in 40 ml of the E/S solution. The EIBF reaction took approximately 60 h to complete dextran production. In comparison, the MIBF batch experiments were performed twice at a sucrose concentration of 40 g/l. The MIBF reactions completed in approximately 36–50 h, indicating earlier dextran formation. The final dextran mass formed by MIBF was ∼0·112–0·151 g out of 1·6 g of sucrose in the solution, which is significantly less than that of EIBF.
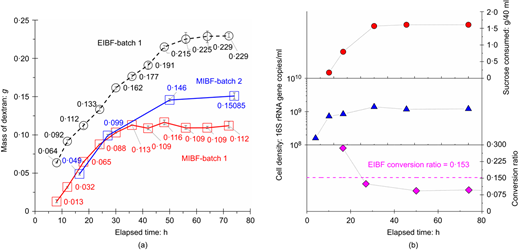
(a) Variations in dextran masses produced with the cell-free enzyme solution (EIBF-batch 1) and by the bacterial cells (MIBF-batch 1 and MIBF-batch 2) with time. The error bar shows a small standard deviation among the triplicate measurements. (b) Variations in sucrose consumed, cell density and sucrose-to-dextran conversion ratio of test MIBF-batch 2. Note that the final sucrose concentration and the enzyme-to-sucrose ratio were 40 g/l and 0·5, respectively. All batches were cultured at room temperature
(a) Variations in dextran masses produced with the cell-free enzyme solution (EIBF-batch 1) and by the bacterial cells (MIBF-batch 1 and MIBF-batch 2) with time. The error bar shows a small standard deviation among the triplicate measurements. (b) Variations in sucrose consumed, cell density and sucrose-to-dextran conversion ratio of test MIBF-batch 2. Note that the final sucrose concentration and the enzyme-to-sucrose ratio were 40 g/l and 0·5, respectively. All batches were cultured at room temperature
Sucrose-to-dextran conversion ratio in EIBF and MIBF
In particular, the latter two batch experiments (EIBF-batch 1 and MIBF-batch 2), which lasted 72–74 h, assessed the sucrose-to-dextran conversion ratio and the mass ratio of dextran produced to sucrose consumed, as shown in Fig. 4(b). Both EIBF and MIBF used nearly all the initial sucrose (1·6 g) within 3 days, with the final sucrose consumptions of 1·4 g for EIBF-batch 1 and 1·6 g for MIBF-batch 2. The sucrose-to-dextran conversion ratio is estimated to be 0·153 for EIBF and 0·085 for MIBF. EIBF demonstrated a dextran yield and conversion ratio approximately twice that of MIBF. This implies significant sucrose utilisation by bacteria for their growth and activity.
Interestingly, when comparing the cell growth curve, sucrose consumption and dextran yield from MIBF-batch 2 (Fig. 4), it reveals that the most exponential cell growth occurred within 20 h, followed by an increase in dextran yield from 10 h to 50 h. As the mass of dextran was measured as the sum of bacterial cell mass and dextran mass, the high conversion ratio in the early stage of MIBF before 20 h had elapsed was likely to be attributable to cell mass rather than dextran mass. These sucrose-to-dextran conversion ratios are used to estimate the dextran content (ratio of dextran mass to sand mass) and/or dextran pore saturation (ratio of dextran volume to pore volume) in the column experiments by measuring remaining sucrose concentrations in the effluents.
RESULTS AND ANALYSIS – PORE-SCALE MICROFLUIDIC CHIP EXPERIMENT
Visual observation of biopolymer formations by MIBF and EIBF
The large microfluidic chip experiments confirm that bacterial cells or extracted enzyme can produce insoluble dextran in porous media, as shown in Figs 5 and 6. Fig. 5 displays time-lapsed images captured during MIBF. Bacterial cells were first introduced during inoculation (Fig. 5(a)). When the fluid flow stopped for ∼6 h, bacterial cells started to attach to the micromodel's surface, forming colonies (Fig. 5(b)). Upon fresh nutrient injection, the fluid flow washed out some attached bacterial cells, while the bacterial colonies that resisted the flow continued to grow and produce dextran (Fig. 5(c)). Some bacterial colonies surrounded by the biopolymer detached and flowed downstream. With continuous nutrient inflow, biopolymer growth plateaued after approximately 46 h (Figs 5(d)–5(f)).
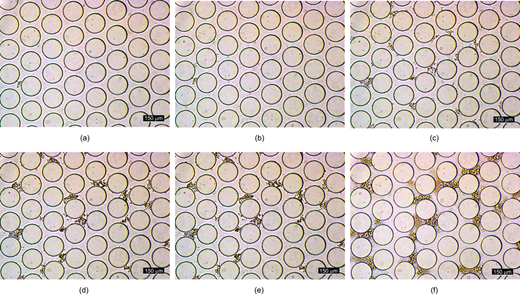
Time-lapse images of dextran formation induced by bacterial cells in a large microfluidic chip (case MIBF_L_su40): (a) 0 h, (b) 5·32 h, (c) 12·65 h, (d) 20·42 h, (e) 40·18 h and (f) 51·2 h elapsed after cultivation
Time-lapse images of dextran formation induced by bacterial cells in a large microfluidic chip (case MIBF_L_su40): (a) 0 h, (b) 5·32 h, (c) 12·65 h, (d) 20·42 h, (e) 40·18 h and (f) 51·2 h elapsed after cultivation
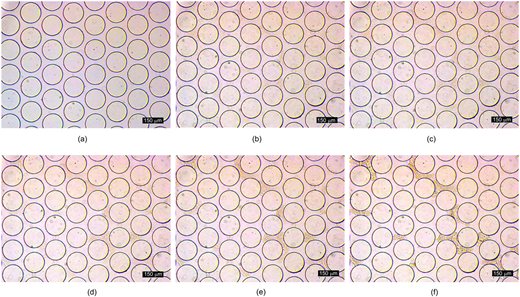
Time-lapse images of dextran formation induced by the extracted cell-free enzyme solution in a large microfluidic chip (case EIBF_L_su40): (a) 0 h, (b) 6·6 h, (c) 6·8 h, (d) 7·5 h, (e) 8·0 h and (f) 22·1 h elapsed after cultivation
Time-lapse images of dextran formation induced by the extracted cell-free enzyme solution in a large microfluidic chip (case EIBF_L_su40): (a) 0 h, (b) 6·6 h, (c) 6·8 h, (d) 7·5 h, (e) 8·0 h and (f) 22·1 h elapsed after cultivation
Figure 6 shows the time-lapsed images of the microfluidic chip during EIBF. The microscopic image in Fig. 6(a) confirms the removal of bacterial cells as a result of sonication and syringe filtering. The initial biopolymer started to form ∼6 h after injection of the E/S solution (Fig. 6(b)). The biopolymers produced by MIBF appeared grey and dark under the microscope light due to the presence of bacterial cells, whereas the biopolymers produced by EIBF were relatively light in colour. The dextran gradually grew over time and occupied the pore space (Figs 6(b)–6(e)). After about 22 h, the accumulated dextran content became almost stagnant (Fig. 6(f)).
Evolution of biopolymer pore saturation
The phases of biopolymer flocs were segmented from optical images captured at the end of each small microfluidic chip experiment through image analysis, as shown in Fig. 7. Pore occupancy by the biopolymer produced in the micromodel can be estimated from these segmented images. Fig. 8 shows the evolutions of pore occupancy by biopolymer in the three experimental runs with small microfluidic chips. The final pore occupancy was 8·4% in MIBF_S_su40, 37·0% in MIBF_S_su160 and 32·6% in EIBF_S_su40. This highlights the higher efficiency of the EIBF method in biopolymer production compared to MIBF when the same amount of sucrose is supplied. Consequently, EIBF yields a greater amount of biopolymers occupying larger pore volumes than MIBF. This is consistent with the authors’ earlier batch test results.
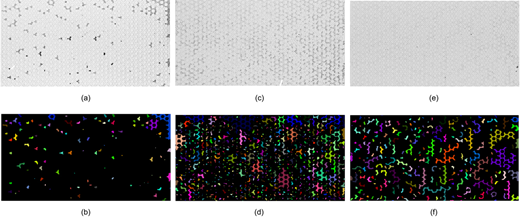
Image analyses on distributions of dextran clusters: (a) the raw image and (b) processed image from MIBF_S_su40; (c) the raw image and (d) processed image from MIBF_S_su160; and (e) the raw image and (f) processed image from EIBF_S_su40. The images are taken at the end of the experiments. A full-colour version of this figure can be found on the ICE Virtual Library (www.icevirtuallibrary.com)
Image analyses on distributions of dextran clusters: (a) the raw image and (b) processed image from MIBF_S_su40; (c) the raw image and (d) processed image from MIBF_S_su160; and (e) the raw image and (f) processed image from EIBF_S_su40. The images are taken at the end of the experiments. A full-colour version of this figure can be found on the ICE Virtual Library (www.icevirtuallibrary.com)
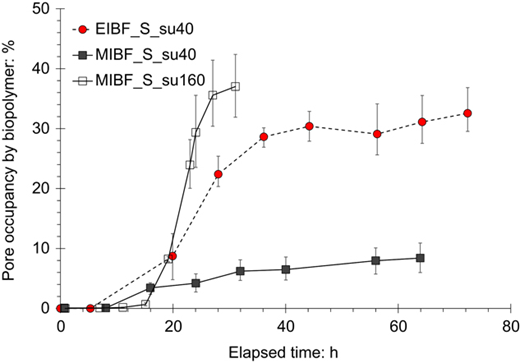
Variations in pore occupancy of biopolymer with time in the small microfluidic chip experiments
Variations in pore occupancy of biopolymer with time in the small microfluidic chip experiments
Sizes of biopolymer flocs produced: MIBF compared against EIBF
The segmented images allow an assessment of the distribution and geometric characteristics of dextran flocs, as shown in Fig. 9. The floc areal size and effective diameter follow lognormal distributions. In MIBF_S_su40, the occupied area ranges between 500 and 20 000 μm2 with a median value of 5985 μm2. MIBF_S_su160 exhibits a wider range, from 200 to 30 000 μm2 with a median value of 1777 μm2. In contrast, in EIBF_S_su40, the majority of the biopolymer flocs fall between 2000 and 50 000 μm2 with a median value of 10 976 μm2. Flocs smaller than 5000 μm2 account for ∼21·2% of the total area occupied by biopolymers in MIBF_S_su160, but only 3·19% in EIBF_S_su40. Moreover, a few large flocs (>200 000 μm2) in EIBF_S_su40 occupy more than 10·8% of the total area occupied by biopolymers. As expected, the mean effective diameter of the biopolymer flocs in EIBF is greater than those in MIBF. Thus, the statistical analysis reveals that EIBF produces larger dextran flocs than MIBF.
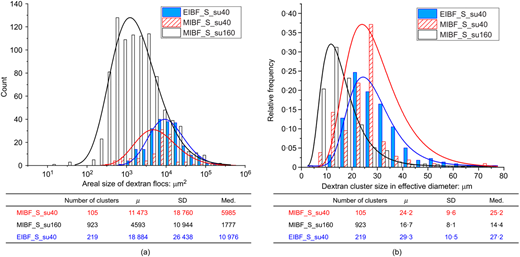
Effect of dextran formation mechanism on dextran floc size: (a) areal size distributions of dextran flocs and (b) distributions of dextran flocs in the effective diameter. Inset tables show the statistical parameters for the log-normal distributions: μ is the mean, SD is the standard deviation and Med. is the median value. The effective diameter of each dextran floc was estimated from the floc volume (i.e. occupied area times aperture height) by assuming a spherical shape of a dextran floc. A full-colour version of this figure can be found on the ICE Virtual Library (www.icevirtuallibrary.com)
Effect of dextran formation mechanism on dextran floc size: (a) areal size distributions of dextran flocs and (b) distributions of dextran flocs in the effective diameter. Inset tables show the statistical parameters for the log-normal distributions: μ is the mean, SD is the standard deviation and Med. is the median value. The effective diameter of each dextran floc was estimated from the floc volume (i.e. occupied area times aperture height) by assuming a spherical shape of a dextran floc. A full-colour version of this figure can be found on the ICE Virtual Library (www.icevirtuallibrary.com)
In addition, an increase in sucrose concentration in MIBF promotes the production of more but smaller dextran flocs, particularly those smaller than 5000 μm2 in area or 50 μm in effective size. The number of biopolymer flocs was 923 when the sucrose concentration was 160 g/l (MIBF_S_su160), and it decreased to 105 when the sucrose concentration was 40 g/l (MIBF_S_su40). In contrast, EIBF_S_su40 produced 219 flocs (Fig. 9). Case MIBF_S_su160 yielded the highest number of flocs.
Hydraulic conductivity reduction in microfluidic chip: MIBF compared against EIBF
The result shown in Fig. 10(a) indicates that EIBF was more effective in reducing hydraulic conductivity than MIBF. A dextran pore occupancy of 30% in MIBF reduced the hydraulic conductivity by ∼90% or one order of magnitude. By contrast, the same pore occupancy in EIBF led to a ∼99% reduction or two orders of magnitude. This difference in bioclogging efficiency was attributable to the size of biopolymer flocs. EIBF produced larger flocs that could partly block pore throats by bridging the pillars owing to their large size (e.g. EIBF_S_su40 in Fig. 10(b)). In contrast, MIBF produced smaller flocs that were often too small to effectively occlude pore throats, leaving main flow channels unclogged (e.g. MIBF_S_su160 in Fig. 10(c)). This is consistent with the result reported by Dai & Seol (2014), where larger hydrate clusters caused a greater reduction in medium permeability compared to smaller hydrate clusters at the same level of hydrate saturation.
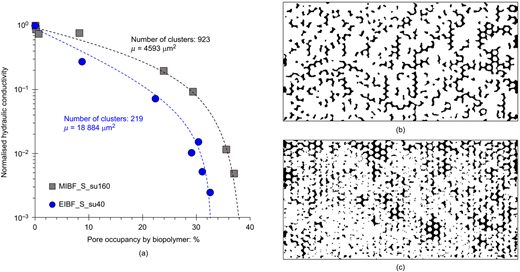
(a) Changes in the normalised hydraulic conductivity with respect to the pore occupancy by dextran; (b) distribution of dextran formed in case EIBF_S_su40; (c) distribution of dextran formed in case MIBF_S_su160
(a) Changes in the normalised hydraulic conductivity with respect to the pore occupancy by dextran; (b) distribution of dextran formed in case EIBF_S_su40; (c) distribution of dextran formed in case MIBF_S_su160
RESULTS AND ANALYSIS – COLUMN EXPERIMENT
Scanning electron microscopy imaging results
Figure 11 shows the SEM images of sand grains from the column tests treated with MIBF and EIBF. The images from MIBF highlight that the bacterial colonies of L. mesenteroides thrived on grain surfaces with dextran formation (Figs 11(a)–11(c)). However, in samples from EIBF, bacterial cells were not observed, while a dextran patch covered the sand grain surface (Figs 11(d)–11(f)). This provides visual evidence that insoluble dextran biopolymer was successfully synthesised with cell-free enzyme in the absence of bacterial cells.
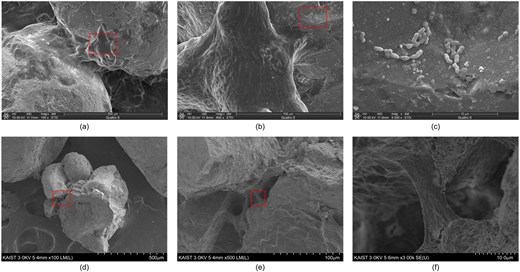
SEM images of sand grain surfaces sampled from (a), (b), (c) MIBF_R2 and (d), (e), (f) EIBF_R1. The highlighted rectangular regions are enlarged in the next figures
SEM images of sand grain surfaces sampled from (a), (b), (c) MIBF_R2 and (d), (e), (f) EIBF_R1. The highlighted rectangular regions are enlarged in the next figures
Column experiment results – hydraulic conductivity K reduction
A series of column experiments explored the feasibility of using EIBF for engineered bioclogging and compared its bioclogging efficiency with MIBF. Fig. 12(a) shows the variation in hydraulic conductivity K of coarse sand treated with EIBF and MIBF. Table 2 summarises the results of all the column tests. The initial hydraulic conductivity K0 was approximately 3–4 × 10⁻⁴ m/s, and it decreased to 10−6–10−5 m/s in all tests. Both EIBF and MIBF treatments caused significant K reductions, although the reduction rates differed with mechanisms and conditions. In MIBF with 40 g/l sucrose concentration and without back-pressure (MIBF_R1 and MIBF_R2), K stayed fairly consistent for the first 20 days (5–6 times of refilling), and thereafter it drastically decreased to less than 10−5 m/s after 50 days (12–14 times of refilling). The application of back-pressure in MIBF_R3, however, facilitated a more consistent and gradual K reduction owing to the suppression of biogenic gas generation. This observation is consistent with the previous study by Kim et al. (2019). In addition, an increase in sucrose concentration (MIBF_R4) led to the fastest reduction in K due to the increased dextran yield, dropping K down to ∼2–4 × 10⁻⁶ m/s within 16 days (5 times of refilling).
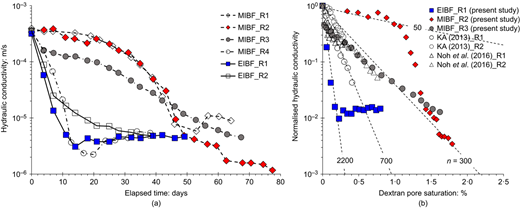
Variations in (a) hydraulic conductivity of coarse sands treated with bacterial cells and enzymes with time. ◊ (⧫) MIBF without back-pressure at sucrose concentration of 40 g/l; ● MIBF with back-pressure at sucrose concentration of 40 g/l; ○ MIBF with back-pressure at sucrose concentration of 160 g/l; ■ (□) EIBF without back-pressure at sucrose concentration of 40 g/l. The power exponent n denotes the Archie's saturation exponent, which implies the extent of pore clogging and the level of permeability reduction by biopolymer. A greater n value indicates a lower K/K0 and the greater reduction in hydraulic conductivity
Variations in (a) hydraulic conductivity of coarse sands treated with bacterial cells and enzymes with time. ◊ (⧫) MIBF without back-pressure at sucrose concentration of 40 g/l; ● MIBF with back-pressure at sucrose concentration of 40 g/l; ○ MIBF with back-pressure at sucrose concentration of 160 g/l; ■ (□) EIBF without back-pressure at sucrose concentration of 40 g/l. The power exponent n denotes the Archie's saturation exponent, which implies the extent of pore clogging and the level of permeability reduction by biopolymer. A greater n value indicates a lower K/K0 and the greater reduction in hydraulic conductivity
The EIBF treatment caused faster K reduction compared to MIBF with the same sucrose concentration. EIBF achieved a K reduction by two orders of magnitude (or 99%) in approximately 15–30 days and 4–8 refillings, while MIBF required more than 50 days and more than 14 refillings with 40 g/l sucrose concentration. In addition, EIBF's clogging efficiency was almost equivalent to MIBF with 160 g/l sucrose concentration. The column test results prove the effective clogging capability of EIBF in coarse sands, achieving the greater dextran yield with fewer nutrient resources compared to MIBF at a centimetre-scale, upscaled from microfluidic chip experiments.
Some column experiments (MIBF_R4, EIBF_R1 and EIBF_R2) suggest a lower limit in K reduction by insoluble dextran at ∼2–4 × 10⁻⁶ m/s, which falls in the range for silty sands. This is presumably due to dextran detachment during the refilling solution injection, where the constant flow rate caused an increase in seepage velocity, leading to more detachment. As a matter of fact, the hydraulic gradient increased approximately from 0·1 to 10 by 100 times as K decreased by approximately two orders of magnitude. One possible explanation is that the K reduction was levelled off as the new production and wash-out of dextran became balanced. Furthermore, the porous structure of pore-filling insoluble dextran also can act as a lower limit for effective medium hydraulic conductivity. Dreszer et al. (2013) have reported that extracellular polymeric substances (EPS) in biofilms have a very low hydraulic conductivity in the order of 10−11–10−8 m/s. Kapellos et al. (2007) have also reported that the permeability of biofilms depends on both the permeability of the EPS matrix and the porosity of the biofilms. Lowering flow rate while keeping the hydraulic gradient constant during refilling might yield a different lower limit.
Effect of biopolymer pore saturation on hydraulic conductivity K reduction: comparison with previous MIBF studies
The K reduction rate due to inclusion materials can be quantitatively assessed using the normalised hydraulic conductivity K/K0 with respect to the quantity of inclusion in porous media – that is, biopolymer pore saturation Sbp. The biopolymer pore saturation Sbp was estimated based on the sucrose consumed from effluent analysis and by using the sucrose-to-dextran conversion ratio of 0·153 for EIBF and 0·085 for MIBF, which were obtained from the batch experiments. Fig. 12(b) shows that, in all cases, K/K0 decreased to less than 0·01 (or >99% K reduction) with less than 3% biopolymer pore saturation Sbp. EIBF demonstrated more effective reduction in K compared to MIBF, which aligns well with the pore-scale microfluidic chip experiment results.
In addition, MIBF results from previous studies (Kwon & Ajo-Franklin, 2013; Noh et al., 2016) are superimposed in Fig. 12(b) for comparison. In those studies, the refilling solutions with 15 g/l sucrose concentration were injected while the biogenic gas generation was suppressed with a back-pressure of ∼300 kPa. The biopolymer pore saturation values from those studies were re-calibrated with the sucrose-to-dextran conversion ratio measured in this study. It was found that the K reduction trends in literature data are consistent with the MIBF_R3 result, in which all of them applied a back-pressure. Accordingly, both the previous literature and the current results confirm the consistent K reduction trend of MIBF as a function of biopolymer saturation.
Comparison with analytical hydraulic conductivity model
Analytical models such as Kozeny grain models or capillary tube models are widely used to predict the K reduction caused by inclusion in porous media (e.g. Kleinberg et al., 2003; Dai & Seol, 2014; Noh et al., 2016; Baek et al., 2019). In both EIBF and MIBF, microfluidic chip experiments show that insoluble dextran fills pores without coating solid walls. Following this observation, the present study adopts the Kozeny pore-filling model (KPFM) to correlate the measured K reduction with biopolymer saturation: K/K0 = (1 − Sbp)n+2/(1 + S0·5bp)2. The power exponent n in KPFM represents Archie's saturation exponent, which implies the extent of pore clogging and the level of permeability reduction caused by biopolymer. The greater n value indicates the lower K/K0 and the more significant reduction in hydraulic conductivity.
The analytical modelling shows that all the experiment results as well as the previous study results fall within the range of KPFM predictions drawn with n values from 50 to 2200 (Fig. 12(b)). An exponent n of ∼1–2 gives a trend similar to the general Kozeny−Carman model, while an exponent n higher than 10 indicates a significant pore clogging behaviour. Both MIBF and EIBF demonstrate the potential for intentional bioclogging in soils. Between them, the MIBF treatments with minimal gas generation cause K reductions with an exponent n of 300–700. By contrast, the EIBF treatment results in much faster K reduction in coarse sand with less biopolymer saturation, where the exponent n is approximately 2200. This again confirms the superior efficiency of EIBF in bioclogging compared to MIBF.
In contrast, precipitation and formation of inorganic minerals, such as calcium carbonate (CaCO3), are known to reduce soil hydraulic conductivity. For MICP, the K reduction trend follows the Kozeny grain-coating model with a power exponent n of 2–6 (Baek et al., 2022; DeJong et al., 2022), while abiotic carbonate precipitation follows the model with n of 5–11 (Baek et al., 2019). Although the nature and longevity of the materials produced differ, formation of soft and viscous biopolymers reduces K at a significantly faster rate compared to calcium carbonate minerals. It is because the insoluble biopolymers in water exist as a form of a porous matrix composed of entangled polymeric filaments and sheets, which results in a much larger effective volume (or apparent volume) for clogging compared to the actual volume.
Field-scale engineered bioclogging design eventually requires groundwater flow modelling coupled with bio-chemical reaction for injection strategy design and clogging location prediction. Meanwhile, it is worth pointing out that the KPFM model does not capture the lower limit in K, although some of the column experiment results (e.g. MIBF_R4, EIBF_R1 and EIBF_R2) indicate the presence of the lower limit at ∼2–4 × 10⁻⁶ m/s. By contrast, the other column results (e.g. MIBF_R2 and MIBF_R3) showed gradual K reductions with no distinctive asymptote. When the lower limit in K is present, it is suggested to restrict the use of KPFM to specific regimes where K gradually decreases with biopolymer accumulation before reaching its asymptotic value. Alternatively, analytical models with asymptotes, such as the colonies model and biofilm model (Thullner et al., 2002; Newcomer et al., 2016) could be considered. As these models also require an additional parameter related to the relative porosity or minimum (or lower bound) permeability (or hydraulic conductivity), further research on the minimum K for bioclogging caused by insoluble biopolymer accumulation in soils is needed.
IMPLICATIONS FOR FIELD-SCALE IMPLEMENTATION OF ENGINEERED BIOCLOGGING
In this study, the authors peer into the enzymatic and bacterial biopolymer formation mechanisms and their impact on hydraulic conductivity from a pore scale to a column scale. Here, the implications for field-scale implementation of engineered bioclogging using MIBF and EIBF treatments are discussed.
Competition with indigenous microbial community
The field application of the MIBF and EIBF treatments unavoidably involves introducing nutrients into subsurface environments already inhabited by a diverse indigenous microbial community. This raises a concern about competition for nutrients between the introduced and native bacteria/enzymes. Two main strategies, bio-augmentation and bio-stimulation, are considered for microbial ground modification. Bioaugmentation involves injecting bacterial cells and nutrients directly into the target site. The bioaugmentation strategy for MIBF treatment takes into account four essential conditions for field application. First, the augmented bacteria must be capable of adapting to the inoculated environment, including factors like temperature, salinity and pH. Second, the augmented species must have a substantially higher cell density than the indigenous ones. Third, the growth rate of the augmented species must far surpass that of the indigenous ones, especially under the designed nutrient conditions. Fourth, after augmentation, it is crucial to supply the appropriate nutrients steadily and ensure that the injected species represent a core group of active bacteria as the bacterial community evolves (Xia et al., 2020).
Conversely, biostimulation aims to activate specific indigenous bacteria by injecting tailored nutrients that stimulate their desired functions. Various studies have explored the feasibility of biostimulation for bioclogging (e.g. Seki et al., 2006; Kim et al., 2019) and MICP (e.g. Ferris et al., 1997; Fujita et al., 2008; Burbank et al., 2013; Gomez et al., 2017, 2018). Ensuring the activity and bioproducts of the target species is crucial in the case of biostimulation with MIBF. For engineered bioclogging, in situ pumping well testing can be valuable in assessing permeability reduction, and microbial product analysis from sampled soils can help verify its efficacy.
Field implementation of EIBF
The EIBF treatment introduces cell-free solutions containing enzymes and sucrose, which allows indigenous bacteria also to consume the sucrose for their growth. The reaction rate of the enzyme dextransucrase is crucial for EIBF efficacy. In this study the extracted enzyme dextransucrase consumed 40 g/l sucrose and formed dextran within 72 h at ∼24°C. Temperature can influence the reaction rate, with higher temperatures increasing the rate and vice versa. To enhance the effectiveness of EIBF, increasing the sucrose feed can compensate for the sucrose consumed by native bacteria.
Preservation of the enzyme activity while producing it at a large quantity at the right time, however, is vital in field-scale implementation of EIBF. The enzyme secreted by bacteria loses its activity over time; dextransucrase in particular exhibits its highest activity within the first 30 h before gradually decaying (Padmanabhan & Kim, 2002). Accordingly, previous studies suggest preservation through cold storage between −80°C and −20°C or storing in buffer solutions with non-ionic polymers such as dextran, PEG20000 and methyl cellulose, or with nonionic surfactants such as Tween80 (e.g. Miller & Robyt, 1984). A comprehensive plan for large-scale field application should be developed to ensure in situ or ex situ enzyme production and preserve their activity throughout the duration of the treatment programme.
While bacteria typically have a size of several micrometres, the sieving effect by small pores presents a challenge when trying to inoculate bacteria into fine-grained soils. In contrast, enzymes, being fully dissolved in water, can be transported into fine-grained sediments with low permeability. Nevertheless, additional study is necessary to investigate the effect of EIBF in fine-grained soils.
Durability of dextran-associated bioclogging
Durability is a critical factor for the longevity of bioclogging in field applications. For instance, biofilms formed on solid surfaces can degrade under starved conditions or flow-induced shear stress, unless they are associated with inorganic solid particles, such as clays (Farah et al., 2016; Proto et al., 2016; Kim & Kwon, 2022). To address this concern, the authors in addition conducted an examination of hydraulic conductivity recovery and dextran flushing by injecting de-ionised water. There was no sign of sloughing under a hydraulic gradient of approximately 10–40, and the lowered hydraulic conductivity remained unchanged throughout the examination. Similarly, Kim & Fogler (1999) reported that insoluble dextran produced by L. mesenteroides showed minimal degradation under starved conditions for a maximum of 2 years, indicating no consumption by starved bacteria. Moreover, the dextran remained stable even under critical shear stress conditions for sloughing (Kim & Fogler, 2000). Kim et al. (2000, 2020) found that the dextran exhibited stability over a wide pH range from 3 to 12 during experiments over 200 days. This resilience of dextran to harsh environments is advantageous for the field application of engineered bioclogging. However, site-specific upscaled experiments and well-designed durability tests are necessary before implementing MIBF and EIBF in the field.
CONCLUSIONS
This study introduces the MIBF and EIBF methods for producing insoluble polysaccharidic dextran biopolymers and investigates their mechanisms for inducing bioclogging in soils, spanning from pore-scale to column-scale. The salient findings from this study are listed below.
The batch experiments confirm that EIBF shows a higher biopolymer production yield than MIBF with a higher sucrose-to-dextran conversion ratio. The optimal EIBF recipe is determined to use a final sucrose concentration of 40 g/l and an E/S ratio of 0·5.
The microfluidic chip experiments reveal that in both EIBF and MIBF, dextran fills pores without coating solid walls. EIBF produces larger dextran flocs on average, resulting in a more effective reduction in K compared to MIBF at similar dextran pore saturations. In addition, EIBF generates more dextran and a greater number of dextran flocs than MIBF for the same sucrose concentration.
The column experiments demonstrate that both MIBF and EIBF can reduce K in coarse sands by two orders of magnitude with less than 3% dextran pore saturation. EIBF shows a significantly faster rate of reduction compared to MIBF, with EIBF at 40 g/l sucrose concentration being as efficient as MIBF at 160 g/l sucrose concentration.
The cell-free EIBF method produces negligible carbon dioxide bubbles, while the MIBF method generates carbon dioxide through bacterial fermentation. As a result, pore fluid pressure has a significant impact on MIBF, with increased pressure suppressing bubble generation and aiding clogging.
The Kozeny pore-filling model effectively captures the measured K reductions as a function of biopolymer pore saturation with the exponent n values of 300–700 for the MIBF method and ∼2200 for EIBF. These high n values indicate a significant pore clogging behavior in both MIBF and EIBF.
Both MIBF and EIBF show promise for engineered bioclogging in soils, with EIBF exhibiting better effectiveness than MIBF. The results presented demonstrate their potential for controlled K reduction in coarse-grained soils. These methods are applicable to larger-scale experiments and field demonstrations, and further research is warranted to test them in various environments.
Data availability statement
All data, models and code used to support the findings of this study are available from the corresponding author upon request.
Supplementary material
Texts S1–S5, Tables S1–S3 and Figs S1–S4 are available online in the ICE Virtual Library (https://www.icevirtuallibrary.com/doi/suppl/10.1680/jgeot.23.00039).
ACKNOWLEDGEMENTS
This work was supported by the National Research Foundation of Korea (NRF) grant funded by the Korea government (MSIT) (NRF-2022R1A4A5031447), and by ‘Ministry of the Interior and Safety’ R&D programme (20018265). Y. Kim was financially supported by the Institute for Korea Spent Nuclear Fuel (iKSNF) and National Research Foundation of Korea (NRF) grant funded by the Korea government (Ministry of Science and ICT, MSIT) (NRF-2021M2E1A1085185).
REFERENCES
Discussion on this paper closes 1 May 2026; for further details see p. ii.

