

Piled embankments are traditionally designed by using either guidelines based on simplified limit-equilibrium theories or advanced finite-element (FE) numerical analyses. Both methods have limitations: the former do not allow the assessment of settlements at the top of the embankment, whereas the latter easily become overly complex, hence limiting practical applications. This paper introduces a new mathematical model capable of reproducing, with minimal computational effort, the mechanical response of piled embankments modelled by means of FEs. The model is based on a set of fundamental principles, assumptions and phenomenological equations obtained from a deep understanding of the mechanics behind the FE problem. The model, evaluating average and differential settlements at the top of the embankment during the consolidation of the soft soil, is validated against full-scale test data and benchmarked against independent numerical results. The results are compared with existing formulas to evaluate the critical height of the embankment, demonstrating the great potential of the new model for engineering practice (giving nearly instantaneous displacement-based solutions for the design of piled embankments in a preliminary stage).
NOTATION
- C2, 3, … ,8
non-dimensional compliance of subdomains defined in the model
- Cav, Cdiff
non-dimensional compliances of the model
generalised non-dimensional elastic compliance for Ie interface element
- d
pile diameter (m)
- Ee, Ef
Young’s modulus of embankment and foundation soil, respectively (kPa)
- Eoed,e, Eoed,f
oedometric modulus of embankment and foundation soil, respectively (kPa)
matrix of terms defining the hidden non-dimensional variables during the elastic and elastic–plastic phase, respectively
- H
non-dimensional embankment height
non-dimensional critical embankment height
- He
non-dimensional height subdomains 5–6
constant value of He after yielding
- Hp
non-dimensional process height
non-dimensional distance of the plane of equal settlements (PES) from the embankment bottom
- h
embankment height (m)
critical embankment height (i.e. at the end of consolidation) (m)
- he
height of the elastic zone in the embankment (m)
- hp
process height of the embankment (see subsection ‘Process height’) (m)
distance of the PES from the embankment bottom (m)
- Ie, Ip
elastic and plastic interface elements in the model, respectively
- k
ratio between horizontal and vertical stresses
average value of the k ratio in the process zone
- kv
vertical hydraulic conductivity of the foundation soil (m/s)
- L
non-dimensional pile length
- l
pile length (m)
- r
radial coordinate (m)
- S
non-dimensional unit cell diameter
- s
unit cell diameter (m)
- T
non-dimensional time
non-dimensional shear force transferred by Ie
non-dimensional at yielding
non-dimensional shear force transferred by Ip
- t
time (s)
- ty
yielding time (s)
- Ub,f
non-dimensional ub,f
- Ue,c
non-dimensional average settlement of the top of subdomain 5
- Ue,diff
non-dimensional (nil) differential settlement at PES
- Ue,f
non-dimensional average settlement of the top of subdomain 6
- Ut,av
non-dimensional ut,av
- Ut,diff
non-dimensional ut,diff
non-dimensional average stresses acting on the dashpot of subdomain 2
- ub
vertical displacement at the base of the embankment (z = 0) (m)
- ub,f
average settlement of the base of the embankment (m)
- ut
vertical displacement at the top of the embankment (z = h) (m)
- ut,av
average settlement at the top of the embankment (m)
- ut,c
average displacement of the top of the embankment for 0 < r < d/2 (m)
- ut,diff
dimensional differential settlement at the top of the embankment (m)
- ut,f
average displacement of the top of the embankment for d/2 < r < s/2 (m)
- Z
non-dimensional z
- z
vertical coordinate (m)
- γ
unit weight of embankment (kN/m3)
- γw
water unit weight (kN/m3)
non-dimensional viscosity of the dashpot of subdomain 2
non-dimensional σc
non-dimensional σf
non-dimensional average vertical stress at the top of subdomain 2 at the end of consolidation
- σc
average total vertical stress acting above the concrete pile (kPa)
- σf
average total vertical stress acting above the foundation soil (kPa)
- σv
total vertical stress at the base of the embankment (kPa)
- τ
shear stress (kPa)
maximum shear stress within the elastic zone (kPa)
shear stress at yielding in z = 0 (kPa)
non-dimensional settlements rate during consolidation
embankment soil internal friction angle (degrees)
embankment soil simple shear friction angle (degrees)
vector of hidden non-dimensional variables
embankment soil dilatancy angle (degrees)
INTRODUCTION
Piled embankments are very challenging geotechnical systems composed of embankment material, concrete piles and foundation soil. They are widely used to reduce settlements of engineered embankments built on soft soil deposits. The marked difference between the stiffness of concrete piles and surrounding soft soil leads to the development of differential settlements at the base of the embankment. This induces (a) the ‘arching effect’ (Marston, 1913; Terzaghi, 1936; McKelvey, 1994; van Eekelen et al., 2013), that is the transfer of stress within the embankment towards pile heads; (b) localisation of shear strains experimentally observed (Da Silva Burke & Elshafie, 2021) in the ‘process zone’ (di Prisco et al., 2020; Mangraviti et al., 2023a, 2023b), that is a thin plastic subdomain close to the pile edge, propagating upwards from the base of the embankment; and (c) the ‘plane of equal settlements’ (PES) (Terzaghi, 1936; McKelvey, 1994; McGuire, 2011), that is the locus where differential settlements between the region of embankment above piles and the one above foundation soil are negligible. The combination of these three mechanisms is affected by the embankment construction rate (Jenck et al., 2009) and governs the time-dependent mechanical response of the system. However, the embankment construction rate affecting the mechanical response of piled embankments has not yet been investigated. The redistribution of vertical stresses takes place in general both within the embankment and under the foundation plane owing to the roughness of piles shaft (Combarieu, 1988). In this paper, the authors focus on the mechanisms developing in the embankment, by assuming the pile shaft to be smooth.
The accurate prediction over time of the development of settlements is of paramount importance for the alignment, and hence the proper functioning of line infrastructure built on an embankment. In the last few decades, three-dimensional (3D) numerical studies have been carried out to model piled embankments. The behaviour of piled embankments is time dependent and requires coupled hydraulic and mechanical modelling (Huang & Han, 2010; Rowe & Liu, 2015). Nevertheless, 3D hydromechanical coupled numerical analyses are not very common in design practice, being computationally demanding (Bhasi & Rajagopal, 2015). In many cases, the embankment construction is simulated under drained conditions by disregarding the increase in excess pore pressure in the foundation soil (Jenck et al., 2009). Therefore, for practical reasons, many researchers in the past have successfully modelled axisymmetric unit cells to study the performance of the central part of piled embankments (Han & Akins, 2002; Smith & Filz, 2007; Bhasi & Rajagopal, 2015). However, due to the large stiffness gradient between piles and soil managed by interface elements, when time dependency is accounted for, even simplified calculations are time consuming to run (central processing unit (CPU) run time can vary between 24 and 48 h). To this must be added the time required to set up the finite-element (FE) model, evaluate the effects of mesh size/time step on the numerical results and validate the model against real case studies. These operations may require the involvement of an operator at additional cost.
The most commonly used design approaches are based on simplified models defined in the framework of the limit equilibrium method (BSI, 2010; EBGEO, 2010; van Eekelen & Brugman, 2016), disregarding the stiffness of the elements and not allowing the calculation of the evolution of settlements with time at the top of piled embankments. Only ASIRI (2012) suggests an alternative approach to calculate settlements and homogenised vertical stress distribution along piles including foundation soil stiffness as input data (Cuira & Simon, 2009).
Guidelines usually assume the displacements at the top of the embankment under serviceability conditions to be always nil except for the case of shallow embankments (SEs), where the final height of the embankment is smaller than a ‘critical height’. According to all the standards, the critical height is unique, independently of the construction time. One goal of this paper is to demonstrate the opposite. Furthermore, all the formulas for the critical height in the standards are a function of only geometrical quantities (i.e. pile spacing and diameter) and have been derived from results of trap-door tests. However, in a trap-door test, the influence of evolving subsoil stiffness between columns during consolidation is ignored by assuming a uniform settlement profile. Therefore, the arching stresses calculated using standard design methods at ultimate state differ considerably from each other (Naughton & Kempton, 2005; Pham & Dias, 2021) and from those measured in the field (King et al., 2017; Pham & Dias, 2021). A first step towards linking arching stresses in the embankment with settlements in the foundation soil was made by Iglesia et al. (2014) and King et al. (2017), who introduced the ‘ground reaction curve’. However, this approach does not allow the displacements at the top of the embankment to be calculated.
Both the absence of valid theoretical methods and the excessive time needed to perform numerical analyses make the estimation of settlements at the top of piled embankments very challenging. For this reason, di Prisco et al. (2020) proposed a mathematical model capable of satisfactorily reproducing the results obtained for the simulated construction of an embankment founded on end-bearing smooth piles and coarse foundation soil. The model has been extended to the case of rough piles by Flessati et al. (2023) and to geosynthetic reinforced and pile-supported embankments by di Prisco et al. (2019), Mangraviti et al. (2021, 2023b) and Mangraviti (2022). However, all these models do not consider the consolidation process, assuming drained conditions for the subsoil during the embankment construction. The novelty of the current paper concerns the study of stress-transfer mechanisms from the embankment to the piles, in the case of fine-grained materials in the foundation soil, and how these are severely influenced by the consolidation process.
In this paper, a new mathematical model to calculate settlements at the top of piled embankments on soft soil during consolidation is illustrated. The mathematical model proposed in this study is a model of a FE model built to be computationally efficient for use in the preliminary design of the time-dependent response of piled embankments, where materials with vastly different stiffnesses interact. The mathematical model is based on few hypotheses and equations, and capable of instantaneously (less than a minute) predicting the mechanical response of such a complex geo-structure modelled with computationally demanding FE simulations.
To understand the mechanics behind the problem and the way the embankment construction rate affects the mechanical response of the system, hydro-mechanical coupled non-linear FE analyses (section ‘FE numerical results’) have been performed looking at the concepts of PES (subsection ‘Plane of equal settlements’); process height (subsection ‘Process height’) and the arching effect (subsection ‘Arching effect’). The new mathematical model (illustrated in section ‘Mathematical modelling’), including both the cases of ‘deep’ embankment (DE) and SE, has been calibrated on few numerical simulations (section ‘Mathematical model calibration’) and benchmarked against independent numerical parametric study (subsection ‘Comparison with numerical results’). Furthermore, it was validated against field measurements from a full-scale experiment, other numerical studies from the literature and a centrifuge test (subsection ‘Validation on experimental data and other numerical studies’). In the fifth section ‘Discussion and comparison with existing formulas’, the practical application of the mathematical model is illustrated by discussing and comparing the results in terms of critical height of the embankment against some of the most popular formulas published in the literature and suggested by standards.
FE NUMERICAL RESULTS
The authors have numerically analysed the consolidation process in the foundation soil due to the construction of an h-high piled embankment (Fig. 1(a)) by using Tochnog Professional (2019) FE code under small strains. As the focus was on the settlement response, the mechanical response of an axisymmetric representative unit cell is considered (Fig. 1(b)), where the equivalent diameter, s (calculated as in McGuire (2011)), includes: (a) one pile of diameter d and length l; (b) a homogeneous clay layer of thickness l; (c) an embankment of height h; and (d) a rigid bedrock. Usually, vertical piles are socked in the rigid stratum, but, for the sake of simplicity, this geometrical aspect is disregarded. A ‘fine’ mesh is used, consisting of six-noded triangular elements with seven integration points for each element. The number of integration points is the same for both soil and water. The mesh is refined near the pile edge (where the largest strains are expected) up to 0·1d and optimised to not affect the numerical results (Mangraviti, 2021). Normal displacements are not allowed on both lateral boundaries or at the base.
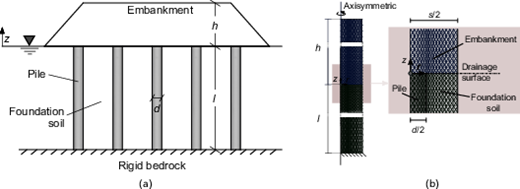
(a) Piled embankment based on end-bearing piles and saturated soil. (b) Geometry and mesh of the equivalent representative unit cell modelled with finite elements (FE)
(a) Piled embankment based on end-bearing piles and saturated soil. (b) Geometry and mesh of the equivalent representative unit cell modelled with finite elements (FE)
The construction process is assumed to be instantaneous (i.e. construction rate significantly larger than consolidation rate) and, therefore, for simplicity, in all the simulations, time t = 0 refers to the end of the construction phase. Piles are assumed to be smooth and end-bearing. The homogeneous foundation soil is assumed to be saturated and hydraulically isotropic, whereas the water table is assumed to be coincident with the ground level (z = 0, where drainage is permitted). The pile, as well as both bottom and lateral boundaries, are assumed to be impervious.
Initial pore pressure before embankment construction was imposed to be hydrostatic since pile installation effects are beyond the scope of this study.
The pile is assumed to behave elastically, whereas, in agreement with other authors (Han et al., 2007; Chen et al., 2008; Huang & Han, 2010; McGuire, 2011; Zheng et al., 2019; Wijerathna & Liyanapathirana, 2020), the mechanical behaviour of the soil within and below the embankment is assumed to be elastic–perfectly plastic, with a Mohr–Coulomb failure criterion and a non-associated flow rule. More sophisticated elastoplastic constitutive relationships for the numerical analysis of similar geometry are employed by Jenck et al. (2009), where the response of the unit cell is compared with 3D numerical results. The use of simple elastic–plastic constitutive relationships is justified by their popularity and by the aim of the paper, consisting in introducing the upscaled mathematical model illustrated in the third section ‘Mathematical modelling’. The use of more sophisticated constitutive relationships for FE method analysis would require a slight modification of the laws governing the response of the sub-structures defined in the subsection ‘Sub-structuring approach’, but not a change in the overall mathematical model set-up. Zero-thickness interface elements are introduced between pile and foundation soil. The elastic stiffnesses in normal and tangential directions (4·4 × 105 kN/m³ and 2·2 × 105 kN/m³, respectively) of the no-tension/no-friction interface elements were chosen, in accordance with the software manual (Tochnog Professional, Version 22 (Tochnog Professional, 2019)), as a function of the neighbouring elements’ stiffness and size.
After rapid construction, the height of the embankment is kept constant and the consolidation is monitored.
The FE numerical analyses have been subdivided into the three following stages.
The state of stress before the embankment construction is initialised for both pile and soft soil by applying gravity under drained conditions and by employing the standard Jaky’s formula.
After the displacements have been reset (settlements due to pile installation effects are not the object of this study), the elements representing the whole embankment are activated very rapidly (30 s) to simulate an ideal undrained embankment construction (i.e. without dissipation in the excess pore water pressure). At the end of this phase, the excess pore water pressure is equal to 99% of , where is the unit weight of the soil in the embankment.
The problem geometry is kept constant during consolidation.
With the aim of understanding the mechanical response, the numerical results are here discussed for two reference cases, representative for both SE and DE (geometry and mechanical properties in Tables 1 and 2, respectively). The effect of embankment dilatancy angle is included in this study and discussed in subsection ‘Comparison with numerical results’.
Geometry of the reference cases
| Reference cases | h: m | d: m | l: m | s: m |
|---|---|---|---|---|
| Deep embankment (DE) | 5 | 0·5 | 5 | 1·5 |
| Shallow embankment (SE) | 1 | 0·5 | 5 | 1·5 |
| Reference cases | h: m | d: m | l: m | s: m |
|---|---|---|---|---|
| Deep embankment (DE) | 5 | 0·5 | 5 | 1·5 |
| Shallow embankment (SE) | 1 | 0·5 | 5 | 1·5 |
Mechanical and hydraulic properties for the reference cases
| Unit weight: kN/m3 | Young’s modulus: MPa | Friction angle: degrees | Cohesion: kPa | Dilatancy angle: degrees | Hydraulic conductivity: m/s | |
|---|---|---|---|---|---|---|
| Soft soil | 18 | 1 | 30 | 0 | 0 | 4 × 10⁻⁹ |
| Embankment | 18 | 10 | 40 | 0 | 0 | 1 × 10⁻³ |
| Pile | 25 | 30 000 | — | — | — | Impervious |
Plane of equal settlements
Owing to the model hypotheses, settlements along the radial coordinate, r (Fig. 1(b)), are nearly constant above both concrete pile (subscript c for 0 < r < d/2) and foundation soil (subscript f for d/2 < r < s/2). Consequently, average values can be used to monitor the evolution with time of settlements at both embankment base (ub) and top (ut):
where
For the DE case, since the embankment height is larger and the settlements due to the embankment self-weight are included in the calculation, and are larger than for the SE case (Figs 2(a) and 2(b)). In contrast, differential settlements at the top:
are nil for any t value in the case of DE, whereas they progressively increase with time in the case of SE (Fig. 2(c)). In particular, at the beginning of consolidation, differential settlements are nil for both SE and DE (Fig. 2(d)), meaning the PES is in z = 0. During consolidation, for the DE case, and , meaning that the distance of the PES from the embankment base () evolves with time within the embankment body.
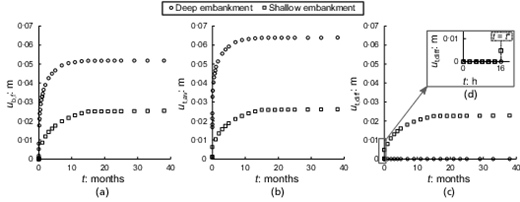
Evolution during consolidation of: average settlements at (a) base and (b) top of the embankment; and (c) differential settlements at the top of the embankment. (d) Zooming in on the beginning of consolidation for the case of shallow embankment (SE)
Evolution during consolidation of: average settlements at (a) base and (b) top of the embankment; and (c) differential settlements at the top of the embankment. (d) Zooming in on the beginning of consolidation for the case of shallow embankment (SE)
Process height
The process height (hp in Fig. 3) is the height of the zone in the proximity of the pile edge where strains localise (di Prisco et al., 2020). The evolution of the process zone during consolidation is reported as an original result in Figs 3 and 4. For both DE and SE, at t = 0, plastic shear strains are nil within the embankment (Figs 3(a) and 3(f)). During consolidation, plastic shear strains develop within the embankment in a narrow crown close to the edge of the pile head (Figs 3(c)−3(e) and 3(h)–3(j) for DE and SE, respectively). The hp-long zone where the soil yields is the ‘process zone’ and reaches the top of the embankment only for SEs (Figs 3(h)−3(j)).
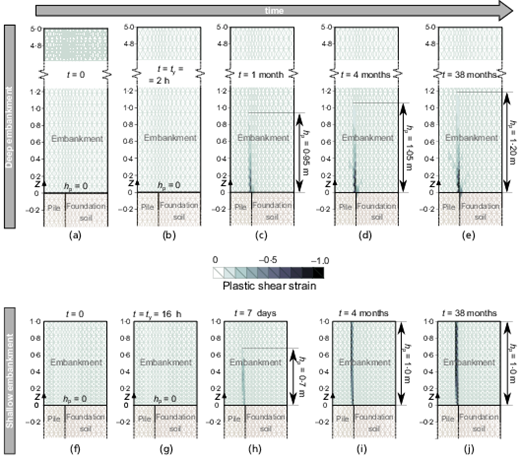
Contour of plastic shear strains and of plastic (process) height, hp, during consolidation for both the reference cases of (a)–(e) deep embankment (DE) and (f)–(j) shallow embankment (SE)
Contour of plastic shear strains and of plastic (process) height, hp, during consolidation for both the reference cases of (a)–(e) deep embankment (DE) and (f)–(j) shallow embankment (SE)
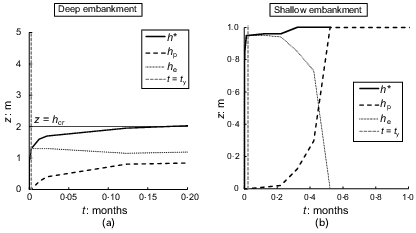
Evolution with time of the height of the plane of equal settlements (PES), the process height and the elastic height for both (a) deep and (b) shallow embankments (SEs) at the beginning of consolidation
Evolution with time of the height of the plane of equal settlements (PES), the process height and the elastic height for both (a) deep and (b) shallow embankments (SEs) at the beginning of consolidation
It is worth noticing that hp is initially nil and remains nil for a not negligible time interval (Figs 3(a) and 3(b), and Figs 4(f) and 4(g)). During this period, the embankment soil does not exhibit any plastic strain and behaves elastically. At , yielding starts to take place and plastic strains, together with hp, progressively start evolving until the end of consolidation.
For the sake of clarity, the evolution with time of both (subsection ‘Plane of equal settlements’) and hp, for both DE and SE, is illustrated in Fig. 4. The volume in between PES and the top of the process zone is an elastic zone of thickness . For the DE case, he is almost constant after yielding (dotted line in Fig. 4(a)). For the SE case (Fig. 4(b)), hp starts evolving after yielding, rapidly reaching the top of the embankment, and when hp = h, the PES does not belong to the embankment any longer and he = 0.
The asymptotic value of is the critical height ( in Fig. 4(a)). For DEs, , whereas, for SEs, for a sufficiently large time, , the PES at the end of consolidation is not defined within the embankment domain and .
Therefore, coincides with the minimum value of h for which, at the end of the consolidation process. This implies that is a function of the construction rate: for instance, considering the same reference DE, if the embankment is constructed under drained conditions (i.e. very small values of construction rates, as in di Prisco et al. (2020)), whereas (Fig. 4) under undrained construction conditions (i.e. very large values of construction rates).
Arching effect
Analogously to settlements, average values of the total vertical stress in z = 0 can be used to plot the evolution with time of stresses at the top of both concrete pile and soft soil:
being σv the total vertical stress at z = 0 along r.
For t = 0, for both DE and SE, (Fig. 5). For t > 0, consolidation takes place and, due to the arching effect, progressively increases, while decreases. Furthermore, tangential stresses (τ in Figs 6(a) and 6(b), relative to DE and SE, respectively) increase during consolidation within the embankment close to the pile edge (r = d/2). Since τ is practically negligible above the PES (z > h*), τ-isochrones numerically computed for r = d/2 in Fig. 6 refer only to 0 < z < . For the sake of clarity, z = hp(t) (large black circles in Figs 6(a) and 6(b)) is reported on each of the isochrones to highlight that τ are transmitted within the elastic zone as well. The τ trend is dominated by the boundary condition in z = 0, where shear stresses have to be nil since the pile shaft is assumed to be smooth.
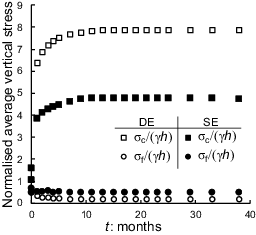
Evolution during consolidation of normalised average total vertical stress acting over the concrete pile and the foundation soil for both deep embankment (DE) and shallow embankment (SE) reference cases
Evolution during consolidation of normalised average total vertical stress acting over the concrete pile and the foundation soil for both deep embankment (DE) and shallow embankment (SE) reference cases
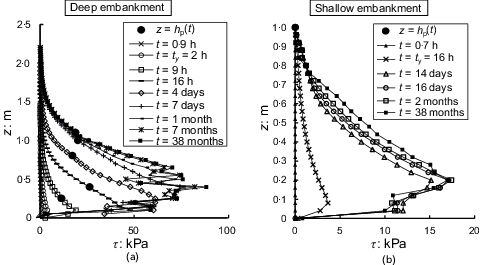
Vertical profiles within the embankment of tangential stresses, τ, during consolidation for (a) deep embankment (DE) and (b) shallow embankment (SE) reference cases
Vertical profiles within the embankment of tangential stresses, τ, during consolidation for (a) deep embankment (DE) and (b) shallow embankment (SE) reference cases
MATHEMATICAL MODELLING
In the light of the numerical results illustrated in the second section ‘FE numerical results’, in this section, a mathematical model is introduced, putting in relation embankment height and time with average and differential embankment settlements. With this aim, all the hypotheses listed in the previous section ‘FE numerical results’ for the definition of the numerical model are employed.
Sub-structuring approach
The mechanical response of the ideal axisymmetric unit cell (Fig. 1(b)) can be subdivided into an initial elastic phase (0 < t < t*) and a subsequent elastic–plastic one (t > t*). During the elastic phase, hp = 0 (Figs 3(b) and 3(g)), the PES evolves upwards ( in Figs 4(a) and 4(b)). During the elastic–plastic phase, hp > 0 (Figs 3(c)−3(e) and 3(h)–3(j)) and the evolution with time of he is different for DEs and SEs. In the former case, he initially increases until it reaches an almost constant value (t > t* in Fig. 4(a)), whereas, in the latter one, he initially increases until a plateau (at which he = h*), but, subsequently, it progressively nullifies (Fig. 4(b)).
The model hereafter assumes sub-structuring the spatial domain into eight zones, whose thickness evolves over time, due to the almost constant trend along r of both settlements and vertical stresses for 0 < r < d/2 and d/2 < r < s/2. In Fig. 7, where Z = z/d is the non-dimensional vertical coordinate, element number:
1 corresponds to the concrete pile, modelled as a rigid element
2 corresponds to the foundation soil, modelled as a viscous-elastic element
3 and 4 correspond to embankment subdomains modelled as elastic elements, whose height evolves with hp (geometrical non-linearity)
5 and 6 correspond to embankment subdomains modelled as elastic elements, whose height evolves with (geometrical non-linearity)
7 and 8 correspond to embankment subdomain modelled as elastic elements, whose height reduces with both he and hp increasing (geometrical non-linearity).
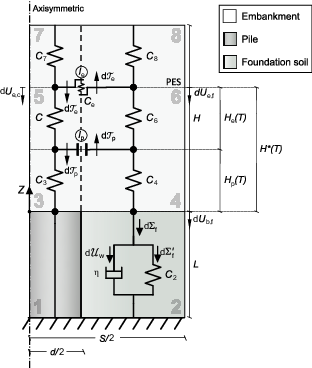
Subdomains 7 and 8 do not interact to each other, since there is no transfer of shear stresses along their interface (Fig. 6). The shear stress transfer at the interface between subdomains 5 and 6 has been modelled by means of an elastic interaction element located at z = h*(t) (Ie in Fig. 7), whereas a plastic interaction element (Ip in Fig. 7) is used at z = hp(t) to model the stress transfer through the process zone (between subdomains 3 and 4). Subdomains 1 and 2 do not interact with each other since the pile is assumed to be smooth.
Each element in Fig. 7 is assumed to deform only vertically, due to axisymmetric conditions. Horizontal stresses in elements 4 and 6 are used to calculate shear stresses along vertical interfaces (as detailed in the subsection ‘Vertical stress redistribution system’).
Mathematical model
The mathematical model is conceived by using non-dimensional variables (di Prisco et al., 2020):
where is the foundation soil elastic oedometric stiffness, and the average stresses:
In agreement with one-dimensional (1D) consolidation theory, the non-dimensional time:
where is the foundation soil vertical hydraulic conductivity and is the water unit weight, is used.
Using non-dimensional variables is particularly convenient since, in the non-dimensional Ut,diff − T and Ut,av − T planes, the embankment response is unique if: (a) the non-dimensional geometrical ratios (H = h/d, S = s/d, L = l/d); (b) the non-dimensional stiffness ratio (Eoed,e/Eoed,f, where Eoed,e is the oedometric modulus of the embankment); (c) friction and dilatancy angle values, and ; and (d) are kept constant.
The constitutive relationships expressed in terms of the previously listed non-dimensional variables are a function of the non-dimensional compliances (Fig. 7) listed here below:
being Hp = hp/d and He = he/d the non-dimensional hp and he, respectively. The evolution of the non-dimensional height of PES () is discussed in the subsection later in this paper ‘Evolution of hidden variables’.
The non-dimensional shear forces, and , (transferred by Ie and Ip, respectively) are:
By considering (a) balance of momentum along vertical direction; (b) constitutive laws of all elements of Fig. 7 and interfaces (Ie and Ip); and (c) compatibility conditions along z, the generalised constitutive relationship (taking into consideration not only the consolidation process taking place for t > 0, but also the embankment construction time period) for the geo-structure can be written as:
where and are non-dimensional compliances; and are non-dimensional average and differential settlement rates related to the consolidation of the foundation soil (see subsection ‘Vertical stress on foundation soil and concrete pile’). The expressions for both compliances and settlements rates (reported in the Appendix), are obtained by employing the scheme of Fig. 7 and the constitutive relationships given in both of the next two subsections ‘Vertical stress redistribution mechanism’ and ‘Vertical stress on foundation soil and concrete pile’.
In equation (15), and are the output variables and is the loading variable, whereas is the vector containing the ‘hidden variables’ (whose evolution is defined in the subsection ‘Vertical stress on foundation soil and concrete pile’):
where represents the non-dimensional average stresses acting on the dashpot of subdomain 2, related to the excess pore pressure in the foundation soil.
Vertical stress redistribution mechanism
Shear stresses transmitted by Ie and Ip increase with time due to the increase in during consolidation. As suggested by Fig. 3, the shear stress transfer process is initially elastic and, in a second phase, elastic–plastic.
In the mathematical model, during the elastic phase, the non-dimensional shear forces are transmitted only by Ie (see the following subsection ‘Elastic phase’), whereas they are transmitted by both Ie and Ip during the elastic–plastic one (see subsection ‘Elastic–plastic phase’).
Elastic phase
During the elastic phase, subdomains 3 and 4 are not defined (, from Figs 3 and 4). When consolidation starts, increases, whereas the top of the pile does not move. Therefore, coincides with non-dimensional differential displacements at the embankment base, and:
where is a generalised elastic embankment compliance, calibrated on FE method numerical results in the later subsection ‘Mathematical model calibration’.
Equation (17) holds until the maximum shear stress within the elastic zone, (Fig. 8, where Z = z/d is the non-dimensional vertical coordinate) reaches the value of yielding, :
where both vertical and horizontal stresses are assumed to increase linearly with depth and are related to each other by a constant ratio , whose dependence on is calibrated on FE method numerical results in the subsection ‘Mathematical model calibration’, whereas:
where is the embankment soil friction angle under simple shear conditions (di Prisco et al., 2020).
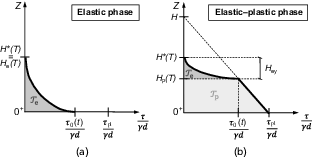
Non-dimensional tangential stresses transmitted at the interface along Z during consolidation for both the (a) elastic and (b) elastic–plastic phases
Non-dimensional tangential stresses transmitted at the interface along Z during consolidation for both the (a) elastic and (b) elastic–plastic phases
By assuming a parabolic distribution of tangential stresses at the interface (as suggested by Fig. 6, for t < t*), the maximum value of along depth (Fig. 8(a)) is:
By substituting equation (18) into equation (20):
the value of at yielding () is obtained.
Elastic–plastic phase
In the elastic–plastic phase, is calculated by assuming, for the distribution of along depth: (a) (see subsection ‘Sub-structuring approach’) and (b) a parabolic shape for (Fig. 8(b)):
where is the (constant) value of at yielding (t = t*).
Since, for , both vertical and horizontal stresses at yielding are assumed to depend linearly on depth (Fig. 8(b)), and shear stress to be calculated according to the Mohr–Coulomb failure criterion:
Vertical stress on foundation soil and concrete pile
Owing to the FE model simplifications, consolidation in the soft soil evolves one-dimensionally. Therefore, a simplified Kelvin–Voight model is used in subdomain 2 and:
where
The non-dimensional pseudo-viscous parameter, , mimics the temporal evolution of excess pore water pressure during consolidation in a saturated homogeneous soil stratum. In the non-dimensional space, η = 1/3 fits the evolution with time of settlements at the top of the foundation soil that would be obtained for 1D consolidation under a constant total vertical stress according to Terzaghi’s theory and is independent from the soil mechanical properties, hydraulic conductivity and geometry of the system.
By computing the balance of momentum along the vertical direction of the embankment according to the scheme of Fig. 7, the evolution of average vertical stresses is obtained:
where and are evaluated differently during the elastic phase (equation (17), whereas ) and the elastic–plastic phase (equations (22) and (23)).
Evolution of hidden variables
The evolution of hidden variables (equation (16)) can be written as follows:
where:
in which:
and
where
The Macaulay’s bracket multiplying in equation (31) includes the case of SE, where stops evolving () when reaching the top of the embankment ().
The increment of the hidden variable is evaluated by (a) substituting equation (24) into equation (25); (b) computing the time derivative of the obtained equation and (c) substituting equations (26) and (27) in this one. The increment of both and is evaluated by using both the following conditions:
where is obtained from the balance of momentum, the compatibility and the constitutive equations in accordance with the scheme in Fig. 7, the increment of differential settlements at the PES.
Mathematical model calibration
The mathematical model requires the assessment of and . The generalised non-dimensional embankment compliance, (equation (17)), is evaluated from FE numerical results by estimating both Ub,f and at the beginning of the elastic phase. Thanks to its non-dimensional definition, is numerically observed to depend only on the relative embankment–foundation soil stiffness (Ee/Ef, where Ee and Ef are the Young’s moduli of the embankment and foundation soil, respectively). This dependence is illustrated in Fig. 9(a). Since Ee/Ef < 10, cases are not common for engineering applications, is assumed to be constant and equal to . This implies that the model may not be suitable for predicting the system response of piled embankments on foundation soils that are not sufficiently soft.
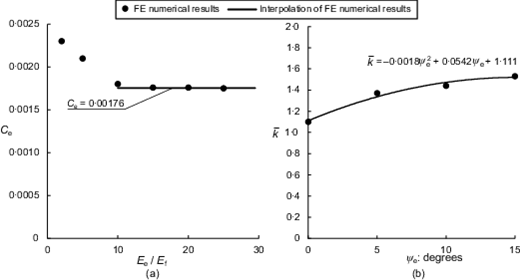
Calibration of (a) Ce and (b) against finite element (FE) numerical results obtained by considering the model introduced in Fig. 1(b)
Calibration of (a) Ce and (b) against finite element (FE) numerical results obtained by considering the model introduced in Fig. 1(b)
For the sake of simplicity, in equations (18) and (21)–(23), is considered to be constant during the consolidation process and only to depend on . The function is obtained from FE numerical results by calculating the average value of for at the end of the consolidation process. In Fig. 9(b), both FE numerical results and the expression employed in the mathematical model to interpolate them are reported.
MODEL PERFORMANCE
The numerical integration of the mathematical model requires the definition of the construction sequence, geometry and the standard hydro-mechanical properties of soil (all the necessary input data are listed in the first line of Table 3). Equations (15)–(39) have been integrated/implemented by using Matlab (2022) software.
Geometry and material properties used in the mathematical model for the validation against the full-scale experiment of Briançon & Simon (2012). S is calculated as in McGuire (2011) for piles with a squared pattern
| Test from reference | d: m | s: m | l: m | h: m | Ef,oed: MPa | Ee: MPa | ϕ′e: deg | ψe: deg | γ: kN/m3 | kv: m/s | |
|---|---|---|---|---|---|---|---|---|---|---|---|
| Briançon & Simon (2012) | 0·38 | 2·83 | 7·5 | 5 | 4 | 20 | 36 | 0 | 18·5 | 3.2 × 10⁻⁸ | |
| Liu et al. (2023) | 0·5 | 3·54 | 15 | 8 | 0·8 | 10 | 30 | 34 | 0 | 23 | 1.5 × 10⁻⁷ |
For the sake of generality, the mathematical model is conceived to simulate any embankment construction rate, that is also ‘partially drained’ embankment construction. Nevertheless, for the sake of brevity, in this section and in the following one, the embankment construction is always assumed to take place under undrained conditions. In the section ‘Validation on experimental data and other numerical studies’, the effects of construction velocity are discussed.
Comparison with numerical results
In this paragraph, the predictions of the mathematical model are compared with FE results for the DE reference case (Fig. 1(b), Tables 1 and 2). In particular, in Figs 10(a) and 10(b) the comparison concerns non-dimensional settlements. The agreement is very satisfactory both qualitatively and quantitatively. In Figs 10(c) and 10(f), the evolution with time of all the variables that can be extracted from the model are compared against FE results (H*, Hp, , with time and with ). As is evident in Figs 10(d) and 10(e), the mathematical model satisfactorily reproduces the evolution of vertical average stress in z = 0 due to the arching effect occurring during consolidation. Analogously (Fig. 10(d)), also well captured is the reduction in the non-dimensional stiffness of curve from the initial value (corresponding to 1/Ce), due to both yielding in the process zone and its upwards propagation.
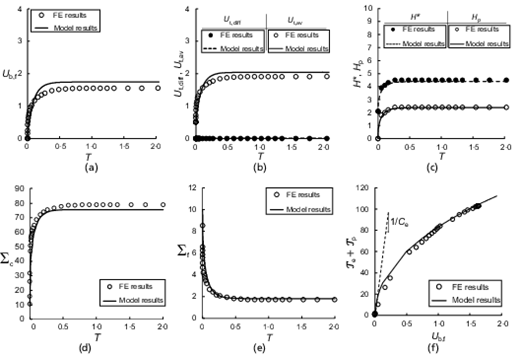
Comparison, for deep embankment (DE) reference case, between numerical results and mathematical model predictions during consolidation in terms of non-dimensional settlements at the (a) base and (b) top of the embankment; (c) plane of equal settlements (PES) height and process height; average vertical stress acting on the (d) concrete pile and (e) foundation soil; (f) transferring force plotted against non-dimensional settlements at the base of the embankment
Comparison, for deep embankment (DE) reference case, between numerical results and mathematical model predictions during consolidation in terms of non-dimensional settlements at the (a) base and (b) top of the embankment; (c) plane of equal settlements (PES) height and process height; average vertical stress acting on the (d) concrete pile and (e) foundation soil; (f) transferring force plotted against non-dimensional settlements at the base of the embankment
To further assess the mathematical model’s capability of reproducing FE numerical results, the authors performed a parametric study (by changing both geometry and mechanical properties) and summarised the results obtained in terms of average settlements (ut,av and ub,f) and stresses ( and ) at the end of consolidation in Fig. 11. The agreement between mathematical model predictions and FE results is satisfactory: the R-squared value for ut,av, ub,f and is 0·99, whereas it is 0·98 for .
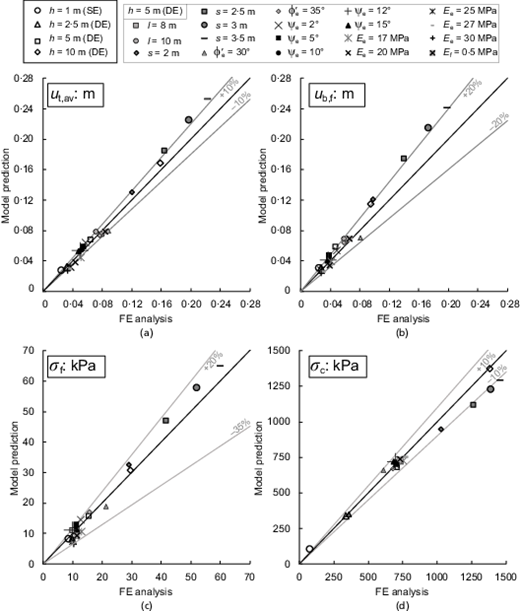
Comparison of mathematical model predictions and numerical simulations at long-term conditions in terms of: average settlements at the (a) top and (b) base of the embankment; average vertical stresses on the (c) foundation soil and (d) concrete pile (geometry and mechanical properties not indicated in the legend are reported in Tables 1 and 2)
Comparison of mathematical model predictions and numerical simulations at long-term conditions in terms of: average settlements at the (a) top and (b) base of the embankment; average vertical stresses on the (c) foundation soil and (d) concrete pile (geometry and mechanical properties not indicated in the legend are reported in Tables 1 and 2)
Particularly good is the agreement in terms of ut,av and . The quality of predictions reduces for increasing values of s/d. For s/d > 6 (corresponding to an area replacement ratio lower than 2·7%), the overestimation of ut,av, ub,f, σf and σc is larger than 10%. This is justified by the evolution of the geometry of the process zone observed from numerical results. In fact, as already commented by King et al. (2019), for sufficiently large s/d values, the process zone stops being vertical and unique, as assumed in the mathematical model proposed in this paper. However, even in these cases, the mathematical model provides a conservative estimation of settlements at the top.
Particularly satisfactory is the comparison for the SE reference case (empty circles in Fig. 11).
Validation on experimental data and other numerical studies
The hypotheses introduced to generate the FE numerical results, from which the mathematical model is derived, are particularly restrictive (axisymmetric conditions, smooth shaft piles and embankment construction under undrained conditions). Hence, experimental test results that perfectly fit the problem numerically solved are not available in literature. Thus, after its validation on the results of a numerical parametric study presented herein, the authors further benchmarked the model against data from experiments and other numerical analyses from the literature (that fit most of the hypotheses formulated in this study) to validate the mathematical model, without pretending to perfectly reproduce the measurements. Many researchers have investigated soil arching in several field case studies (e.g. Oh & Shin, 2007; Van Duijnen et al., 2010; Van Eekelen et al., 2010; Briançon & Simon, 2012; Lu et al., 2013, 2020; Xing et al., 2014; van Eekelen et al., 2020; Feng et al., 2021) or lab tests (Jenck et al., 2007; van Eekelen et al., 2012; Okyay et al., 2014; Girout et al., 2016; Yu et al., 2021; Liu et al., 2023). However, in almost all these cases, geosynthetic reinforcement layers (not considered in this study) were placed at the embankment base or the effects of the consolidation process (which are the focus of this study) were not appreciable. Furthermore, lab tests are usually performed either to explore the behaviour at failure of piled embankments or to validate ultimate limit state analytical methods. Consequently, the stiffness properties of the soil in the embankment and foundation (essentials for this study) are not provided.
The mathematical model proposed is validated against both a full-scale experiment from Briançon & Simon (2012) and a centrifuge test from (Liu et al., 2023), as both consider end-bearing piles surrounded by a saturated clayey material. In addition, both tests report the results of a reference case without piles and geosynthetics, which was fundamental for estimating the stiffness value of the foundation soil from the stress and settlement at the base of the embankment at the end of consolidation (secant modulus at the end of consolidation of the foundation soil).
The study from Briançon & Simon (2012) was numerically modelled by Rowe & Liu (2015) and Nunez et al. (2013), who both performed 3D numerical analyses to reproduce the mechanical behaviour of the test. The numerical scatter characterising 3D numerical results is emphasised in Fig. 12(a), where the final value at the base predicted by Nunez et al. (2013) (black dot) is compared to the numerical results by Rowe & Liu (2015) (dark grey line) in terms of settlements at the midspan between piles at the embankment base.
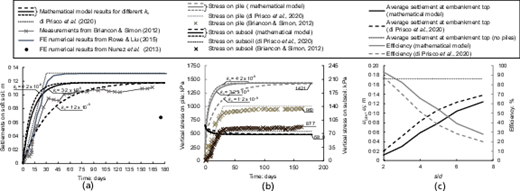
Validation of the mathematical model in terms of: (a) evolution of settlements at the top of the foundation soil; (b) evolution of stresses over the pile and foundation soil against both measurements of the full-scale experiment by Briançon & Simon (2012) and numerical results by Rowe & Liu (2015) and Nunez et al. (2013); (c) ut,av and efficiency of building piles in terms of average settlement at the top of the embankment under both drained and undrained embankment construction conditions, for different values of s/d for the case of Briançon & Simon (2012) (Table 3)
Validation of the mathematical model in terms of: (a) evolution of settlements at the top of the foundation soil; (b) evolution of stresses over the pile and foundation soil against both measurements of the full-scale experiment by Briançon & Simon (2012) and numerical results by Rowe & Liu (2015) and Nunez et al. (2013); (c) ut,av and efficiency of building piles in terms of average settlement at the top of the embankment under both drained and undrained embankment construction conditions, for different values of s/d for the case of Briançon & Simon (2012) (Table 3)
For the validation of the mathematical model, the input data from Rowe & Liu (2015) are used (see Table 3 and black continuous line in Fig. 12(a)), except for the l value, which is taken from Briançon & Simon (2012). Given the sophisticated constitutive models employed in the numerical study from Rowe & Liu (2015), the oedometric secant modulus of the soft soil layer was estimated as secant modulus from the interpretation of the numerical results relative to the section without piles. The nil embankment fill dilatancy assumed in Rowe & Liu (2015) corresponds to (Fig. 9).
The results of the mathematical model (solid lines in Figs 12(a) and 12(b)) are compared against measurements from Briançon & Simon (2012) (grey crosses in Figs 12(a) and 12(b)) and (when available) numerical results from Nunez et al. (2013) and Rowe & Liu (2015) in terms of (a) settlements (Fig. 12(a)) and stresses (Fig. 12(b)) at the base of the embankment, at the midspan between piles, (b) stresses on the pile, measured at 0·5 m depth (Fig. 12(b)), and (c) differential and average settlements at the top of the embankment (Table 4), accumulated in Rowe & Liu (2015) from the construction of the last layer of the embankment (corresponding to day 28) and the end of consolidation. ub,f (Fig. 12(a)) is calculated with equation (6) and integrating equations (26) and (28), whereas for ut,av and ut,diff in Table 4, equations (15) and (6) are used. and (Fig. 12(b)) are estimated by using equation (7) and integrating equations (27). Under the assumption of instantaneous embankment construction, the stresses calculated by the model start from a value corresponding to the weight of the embankment, uniformly distributed over the entire surface (pile + subsoil). To show how the model is affected by hydraulic conductivity, several values of kv were considered (dashed lines in Figs 12(a) and 12(b)) and, for the sake of clarity, model results obtained by assuming the embankment construction under drained conditions (corresponding to ) (di Prisco et al., 2020) are added (dashed lines in Figs 12(a) and 12(b)).
Validation of the mathematical model in terms of settlements both at the top of the embankment, as calculated numerically by Rowe & Liu (2015) for l = 9·5 m, and at the base of the embankment, as measured by Liu et al. (2023), at the end of consolidation
| Rowe & Liu (2015) | Liu et al. (2023) | |||
|---|---|---|---|---|
| ut,av: m | ut,diff: m | Settlement of the soft soil: m | ||
| Literature value | 0·029 | 0 | 1·70 | |
| Model prediction | 0·047 | 0 | 1·66 | 1·18 |
| Error | 61% | 0% | −2·2% | −31% |
| Rowe & Liu (2015) | Liu et al. (2023) | |||
|---|---|---|---|---|
| ut,av: m | ut,diff: m | Settlement of the soft soil: m | ||
| Literature value | 0·029 | 0 | 1·70 | |
| Model prediction | 0·047 | 0 | 1·66 | 1·18 |
| Error | 61% | 0% | −2·2% | −31% |
Comparing the current model predictions with experimental data (grey crosses) and previous numerical results obtained by Rowe & Liu (2015) and Nunez et al. (2013), it is evident that despite the simplified assumptions employed in the model definition (which were not fully satisfied by the experimental setting) the present mathematical model simulation performs reasonably well. Regarding the final settlement (Fig. 12(a)), the current model shows an error of +7% compared with measurements, which is a good result if compared with the +19% error of Rowe & Liu (2015) and the −39% error of Nunez et al. (2013).
The observed discrepancies in Fig. 12(b) and Table 4 can be attributed to: (a) the sloping base of the soft layer observed in situ; (b) the assumption of smooth piles made in the mathematical model; (c) the differences in the constitutive laws; (d) geometric modelling (3D as opposed to axisymmetric conditions, as already commented upon by Bhasi & Rajagopal (2015)); and (e) construction rate implemented in the numerical modelling of the test. The role of construction rate seems to be confirmed by the evolution with time of stresses on the subsoil: they continuously increase with time in the experiment, while model results are characterised by a continuous reduction due to consolidation. This is comparable with the results obtained by assuming the construction is taking place under drained conditions. It is also important to note that the comparison in terms of stresses over the pile involves average quantities from the model with local measurements from the experiment. Ideally, measurements of stress at the bottom of the pile would be more suitable for comparison with the model results. The mathematical model provides a reasonable (and quick) prediction of the settlements, also demonstrating that, despite its simplicity, the constitutive modelling adopted is representative of the mechanical behaviour of the system.
To put in evidence the role of drainage during embankment construction, Fig. 12(c) compares ut,av for different values of pile spacing, by using all input data in Table 3 and considering (dashed black line) and (solid black line), with the settlement at the top of the embankment without piles, ut (dashed black line). The efficiency at the long term of building piles under different construction rates is calculated as for any s/d value (grey lines in Fig. 12(c)). For this specific case, the difference between the solid and the dashed grey lines ranges from 10 to 30%.
The model was further validated against the results of a centrifuge test from Liu et al. (2023). The input data for the mathematical model (Table 3) were taken from Liu et al. (2023), except for the stiffness modulus of the embankment that is difficult to evaluate in the lab and has been here assumed realistically ranging between 10 ÷ 30 MPa. For the two values of Ee, ub,f model predictions at the end of consolidation are compared in Table 4 with experimental data. The minimum absolute error is 2·2% (for Ee = 10 MPa) and the maximum is 30·4% (for Ee = 30 MPa).
DISCUSSION AND COMPARISON WITH EXISTING FORMULAS
In the design of pile supported embankments a fundamental issue concerns the assessment of the critical height, since it defines whether differential settlements will be accumulated at the top of the embankment or not (SE or DE). The minimum embankment height needed to prevent differential settlements at the top of the embankment at the end of consolidation is the non-dimensional critical embankment height (). Very popular to evaluate Hcr are the formulas suggested by BS 8006-1 (BSI, 2010) and McGuire (2011), where Hcr is a function only of pile spacing and diameter, but not of embankment and soft soil properties.
The formulas by BS 8006-1 (BSI, 2010), ASIRI (2012) and McGuire (2011) in the Hcr–S plane correspond to two different straight lines (dashed lines in Fig. 13(a)) separating the boundary between DEs and SEs. As is evident in Fig. 13(a), McGuire’s formula is more conservative than the BS 8006-1’s one.
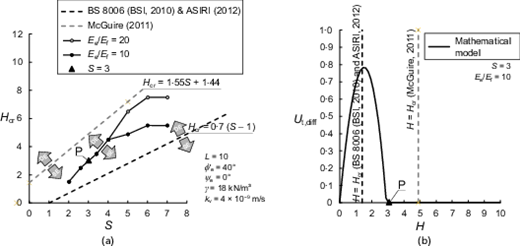
(a) Critical height as a function of pile spacing for BS 8006 (BSI, 2010), ASIRI (2012), McGuire (2011) and the mathematical model, at the long term for different Ee/Ef ratios. (b) Estimation of critical height for S = 3 using the mathematical model: long-term differential settlements at the top of the embankment against different values of embankment final height
(a) Critical height as a function of pile spacing for BS 8006 (BSI, 2010), ASIRI (2012), McGuire (2011) and the mathematical model, at the long term for different Ee/Ef ratios. (b) Estimation of critical height for S = 3 using the mathematical model: long-term differential settlements at the top of the embankment against different values of embankment final height
In both the FE results and mathematical model predictions, the distinction between DEs and SEs is also a function of Ee/Ef (Fig. 13(a)). To highlight this, two different Ee/Ef values are considered as an example. As is evident, for small values of S, mathematical model predictions are very close to the BS 8006-1 formula, whereas for larger S values and sufficiently large Ee/Ef values, the mathematical model predictions approach McGuire’s line.
The mathematical model predictions of Hcr (solid lines in Fig. 13(a)) are obtained by integrating the mathematical model introduced by the authors, for different values of S, and by assuming the geometrical and mechanical properties listed in Fig. 13(a). This is possible because, depending on the solver and timestep set, the mathematical model takes a few seconds to run. Each point in Fig. 13(a) corresponds to the first H (non-nil) value for which condition is satisfied (point P in Figs 13(a) and 13(b) corresponds to S = 3). For completeness, both BS 8006-1 (BSI, 2010)–ASIRI (2012) and McGuire (2011) are plotted in Fig. 13(b) as dashed vertical lines. For S = 3, BS 8006-1 (BSI, 2010) and ASIRI (2012) provide an unsafe estimation of the critical height if compared to both McGuire (2011) and the mathematical model proposed herein.
CONCLUSIONS
In this paper, a new mathematical model is presented, for rapidly assessing the evolution with time of both average and differential settlements induced by static loads at the top of pile supported embankments founded on saturated soft soil layers. The mathematical model is representative for the embankment central zone, since it has been conceived for reproducing the mechanical response of an axisymmetric unit cell. It derives from the substructuring of the spatial domain and is based on the concepts of PES, arching and process zone. The employed sub-structuring scheme is very versatile and suitable to be extended to the case of geosynthetic reinforced embankments, rough and floating piles.
The mathematical model offers an improved understanding of the mechanical response of piled embankments. The model is also suitable for evaluating the critical height of the embankment, which was found to be dependent on the relative stiffness of the embankment with respect to stiffness of the foundation soil and on the embankment construction rate.
The novelty of this paper concerns the study of stress-transfer mechanisms from the embankment to the piles, in case of fine-grained soils in the foundation, demonstrating that these are severely influenced by the temporal evolution of pore pressure in the subsoil. In case of embankment constructed under drained conditions, geometrical non-linearities, due to the evolution of the embankment height, influence the evolution of the position of the PES. In contrast, in case of fine-grained subsoils, the construction phase mainly takes place under undrained conditions in the central region of the embankment, without inducing the activation of stress-transfer mechanisms from the embankment to piles. The PES starts evolving, at constant geometry, only when consolidation takes place and, in general, after the embankment construction.
The hypotheses introduced to obtain the FE numerical results, from which the mathematical model is derived, are particularly restrictive (axisymmetric conditions, smooth shaft piles and embankment construction under undrained conditions). For this reason, in addition to validation against a numerical parametric study, the authors employed some experimental data and other numerical analyses taken from the literature to further validate the mathematical model, without pretending to reproduce the measurements perfectly.
The mathematical model allows, once geometry and mechanical properties are assigned, a very rapid estimation of the system performance. In the pre-design stage, once (a) thickness of both embankment and soft soil stratum and (b) their mechanical properties are known, the mathematical model may be employed as a tool to optimise both diameter and pile spacing.
DATA AVAILABILITY STATEMENT
Some or all data, models or code that support the findings of this study are available from the corresponding author upon reasonable request.
ACKNOWLEDGEMENTS
The authors acknowledge Professor Laurent Briançon for his willingness to share important information about the full-scale test. Professor J. Dijkstra and Dr V. Mangraviti gratefully acknowledge the support of the NordForsk project #98335 NordicLink.
REFERENCES
Appendix
Discussion on this paper closes 1 May 2026; for further details see p. ii.
