

The hysteresis observed in a water retention curve was experimentally studied through the use of X-ray micro-computed tomography (μCT). The CT images were acquired during the main drying and wetting processes of a water retention test for uniform sand. The porosity and degree of saturation (Sr) of pore-scale local subsets were calculated using images segmented into soil, water and air phases. The simultaneous distribution of the local porosity and Sr was also analysed to investigate the relationship between the pore size and retained water volume. At similar suction levels, only small pore spaces retained water during wetting, while relatively large pore spaces retained water during drying, demonstrating the ink-bottle effect. At similar saturation levels, the simultaneous distribution was independent of the wetting and drying processes, indicating no significant difference in the water retention state between the two processes. Another image analysis was performed to calculate the principal curvatures of the air–water interface. At similar saturation levels, the calculated curvature of the drying process was greater than that of the wetting process, indicating contact angle hysteresis. The contact angle between the soil particles and water is different at the microscopic level, whereas the water retention states of the two processes are similar.
INTRODUCTION
The water retention characteristics of unsaturated soils are determined by the relationship between suction and saturation and are closely related to properties such as hydraulic conductivity (e.g. Zhou et al., 2014), stiffness and strength (e.g. Albadri et al., 2021). Accurately reproducing these properties is crucial for predicting and assessing unsaturated soil behaviour, and substantial research has been devoted to modelling water retention curves (e.g. van Genuchten, 1980; Fredlund & Xing, 1994; Gallipoli, 2012; Song & Ting-Hao, 2012; Gallipoli et al., 2015; Chen et al., 2019; Kuang et al., 2020; Bate et al., 2021; Lin et al., 2022; Qian et al., 2022) and interpreting water retention phenomena.
To construct a water retention curve, water retention tests are typically conducted and the resulting curve is mathematically expressed. Water retention curves show soil density dependence (e.g. Romero et al., 1999; Gallage & Uchimura, 2010), wetting–drying history dependence (e.g. Haines, 1930; Vachaud & Thony, 1971; Higo et al., 2015; Hong et al., 2016; Kido et al., 2020; Milatz, 2020; Wen et al., 2020) and temperature dependence (e.g. Tang & Cui, 2005; Liu et al., 2022), even for the same material. Previous studies have been conducted on laboratory-scale specimens to interpret conceptually the effects of dependencies on the water retention curve. For example, history dependence – that is hysteresis – of the water retention behaviour has been explained by the ink-bottle effect (e.g. Moro & Böhni, 2002) and contact angle hysteresis (e.g. Blake & Haynes, 1973; De Souza et al., 2008; Chen et al., 2013; Butt et al., 2022).
Modelling and observations of water retention behaviour from a microscopic perspective have been conducted by investigating the retention of pore water in the pore spaces of the soil skeleton (e.g. Gvirtzman et al., 1987; Romero & Simms, 2008). However, further observations and discussions are required to interpret the hysteresis mechanism from a microscopic viewpoint. In modelling, researchers have attempted to construct a water retention curve by analysing a simple soil particle structure that consists of a collection of ideal spheres to determine the number and volume of liquid bridges and whether the voids are filled (e.g. Likos & Jaafar, 2013). Hysteresis in these models is described based on conceptual interpretations provided by laboratory-scale experiments. Interpreting the hysteresis mechanism at the pore scale would aid in modelling the water retention behaviour with hysteresis. In recent studies, X-ray micro- computed tomography (μCT) has been used in microscopic observations, which is a potent tool for visualising pore-scale water retention states. Through image analysis, the pore water and soil skeleton phases can be segmented and then the transition of pore water and pore air morphologies using actual soil is studied (e.g. Higo et al., 2018; Khaddour et al., 2018; Kido et al., 2020; Thakur et al., 2020; Milatz et al., 2022). However, the mechanism of hysteresis requires clarification through the study of changes in the curvature of the air–water interface and the spatial distribution of the pore water and pore spaces. Currently, observation and image analysis techniques to address the above issues, particularly for actual sands, are not available. Some image analysis techniques for estimating contact angle are developed for mainly natural rock cores (e.g. Andrew et al., 2014; Scanziani et al., 2017). For unsaturated granular medias, direct measurement of the interfacial contact angle is successfully performed using X-ray CT images (Manahiloh & Meehan, 2017), in which the material tested was not real sands but glass beads, and the measurements were performed at limited pore spaces on the two-dimensional CT images.
The main scope of this study was to microscopically interpret hysteresis by conducting a water retention test on a sand specimen and performing the image analysis of the CT images obtained. Specifically, the local porosity and degree of saturation (Sr) during the main wetting and drying processes were quantitatively analysed, and the differences in the water retention state at the same suction and global saturation levels were examined. The air–water interface was extracted in three dimensions and then its curvature was calculated. The changes in the curvature of the air–water interface during the wetting and drying processes were compared. The results of these investigations showed water retention behaviour corresponding to the conventionally interpreted ink-bottle hysteresis and contact angle hysteresis, and a microscopic interpretation of the hysteresis in terms of water retention and curvature was provided.
WATER RETENTION TEST WITH X-RAY MICRO-TOMOGRAPHY
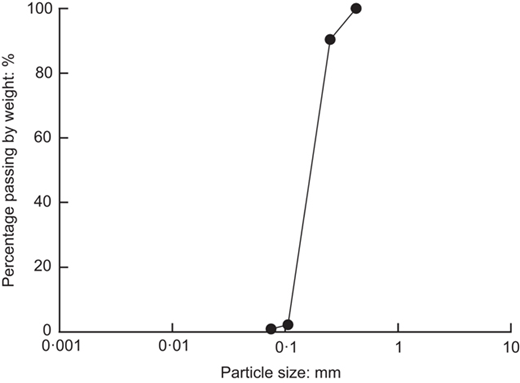
Figure 1(a) depicts the experimental set-up utilised for the water retention test with X-ray μCT (Kido et al., 2020). The sample used in the present study is Toyoura sand, which has a D50 of 190 μm and uniform grain size. Fig. 2 shows a particle size distribution of Toyoura sand, and Table 1 lists the physical properties of Toyoura sand. A water-saturated loose specimen was prepared using the water pluviation technique; the specimen had a diameter of 18·00 mm, height of 17·74 mm, initial porosity of 0·45 and relative density Dr of 42·83%. To control the suction, the negative water column technique (Vanapalli et al., 2008) was employed, which established a water head difference between the top of the specimen and the water level in the burette. The experiment commenced with a drying process, followed by a wetting process, during which several prescribed suction levels, representing water head differences, were applied. It took approximately 1 day until an equilibrium was reached for the studied specimen. Once the water volume change measured by the burette had stabilised at each suction level, X-ray scanning was performed using the X-ray μCT system ‘Kyoto-GEOμXCT (Toscaner-32250μhdk)’ (Kido et al., 2020). As shown in Fig. 1(b), the test featured local tomography, with the central cylindrical volume of the specimen being locally scanned. A CT image obtained in the present study is composed of 1024 by 1024 voxels, and each voxel shows a CT value that has a linear relationship with a material density. The voxel size of the local tomography image was 5·482 × 7·00 μm3, sufficiently small to identify individual soil particles and the pore fluid morphology. Conversely, the spatial resolution of the global tomography, which encompassed the entire specimen, was 21·762 × 25·00 μm3, which was insufficient to perform accurate image analysis, notably regarding the curvature of the pore water–pore air interface.
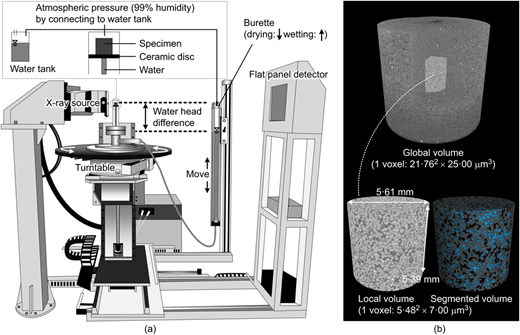
Experimental set-up of the water retention test: (a) test apparatus on the X-ray CT turntable; (b) scanned volume (the centre of the specimen was locally scanned)
Experimental set-up of the water retention test: (a) test apparatus on the X-ray CT turntable; (b) scanned volume (the centre of the specimen was locally scanned)
Physical properties of Toyoura sand
| Particle density: g/cm3 | 2·64 |
| Maximum void ratio | 0·975 |
| Minimum void ratio | 0·614 |
| Average diameter: mm | 0·185 |
| Uniformity coefficient | 1·6 |
| Fines content: % | 0·1 |
The results of the water retention test are shown in Fig. 3, and the fitting curves obtained using the van Genuchten model (van Genuchten, 1980) are displayed. The values of suction for the experiment, shown in Fig. 3, are obtained by the water head differences between the middle height of the specimen and the top of the burette connecting to the bottom of the specimen. A distinct hysteresis was observed, whereby the main drying curve was located above the main wetting curve. At the designated suction levels, denoted by the symbols from ‘a’ to ‘l’ in Fig. 3, the CT images were acquired, and then the local tomography images were segmented into three phases: the soil particle phase, water phase and air phase, using the region growing method (Higo et al., 2014). The three-dimensional (3D) image analysis software VGStudioMax3·1 (Volume Graphics GmbH) was used to perform the region growing, and CT values were converted to grey values that have 16-bit signed integer in the software. In this method, a certain voxel representing the grey value of a phase is initially selected as a seed voxel, and the voxels adjacent to the seed voxel are assimilated into the same phase if their grey values are within the prescribed tolerance limit. This process ensures the continuity of the segmented phase. In the present study, the tolerance of the region growing method was determined by the intersection of the grey value histograms of the phases obtained using the maximum likelihood estimation method, considering the grey value histograms of the voxels related to the partial volume effect in addition to those of the pure-phase voxels (Kido et al., 2020). It was difficult to segment the pore water phase sufficiently using the region growing method because the continuity of the pore water phase was low in the local tomography images obtained at points ‘e’ and ‘i’ where the global Sr is low, as shown in Fig. 3. In contrast, the continuity of the pore air phase was relatively high in the local tomography images obtained at any points where the hysteresis during drying and wetting is discussed in the present study. Therefore, the soil particle and air phases were segmented using the region growing method, and the remaining voxels were considered as the water phase. The validity of the segmentation technique mentioned above was examined in a previous study (Kido et al., 2020).
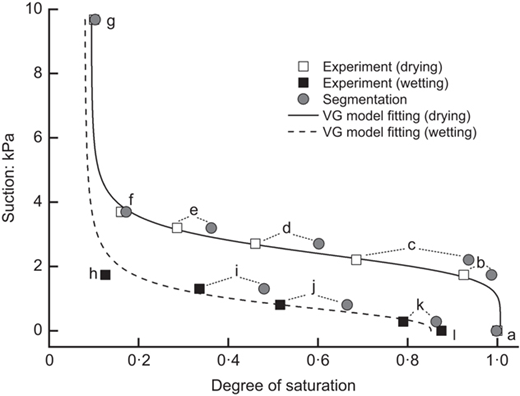
Water retention curve obtained from the experiment and the degree of saturation calculated using segmented volumes (VG, van Genuchten)
Water retention curve obtained from the experiment and the degree of saturation calculated using segmented volumes (VG, van Genuchten)
Figure 4 shows the vertical cross-sectional CT images and segmented images at points ‘c’, ‘d’, and ‘e’ of the drying process, and ‘i’, ‘j’ and ‘k’ of the wetting process. The degree of saturation, Sr, was calculated using the segmented local volume and compared with the measured value of the entire specimen. The calculated local Sr, as shown in Fig. 3, provides a high qualitative representation of the measured water retention curve, although the calculated values are quantitatively greater than the measured values. The partial volume voxels at the particle–air interface may be responsible for the quantitative discrepancy, particularly in the lower saturation regime, despite these artefact voxels being considered in the region-growing segmentation tolerance determination. Another possible reason is heterogeneous distribution of degree of saturation because of the vertical distribution of suction due to gravity. In the higher saturation regime, the scanned local volume retained more pore water than the average volume of the entire specimen, implying that the heterogeneous distribution of pore water in the specimen may be responsible for the quantitative discrepancy. For example, at point ‘c’, immediately after air entry at point ‘b’, the middle of the specimen was saturated because air flowed from the top of the specimen. Nonetheless, at point ‘k’, with almost zero suction, the discrepancy was relatively minor because the trapped air bubbles were homogeneously located in space in such an insular air saturation regime.
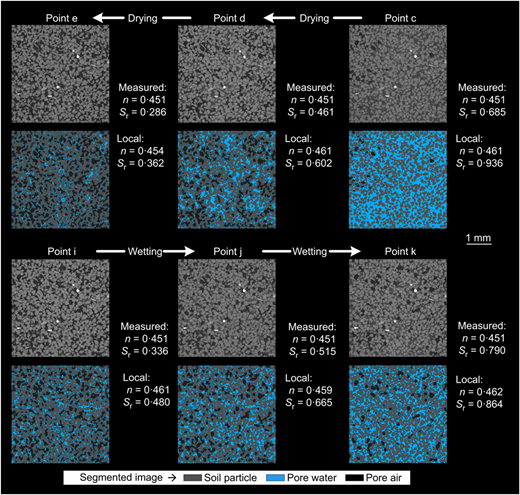
CT images (grey-scale image) and their segmented images. Vertical cross-sectional view of the local volume. The measured porosity and degree of saturation
CT images (grey-scale image) and their segmented images. Vertical cross-sectional view of the local volume. The measured porosity and degree of saturation
At point ‘c’, although most of the pore spaces were filled with water, some air entered certain pores from the top of the specimen. The pore air phase increases as the suction level increases at points ‘d’ and ‘e’. During the wetting process, the pore space gradually filled with water from points ‘i’ to ‘j’ and ‘k’ as the suction level decreased, and trapped air was observed at point ‘k’. In the CT images, the water retention states – namely, the pore water volume, shape and spatial distribution – during the drying and wetting processes at similar saturation levels (points ‘c’ and ‘k’, ‘d’ and ‘j’, and ‘e’ and ‘i’) appears to be significantly different. The differences in volume and spatial distribution are closely related to the local porosity distribution and the degree of saturation. Moreover, the difference in pore water shape can be characterised by the curvature of the air–water interfaces.
DISTRIBUTION OF POROSITY AND DEGREE OF SATURATION
Local porosity and degree of saturation
The porosity and Sr of the local subsets in the segmented images were calculated using the method described by Higo et al. (2018). Fig. 5 presents an overview of the calculation process for the subsets. Reference points were placed at equal voxel intervals in the horizontal and vertical directions of the segmented volumes, and the subsets were considered to be centred on these reference points, as described in Fig. 5(a). Each subset was a 3D subvolume consisting of an arbitrary number of voxels in the horizontal and vertical directions. Fig. 5(b) shows one of the horizontal planes where distributions of local porosity and local Sr are calculated by counting the number of voxels of the soil particle, water and air phases at each subset. From the grey-scale distributions in Fig. 5(b), it seems to be a trend that when the local Sr is low, the local porosity is high.
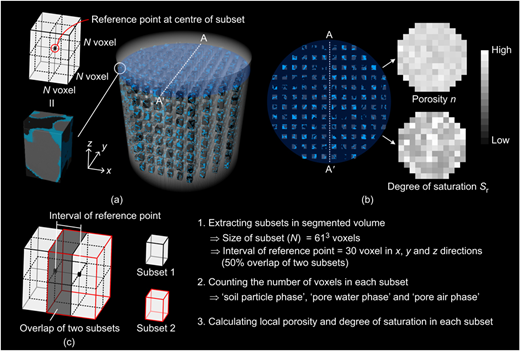
Subsets to evaluate the local porosity and the local degree of saturation. While the subsets overlap in (c), the overlap has been avoided for demonstration purposes in (a) and (b)
Subsets to evaluate the local porosity and the local degree of saturation. While the subsets overlap in (c), the overlap has been avoided for demonstration purposes in (a) and (b)
The effect of the subset size (N) on the local porosity and local Sr was investigated using segmented subsets of points ‘c’, ‘d’ and ‘e’ (Higo et al., 2018). The larger the subset size, the smaller the distribution widths of the local quantities, while the distribution width of the saturation degree is larger than that of the porosity. For example, according to the results for point ‘e’, when the size of subsets varied as N = 413, 613, 813, 1013, the distribution width of porosity (absolute value of the difference between the maximum and minimum local porosity) was 0·45, 0·27, 0·17 and 0·12, and the distribution width of Sr was 0·84, 0·61, 0·39 and 0·28, respectively. In this study, a subset size of N = 61 was employed, in which both the local porosity and Sr exhibited a moderate distribution width to capture the relationships between porosity and saturation degree. The volume of the subset with N = 61 is 334·282 × 427·00 μm3, and each side of the subset is approximately twice the D50 (190 μm) of a Toyoura sand particle. This volume can prevent complete soil particle phase involvement of a single subset, which is supported by the particle size distribution curve, as shown in Fig. 2; thus, the porosity and Sr can be calculated for all subsets. The distributions of N = 41, which is the closest size to the D50, were scattered, while those of N = 81 and 101 were smooth and insufficiently variated to make the inherent characteristics less visible (Higo et al., 2018). The reference point spacing was set at 30 voxels, with approximately 50% overlap between the subsets with the size of N = 61 voxels, as shown in Fig. 5(c). Subsets with no overlap indicate missing information between subsets, whereas those with overlap indicate multiple counts of information at the same position. The overlap contributes to make the measurements smoother, like a moving average. The size and overlap of subsets can be arbitrarily selected to ensure adequate representation of the characteristics being examined. N = 61 voxels and the 30 voxels overlap provide results that are suitable for discussing the distribution of local porosity and the local saturation degree, as in Higo et al. (2018).
Local water retention behaviours in wetting and drying processes
The calculated porosity and degree of saturation of the subsets provided the distributions of each quantity and their simultaneous distributions, as shown in Fig. 6. The porosity exhibited an approximately normal distribution, and the distributions in all the cases were almost identical. The porosity calculated in the subsets represents a local average that loses the inherent non-normal distribution of the pore volume uncovered by the Voronoi tessellation (Higo et al., 2018). Consequently, the distribution approaches normal. Insignificant changes in the distributions at different points indicate that the deformation of the soil skeleton throughout the water retention test was negligible.
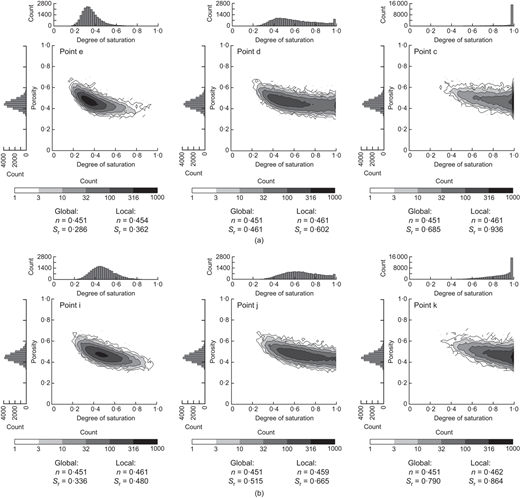
Distributions of local porosity and saturation degree and their simultaneous distributions in the drying and wetting processes: (a) drying process; (b) wetting process
Distributions of local porosity and saturation degree and their simultaneous distributions in the drying and wetting processes: (a) drying process; (b) wetting process
At point ‘c’ of the drying process, where the global degree of saturation is high, most subsets exhibit a degree of saturation of 100%. The degree of saturation of some subsets was less than 100%, and simultaneous distribution showed that subsets with higher porosity tended to be less saturated. At point ‘d’, because the global degree of saturation decreases from that at point ‘c’, the number of subsets with 100% saturation decreases, and the darkest point of the simultaneous distribution, indicating the mode value (value with the highest frequency), is represented by a degree of saturation of approximately 45%. The local Sr is approximately 60%, which is lower than that at the mode value because there are still pore spaces with 100% saturation. At point ‘e’, there were no subsets with Sr = 100%, and the mode value of the Sr distribution was approximately 30%. The distribution of Sr was asymmetric with respect to the mode value, indicating that the subsets with high water retention persisted. The porosity of the subsets with a high Sr was relatively low. In contrast, subsets with higher porosity tended to be less saturated, and this trend remained consistent from point ‘c’ to point ‘e’, being particularly pronounced at point ‘e’.
At point ‘i’ of the wetting process, the modal value of the degree of saturation was approximately 45%, and Sr was widely distributed from 20 to 80%. At point ‘j’, the distribution of Sr widened, with subsets of 100% saturation appearing, whereas the others had saturation levels of approximately 30%. At point ‘k’, where the suction was almost zero, the number of subsets with 100% saturation was significantly higher. At all three points, the degree of saturation of the subsets with lower porosity was higher, indicating that smaller pore spaces were more easily saturated than larger ones.
Generally, the simultaneous distribution of Sr and porosity results in lower water retention in portions with higher porosity and higher water retention in portions with lower porosity. During the drying process, portions with higher porosity were desaturated at a lower suction level, whereas portions with lower porosity retained water at higher suction levels. During the wetting process, portions with lower porosity began to retain water, followed by portions with higher porosity. This result is consistent with the common knowledge that the smaller the porosity, the higher is the water retention capability (e.g. Fredlund & Rahardjo, 1993).
Water retention state in the drying and wetting processes at similar global saturation and suction
After comparing the Sr distribution and simultaneous distribution of similar global degrees of saturation at points ‘c’, ‘d’ and ‘e’ in the drying process, and points ‘k’, ‘j’ and ‘i’ in the wetting process, respectively, it was found that the distributions are similar. The porosity distribution is similar to a normal distribution, and its tendency is consistent at different stages of global degree of saturation. In contrast, the tendency of the Sr distribution changes as global Sr changes. At the high global saturation regime (points ‘c’ and ‘k’), the local values concentrate on approximately 1·0 of Sr. The Sr distributions at the intermediate global saturation regime (points ‘d’ and ‘j’) and the low global saturation regime (points ‘e’ and ‘i’) are similar to a log-normal distribution and a normal distribution, respectively. Although the distribution type transitions with the global degree of saturation, the distribution type is similar for both the wetting and drying processes at the similar global saturation. It should be noted that the spatial distribution of the retained water is significantly dependent on the drying–wetting history, as shown in Fig. 4. The pore air flow path during the drying process from the top and the pore water flow path during the wetting process from the bottom may be different. Nevertheless, the volume of water retained by any pore space size is determined once the overall amount of pore water is determined, regardless of the wetting and drying processes. This could be a natural outcome because the water retention state is determined by the hydrogen bonding and the hydrophilic nature of the soil, which are unique for a material. The difference in the water retention states between the drying and wetting processes, given similar global saturation, lies only in the suction level – that is, the morphology of the pore water – which is discussed later using curvature analysis.
The Sr and simultaneous distributions were significantly different at point ‘c’, just after the air entry point in the drying process, and point ‘i’, just after the water entry point in the wetting process, despite the two points having relatively close suction levels. At point ‘c’, subsets with relatively large porosities were fully water-saturated, whereas at point ‘i’, the degree of saturation of subsets with large porosities was low, and subsets with high saturation degrees were limited to those with small porosities. This result is consistent with the ink-bottle effect (e.g. Lu & Likos, 2004).
CURVATURE OF AIR–WATER INTERFACES
Principal curvature analysis
The suction level of unsaturated soils can be expressed using the principal curvatures of the air–water interface
where s is the suction; T is the surface tension of the water; and and are the principal radii of curvature. In this analysis, the water phase was extracted from the segmented images, and the curvature of the interface with the air phase was calculated to quantify the curvature of the air–water interface. The extracted air–water interface includes a water film that adheres to the soil particles, but its curvature does not contribute to the suction expressed by equation (1). Therefore, it is necessary to remove the water film from the extracted air–water interface image. One-voxel erosion–dilation image processing was performed before calculating the curvature of the air–water interface to achieve this goal. The water film in the CT images is mainly caused by artefact voxels of one-voxel thickness, in which the soil particles and air phases are mixed, owing to the intrinsic error in the X-ray CT image. Although water physically exists on the soil particle surface, the thickness of the absorbed water is generally smaller than the voxel size of this study (5 to 7 μm), and thus it is omitted by the one-voxel erosion. Erosion removes one voxel from the boundary surface of the water phase, which removes the water film and the surface of the water phase. Subsequent one-voxel dilation is the expansion of the surface of the water phase after erosion by one voxel. The water phase regains its original shape, whereas the water film, which was one voxel thick, is not restored by the dilation because it was lost in the erosion process.
Using the segmented volume and image processing described above, the interface surfaces between the water and gas phases were extracted, and their maximum principal curvatures were calculated. In general, the surface curvature is calculated using the second fundamental form (Kreyszig, 2013), which is represented by a symmetric two-by-two matrix known as the curvature tensor. The eigenvalues κ1 and κ2 of the matrix correspond to the maximum and minimum principal curvatures, respectively. In the image analysis, the air–water interface is meshed using triangular elements, and the maximum principal curvature is obtained by solving the second fundamental form of each triangular element. An approximate solution is obtained through the method of least squares, minimising the error between the maximum principal curvature of the triangular element under calculation and its neighbouring triangular elements. This process is performed for all triangular elements comprising the surface. In the present study, only the maximum principal curvature, 1/, was calculated using the curvature calculation algorithm implemented in the 3D image-processing software Avizo 9·4·0 (FEI). The theory implemented in the software was used to obtain an approximation of the solution. For further details regarding the curvature calculation algorithm implemented in the software, please refer to the literature (Rieger et al., 2004). When evaluating the suction level, 1/ was not considered because it is approximately 100 times smaller than 1/ when assuming a liquid bridge at the contact of two ideally spherical particles (Kido & Higo, 2020).
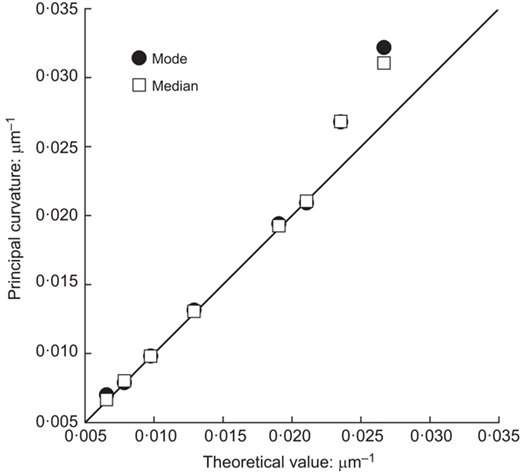
Figure 7 shows the results of the curvature analysis verification. The sphere was discretised using voxel pseudo-images at various resolutions, and the curvature was calculated accordingly. The lowest resolution was attained when the diameter of the sphere was represented by 15 voxels, while the highest resolution was achieved when the diameter was represented by 61 voxels. The distribution of curvature for all triangles analysed showed that the mode values are indicated by solid marks, while open marks indicate the median values. The theoretical curvature value obtained from the diameter of the spheres, 1/, is in reasonable agreement with the calculated curvature for spheres with a diameter of up to 19 voxels, which is approximately 0·022 μm−1. It is possible for the spheres with diameters of 15 voxels and 17 voxels that non-spherical shape and the smaller number of triangular elements lead to the lack of agreement between the values of calculated curvature and theoretical curvature.
Principal curvature in wetting and drying processes
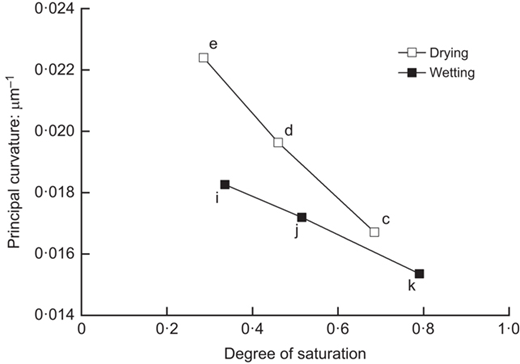
Figure 8 shows the principal curvature obtained from the curvature analysis of the CT images obtained during the water retention test. For each plot shown in this figure, the median of the principal curvatures for all triangular elements is determined as the curvature of the air–water interface since a histogram of the curvatures obtained by the curvature analysis is similar to the log-normal distribution. The maximum principal curvature was 0·022 μm−1 at point ‘e’. This value corresponds to the upper limit of the range where the theoretical and calculated values coincide, as shown in Fig. 7. All analytical results presented in Fig. 8 fall within this range.
Changes in the principal curvature of the water–air interface during the wetting and drying processes
Changes in the principal curvature of the water–air interface during the wetting and drying processes
At a similar degree of saturation, the principal curvatures at points ‘c’, ‘d’ and ‘e’ during the drying process were greater than those at points ‘k’, ‘j’ and ‘i’ during the wetting process, respectively. This is consistent with the fact that the suction of the drying process is greater than that of the wetting process at the same saturation level, as observed in the water retention curve. However, when point ‘i’ is compared with point ‘c’ and point ‘j’ is compared with point ‘c’, a discrepancy arises, where the principal curvature is greater at point ‘i’ and point ‘j’, respectively, despite the suction being greater at point ‘c’ in the water retention curve. It should be noted that the lower the saturation, the greater the estimated suction tends to be when evaluated without considering , as in this analysis, because the lower the saturation, the smaller . This may be the primary reason for the discrepancy between points ‘c’, and points ‘i’ and ‘j’, which warrants further study on quantification of . Nevertheless, when compared at approximately similar saturation levels, such as points ‘e’ and ‘i’, points ‘d’ and ‘j’, and points ‘c’ and ‘k’, the suction is greater during drying than during wetting because the influence of does not affect the relative evaluation.
Principal curvature at the same global saturation
At equivalent saturation levels, the curvature observed during the drying process exceeded that observed during the wetting process. This indicates that, at a microscopic level, there is a difference in the contact angle between soil particles and water, despite a similar distribution of pore water volume. This phenomenon can be attributed to contact angle hysteresis.
It is widely recognised that, in a small tube filled with water, the contact angles during drying and wetting vary, indicating that the particle–water contact is in a metastable state due to wettability of the tube. It has been shown theoretically by the local minimum in the Gibbs energy that the receding and advancing contact angles on heterogeneous surfaces differ due to the metastability (e.g. Marmur et al., 2017). Similarly, the contact between soil particles and water is considered metastable, due to the roughness and heterogeneity of the particle surface.
CONCLUSIONS
The aim of the present study is to interpret the mechanisms underlying the macroscopic hysteresis of the water retention curve from a microscopic perspective, based on observations of the main drying and wetting processes of the soil. Micro-CT was used for the microscopic observations, and Toyoura sand, a uniform sand suitable for this purpose, was used as the material. Two image analyses were performed on the acquired images, which were segmented into water, soil and air. The first analysis was performed to obtain simultaneous distributions of local Sr and local porosity to investigate which pore volumes retain water. The second analysis involved a curvature analysis of the water–air interface to determine the curvature of the pore water meniscus.
The main conclusions of the study are as follows. First, the simultaneous distributions of local Sr and porosity show that portions with higher porosity exhibit lower water retention, while portions with lower porosity exhibit higher water retention. During the drying process, portions with larger porosities drain more easily, whereas portions with smaller porosities maintain water retention. During the wetting process, small pore spaces retain water first, followed by large pore spaces. Second, comparing the simultaneous distributions at the same saturation level, they were almost the same for both the wetting and drying processes. This implies that, for the same macroscopic saturation, the size of the pore space in which water is retained is the same for both the drying and wetting processes. Although the spatial distribution of pore water was not compared, once the macroscopic amount of water was determined, the amount of water retained in pore spaces of any size was found to be independent of the drying–wetting history. Third, a comparison of the simultaneous distributions at similar suction levels showed that numerous large pore spaces retained water during the drying process, whereas only small pore spaces retained water during the wetting process. This is consistent with the ink-bottle effect, which has long been used to explain hysteresis.
Fourth, the curvature analysis proposed in this study can accurately assess the curvature of spherical surfaces in X-ray CT images at the spatial resolution used in this study. The curvature analysis was applied to the experimental results to compare the curvature of the air–water interface between the wetting and drying processes. The curvature was found to be larger for the drying process than for the wetting process, which was consistent with a larger macroscopic suction. Finally, through the comparison of the two simultaneous distributions of the drying and wetting processes, where the degrees of macroscopic saturation were similar to each other, it can be concluded that there is no significant difference in the water retention state. This indicates that the size of the pore space where water is retained is the same for both the wetting and drying processes. However, hysteresis occurs due to the different curvatures of the retained water, which is contact angle hysteresis. The meniscus is not in a perfect equilibrium state, even after sufficient time has elapsed, and the contact angle is different when water is absorbed and drained, depending on particle material and surface heterogeneity. As these factors are always present in natural materials, hysteresis is also always present.
The ink-bottle effect and contact angle hysteresis, which have been conceptually understood as factors in the hysteresis of water retention properties, were actually observed using X-ray CT and were demonstrated using pore-scale local quantities provided by the original image analyses. At the same suction level, the hysteresis can be interpreted by the ink-bottle effect, which depends on the size and network of pores, consistent with the previous conceptual understanding. At the same macroscopic saturation level, the hysteresis can be interpreted by the difference in the contact angle between the soil particles and water – that is, contact angle hysteresis, without significant difference in water retention state. These findings could be a physical background to the modelling of water retention characteristics considering hysteresis. For further microscopic interpretation of hysteresis, it is important to study the local drying and wetting behaviour for each pore. This needs to divide individual pore spaces three-dimensionally and observe drying and wetting behaviour in every pore space and the interaction of the water retention behaviours with neighbouring pore spaces in the future.
ACKNOWLEDGEMENTS
This study was partly supported by a JSPS Fellows Grant-in-Aid (17J06250) and a JSPS KAKENHI Grant-in-Aid (19H05509). The authors express their sincere gratitude to Mr Ryoichi Morishita and Mr Fukushi Takamura, former students of Kyoto University, for their help in acquiring the X-ray CT data.
REFERENCES
Discussion on this paper closes 1 May 2026; for further details see p. ii.
