
In this study, the one-dimensional thermo-mechanical behaviour of three types of peat with different natural water contents was investigated, under a variety of thermo-mechanical loading paths, to establish a rational phenomenological interpretation of their responses. The results from temperature-controlled incremental loading and constant-rate-of-strain and consolidation tests suggest that a unique effective stress–volumetric strain relationship exists at a given set of viscoplastic strain rate and temperature, or ‘isothermal isotaches’ exist. The coefficient of thermo-plastic compression and the coefficient of secondary consolidation were jointly adopted to describe the simultaneous temperature and strain-rate dependency of peats. Their ratios to the compression index are largely unique regardless of the type of peats. The test results indicate that testing peats in a laboratory (20–25°C) can lead to an underestimation of the in situ (∼10°C) yield stress by about 30%. The potential temperature dependency of the coefficient of secondary consolidation, , was reappraised by redefining the coefficient within the framework of the isotache concept. The test results show that is only slightly dependent on temperature.
NOTATION
compression index defined by void ratio and common logarithm of stress
coefficient of secondary consolidation defined by void ratio and common logarithm of stress
coefficient of thermo-plastic compression defined by void ratio and temperature
coefficient of thermo-plastic compression defined by natural strain and temperature
linear coefficient describing the temperature dependency of the coefficient of secondary consolidation
void ratio
initial void ratio
viscoplastic component of void ratio
viscoplastic void ratio change rate
ignition loss
temperature
reference temperature
elapsed time
time corresponding to the 90% average degree of consolidation
time corresponding to the end of primary consolidation
natural water content
coefficient of thermal expansion
measured excess pore water pressure at the undrained end of specimen
stress increment in incremental consolidation tests
offset of isotherm from a reference one with temperature variation
engineering (Cauchy) volumetric strain
viscoplastic component of engineering (Cauchy) volumetric strain
viscoplastic engineering (Cauchy) volumetric strain rate
natural volumetric strain
elastic component of natural volumetric strain
viscoplastic component of natural volumetric strain
natural volumetric strain rate
natural volumetric strain rate corresponding to
viscoplastic natural volumetric strain rate
swelling index defined by natural strain and natural logarithm of stress
compression index defined by natural strain and natural logarithm of stress
coefficient of secondary consolidation defined by natural strain and natural logarithm of time
at a given temperature
density of soil particle
yield stress obtained from laboratory test
in situ yield stress
total vertical stress
effective vertical stress
INTRODUCTION
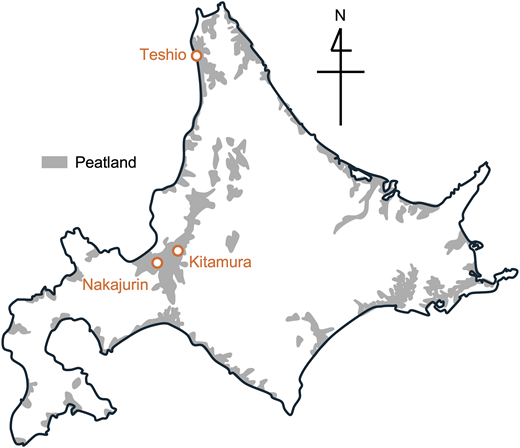
Peats are common in cold regions and south-east Asian regions (i.e. tropical peats). The historically stable peatlands are currently subject to temperature changes due to various mechanisms. The temperature in the subsurface layer in cold regions will vary due to the permafrost degradation driven by global warming over future decades. The use of geothermal energy is also becoming more common over recent years even in cold regions (Mohamad et al., 2021). The related energy infrastructure, such as energy piles and pipelines, can change the temperature of the surrounding ground. For instance, a real-scale test by Van Lysebetten et al. (2017) showed that the use of an energy pile caused temperature changes in the ground; the temperature at 5 m depth and 0·5–2·5 m apart from the pile, where peat existed, was 20°C if 40°C was imposed at the heat exchanger inlet, and it was 12°C if −4°C was imposed. In south-east Asian countries, rapid urbanisation is occurring. Marshall et al. (2018) point out that constructing key infrastructure such as roads and airports on tropical peatland is inevitable considering its widespread distribution in those areas. The construction of roads and airports can change the temperature in peatland by lowering the surface albedo and increasing the surface thermal diffusivity with pavement. Even upon sampling and storage, peats are subjected to temperature changes due to the difference between the ground temperature and over-ground temperature. The temperature at 3 m depth is, for example, constant around 10°C in Hokkaido, Japan (Kyuma, 1985), and that in the laboratory is usually 20–25°C (e.g. Mesri & Ajlouni, 2007), although special care is sometimes taken to prevent the degradation of peats (e.g. 10°C for the storage to avoid peat degradation and 14°C for the triaxial test in Muraro & Jommi (2021)). Concerns about peats’ response against these environmental changes motivate the study of their thermo-mechanical characteristics.
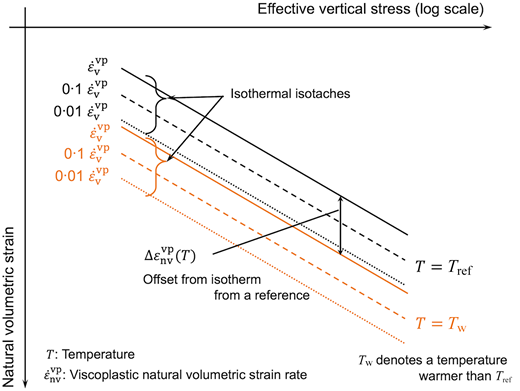
Previous studies on the temperature effects on clays and peats (Hueckel & Baldi, 1990; Towhata et al., 1993; Boudali et al., 1994; Fox & Edil, 1996; Oikawa & Ogino, 2001 (for peats); Cekerevac & Laloui, 2004; Marques et al., 2004; Abuel-Naga et al., 2006, 2007; Tsutsumi & Tanaka, 2012; Li et al., 2018; Chen et al., 2023 (for clays)) have consistently demonstrated the irreversible compression, or mechanical softening, upon heating. A promising approach to understand the thermo-mechanical behaviour of soil is an extended isotaches approach. Isotaches are a set of the effective stress–strain relationships, each of which represents a particular viscoplastic volumetric strain rate and is parallel to others. The idea of the extended isotaches implies the existence of different isotache sets at different temperatures, which the authors term ‘isothermal isotaches’ in this paper (Fig. 1). While several studies (Boudali et al., 1994; Yashima et al., 1998; Leroueil, 2006; Laloui et al., 2008) have reported the success of the isothermal isotaches approach in describing the thermo-mechanical behaviour of normally consolidated clays, its applicability for peats remains unexplored.
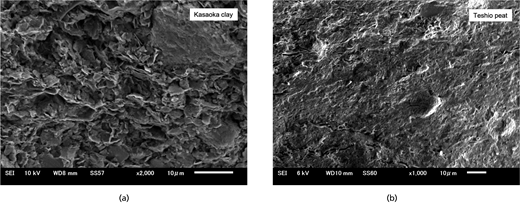
Casarella et al. (2020) proposed a microscopic interpretation of the thermo-mechanical behaviour of clays based on the Derjaguin–Landau–Verwey–Overbeek (DLVO) theory, explaining the thermal softening as the collapse of the structural arrangements observed in clays due to the plate-like shape of its particles because of the increase in the repulsive electro-chemical forces upon heating. Such a structure seen in a commercial clay called Kasaoka, whose liquid limit is 56% and plastic limit is 27%, is shown in Fig. 2. Although the macroscopic thermo-mechanical behaviour of peats, as seen in the previous studies (Fox & Edil, 1996; Oikawa & Ogino, 2001), resembles that of clays, a comparable microscopic understanding is lacking for peats. Peats consist of peds composed of humic substances, or amorphous flocculation of partially decomposed organic matters, which does not form plate-like shapes unlike the silicate structures found in clays. Hence, their structures do not exhibit the structural arrangements, as evident in the scanning electron microscope image of Teshio peat (Fig. 2). The fundamental properties of Teshio peat are available in Table 1. Its sampling site is the Teshio area in Hokkaido, Japan, as shown later in Fig. 4. The difference in microscopic structure between clays and peats necessitates thorough investigations into the thermo-mechanical behaviour of peats.
Scanning electron microscope image of freeze-dried clay and peat (observation surface was made by cracking the quick-frozen sample)
Scanning electron microscope image of freeze-dried clay and peat (observation surface was made by cracking the quick-frozen sample)
Engineering properties of peat samples
| Natural water content, | Ignition loss,* | Density of soil particle, | Von Post scale,† | Initial yield stress, ‡ | |
|---|---|---|---|---|---|
| Nakajurin | 800–940 | 94–96 | 1560–1580 | H2 | 12–18 |
| Kitamura | 260–340 | 25–35 | 2010–2200 | H5 | 17–25 |
| Teshio | 1090–1170 | 90–91 | 1380–1480 | H7 | 10–15 |
* JIS A 1226 (Japanese Standards Association, 2009) is available for its definition
† The Von Post scale is a visual classification system used to assess the degree of peat decomposition, consisting of ten classes from H1 to H10, where H1 represents the least decomposed peat and H10 represents the most decomposed (Rezanezhad et al., 2016)
‡The values are determined from N-, K- and T- IL-3, respectively, under 24°C, and can vary depending on the strain rate and temperature. The temperature is 24°C and the strain rates taken here are in order of 10−7 to 10−8 (/s)
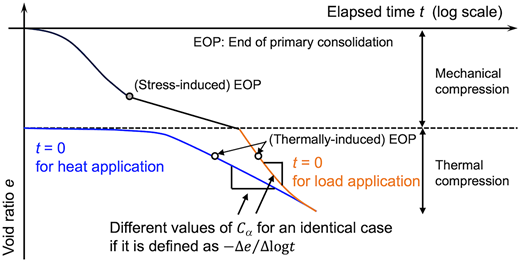
Another challenge in addressing the thermo-mechanical behaviour of peats is the absence of a rigorous standard to determine the coefficient of secondary consolidation, , after temperature changes. It is typically defined as the slope of the e–logt (where e is the void ratio and t is the elapsed time) curve after the end of primary consolidation (= EOP), or ( is the time corresponding to the end of primary consolidation). Note that EOP only denotes the full dissipation of the excess pore water pressure, and hence refers to both mechanical and thermal loading. The definition, however, may yield different values of since can change depending on the way the origin of is defined. Referring to previous studies (e.g. Fox & Edil, 1996; Oikawa & Ogino, 2001; Chen et al., 2023), two ways are possible: resetting t to 0 upon heat application or not, for plotting the consolidation curve (Fig. 3). The comparison of the two curves in Fig. 3, namely, the upper one where t = 0 for load application and the lower one where t = 0 for heat application, illustrates that can be temporarily large if t = 0 for load application. An evaluation method which uniquely determines the value of the coefficient of secondary consolidation is essential for discussing the temperature effect on the long-term behaviour of peats.
The present study investigated the one-dimensional thermo-mechanical behaviour of peats, with oedometer tests under various thermo-mechanical conditions. Three types of peats were used to comprehensively understand their thermo-mechanical characteristics. The experimental results will be analysed by taking note of the dependency of the peats’ behaviour on volumetric strain rate and temperature to assess the applicability of isothermal isotaches. To eliminate the arbitrariness in its determination, the coefficient of secondary consolidation is redefined by volumetric strain and its rate, rather than by the elapsed time.
TESTED MATERIALS
In undisturbed peats, the natural water content is not merely a state variable but a more inherent parameter reflecting their material characteristics and formation history (Oikawa, 1987; Abe et al., 2022). It is, for example, closely correlated with the ignition loss, an approximate measure of organic content. The ignition loss, , was measured according to JIS A 1226 (Japanese Standards Association, 2009). For this reason, the mechanical response of peats greatly differs depending on their natural water contents. It is therefore important to examine multiple types of peats with natural different water contents to establish the general understanding of peat behaviour. This study used three types of peats with different natural water contents; Nakajurin, Kitamura and Teshio, named after their sampling sites (Fig. 4). Table 1 shows their basic engineering properties.
Sampling sites of peats used in this study, Hokkaido, Japan
(peatland distribution after CERI (2017))
Sampling sites of peats used in this study, Hokkaido, Japan
(peatland distribution after CERI (2017))
The samples were collected from 1 m below the surface for Teshio and Nakajurin and 2 m below the surface for Kitamura, and the groundwater level observed in a borehole was around 0·3 m below the ground level for Teshio and Nakajurin, and around 1 m below the ground level for Kitamura during sampling. This suggests their saturation. The sampling was done by vertically hammering acrylic tubes with 8°-tapered edge (inner diameter = 76 mm, height = 140 mm and thickness = 4 mm) into the soil. Although the tubes were thicker than usually adopted for clays, their influence on the sample disturbance would be small due to their tapered edge and short length, as suggested by a previous study (Yamazoe et al., 2023), which suggests that the water content values after sampling with a similar thick-walled but tapered sampler and a Japanese standard 1·5 mm thick tapered wall sampler were almost the same. The tubes were sealed airtight and covered with aluminium foil for preventing exposure to lights. They were stored in a 24°C room. Although the storage temperature may not be ideal in terms of the prevention of degradation, the airtight condition lessens biodegradation. Fox & Edil (1996) reported the ash content of peats remained unchanged before and after consolidation tests, some of which lasted around 1 year under elevated temperatures (20–70°C), supporting the idea that the potential degradation of peats would be minimal. Specimens for one-dimensional consolidation tests (diameter = 75 mm, height = 27 mm) were taken by cutting off from the tube samples. Considering that the fibre in peats tends to twine around the cutter upon trimming, this preparation without trimming the sample side avoids further disturbance.
TEMPERATURE-CONTROLLED CONSOLIDATION TESTS
Equipment
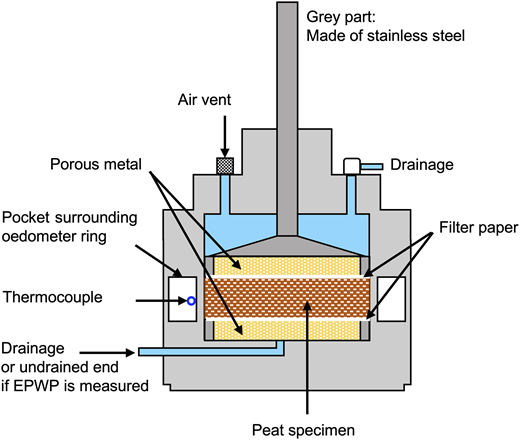
The one-dimensional consolidation tests were conducted by using a closed-cell-type oedometer, as shown in Fig. 5. Two types of tests were conducted: incremental load (IL) tests and constant-rate-of-strain (CRS) tests. In some cases of the IL tests and in all the CRS tests, the excess pore water pressure (EPWP) was measured at the lower end of the specimen by closing the bottom drainage line. For the other cases, the drainage was two-way. In the CRS tests, the average effective vertical stress was determined by equation (1), which assumes a parabolic distribution of EPWP in the vertical direction (Moriwaki & Umehara, 2003).
where is the total vertical stress and is the excess pore water pressure measured at the undrained end. A back-pressure of 100 kPa was applied for saturation of specimens only in the CRS tests, by way of a long tube with de-aired water. The drainage line was also deliberately set long ( 600 mm), such that the peat specimen was tested under anaerobic conditions, just as typically expected in situ, for the test duration.
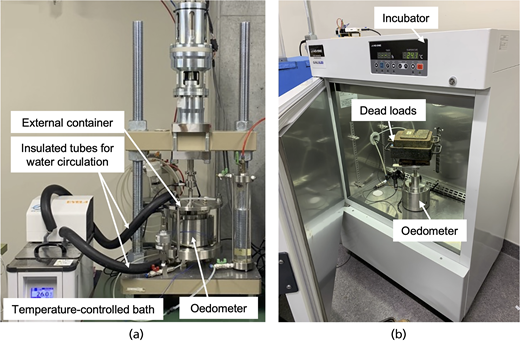
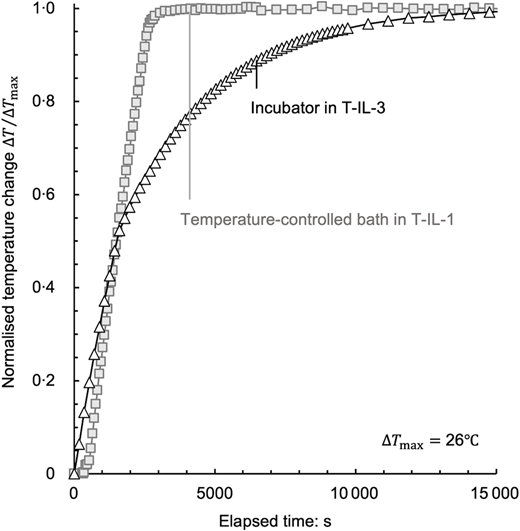
The specimen temperature was controlled during the tests by using two systems, both of which have similar capabilities to keep temperature. Fig. 6(a) shows the CRS test apparatus, comprising an external container surrounding the oedometer cell and a temperature-controlled bath with pumping function. The temperature of specimens was controlled indirectly by circulating the water from the temperature-controlled bath into the external container through insulated tubes. The other system adopted an incubator, in which the same oedometer as above was placed (Fig. 6(b)). The temperature change of a specimen was achieved by controlling the air temperature in the incubator. The temperature was measured by a thermocouple placed on the outer surface of the oedometer ring during the test. The measured temperature reached its predefined value in about an hour with the temperature-controlled bath and in about 3 h with the incubator (Fig. 7). The specimen core temperature, however, lagged due to heat transfer through the oedometer ring and the specimen itself. Numerical simulations on the thermal conduction were performed to estimate the delay (see Appendix 1 for details). The simulations show that, if the device with temperature-controlled bath is used, the specimen core temperature reaches the prescribed value in an hour after the measured (surface) temperature reaches the same value (see Appendix 1, Fig. 27(a)), and with the incubator, the time lag in heat transfer is insignificant as the environmental temperature change nears completion, as seen in Appendix 1, Fig. 27(b), due to the slower temperature change rate. The subsequent discussion focuses on the behaviour after EOP, where the effective stress and temperature are at equilibrium. Appendix 2 includes a simple data analysis determining the time corresponding to EOP after a temperature rise.
The influence of temperature on the displacement measurements was minor. The error due to the sensor offset and machine thermal compliance was −0·016 and + 0·03 mm, or the axial strain , during cooling to 10°C and heating to 50°C from 24°C, respectively, without a specimen in place. It is also expected that the influence of thermal deformation of the oedometer ring (i.e. deviation from K0 condition upon heating) will be minimal. Assuming the linear thermal expansion theory, the radial strain of the ring can be described as ( is the coefficient of thermal expansion of stainless steel and is the temperature change). Introducing the typical value of for the ring, or the stainless steel, being 1·0 × 10−5 (/°C) (after Makarenko et al., 2023), and the maximum temperature change during the tests, = 40°C, gives 0·0004. Considering the axial strain occurring after heating peats, which reached around 0·15, these thermal effects on measurements can be ignored. In other words, it is reasonable to consider the K0 condition even after temperature changes.
Test programme
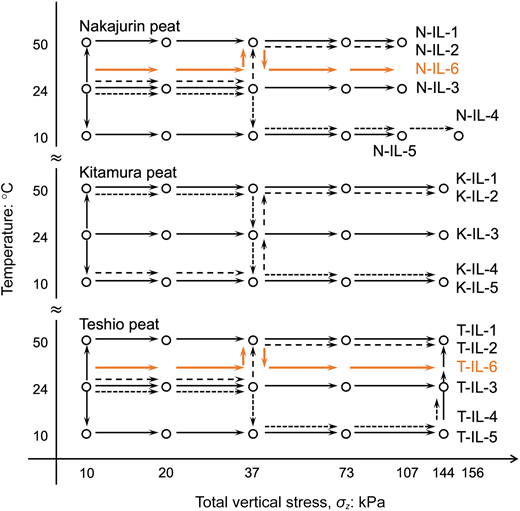
The test programme including a variety of thermo-mechanical paths was designed, combining the IL and CRS conditions, to examine a variety of stress and temperature history. The adopted temperatures were 10, 24 and 50°C. The programme primarily featured IL tests: N-, K-, T-IL series. The total stress set was 10, 20, 37, 73 and 107 kPa for N-IL and 10, 20, 37, 73, and 144 kPa for K- and T-IL series; 156 kPa was applied in addition after 107 kPa in N-IL-4. Th test paths share the common initial consolidation stage by 10 kPa at 24°C, to lessen the impact of the preceding history, such as a temperature change which each sample may have experienced in situ and during storage, and accordingly, to ensure a fair comparison. The loading paths for these series are summarised in Fig. 8. They include three segments: (a) incremental loadings under a constant temperature; (b) temperature increase during the secondary consolidation at 10, 37 or 144 kPa; and (c) temperature decrease at 10 or 37 kPa. K-IL-2 and 4 include the consecutive heating (10→24→50°C) and cooling (50→24→10°C) stages. In N- and K-IL-series, each stage continued until the compression rate reached a predefined value (1·0 × 10−7 (/s) for N- and 5·0 × 10−8 (/s) for K-IL series) beyond the EOP, which took around 5 days. Here, denotes the viscoplastic natural volumetric strain rate (defined later). Only T-IL series adopted 24 h for each stage.
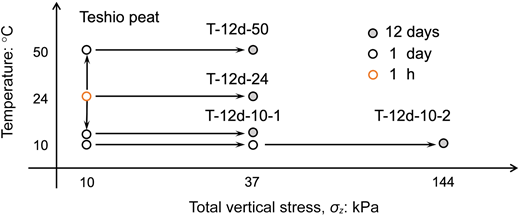
The 12 day consolidation tests were performed with Teshio peat: T-12d series. The specimen was first consolidated at 10 kPa, with a subsequent temperature change, if necessary. The specimen was then loaded with a constant pressure of 37 kPa for 12 days under the three temperatures. For T-12d-10-2, the applied load for 12 days’ consolidation was 144 kPa. The loading paths are shown in Fig. 9.
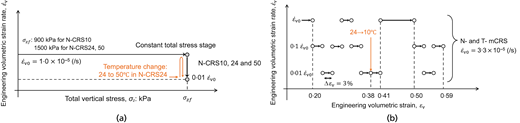
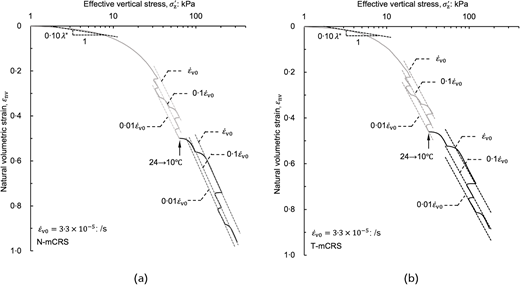
The constant-rate-of-strain (CRS) test was performed for Nakajurin: N-CRS series paths are shown in Fig. 10(a). The control variable was the engineering (Cauchy) volumetric strain rate, (: is the current height of the specimen and is the initial height of the specimen). In N-CRS10, 24 and 50, the specimen was compressed with of 1·0 × 10−5 (/s) under a constant temperature of 10, 24 and 50°C until reached a predefined value (= 900 kPa for N-CRS10, and 1500 kPa for N-CRS24 and 50), and was held constant to observe the creep at these high stress levels. Afterwards the specimen in N-CRS24 was heated (24→50°C). The multi-stage CRS tests, where the strain rate changed step by step during the test, as shown in Fig. 10(b), were also performed on Nakajurin and Teshio peats (N-mCRS and T-mCRS). The temperature was changed (24→10°C) at around of 38% keeping CRS operation in the tests. The temperature equilibration was complete within this single strain-rate stage.
DEFINITION OF STRAIN AND FUNDAMENTAL PARAMETERS
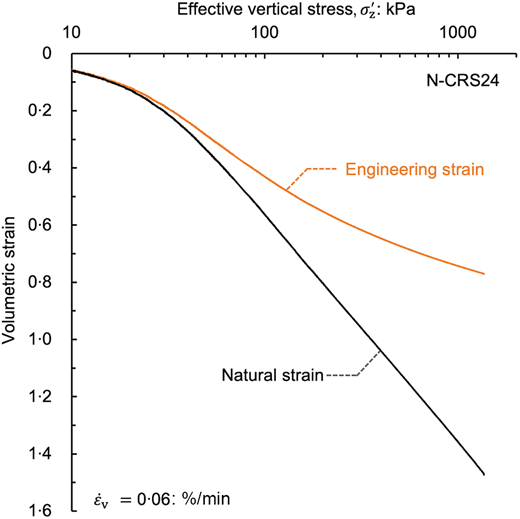
Butterfield (1979) and Oikawa (1987) reported that the linearity of the (e is void ratio) or the curve does not hold when a large volume change occurs. They also show that the introduction of ( ), or the natural strain, in place of removes the non-linearity in the log scale. The natural strain, , is defined by equation (2).
The result of N-CRS24 is plotted against engineering and natural strains in Fig. 11. The effective stress–volumetric strain relationship holds its log-linearity even at higher stress levels (∼1500 kPa) when the natural strain is used. With this advantage, the natural strain, , will be mainly used in this paper to describe the volume change of peats.
The fundamental mechanical parameters, the compression index and the coefficient of secondary consolidation, are typically defined by void ratio and the common logarithm of stress as follows.
where is the viscoplastic component of void ratio. Here, during the secondary consolidation. They can take another form if defined by the natural volumetric strain and natural logarithm as follows.
where is the viscoplastic natural volumetric strain. Here, during the secondary consolidation. The derivative of equation (2), , and the relationship between and , , interrelate the redefined mechanical parameters with the conventional small-strain parameters as:
Here, is the initial void ratio. With equations (7) and (8):
The coefficient of secondary consolidation is now to be defined in the form not including the elapsed time. From the definition of and , the following relationships are gained:
where the dot indicates time derivative. Assuming and are constant with time (Mesri et al., 1997), , and are inversely proportional to . Hence, and , leading to the following description of and :
Because the shape of and can change depending on the way the elapsed time origin is taken, as mentioned earlier (Fig. 3), equations (4) and (6) may result in arbitrary determination of and . Not including , equations (12) and (13) overcome the problem and uniquely define the values based just on increments. Taking this advantage, equations (5) and (13) will be the primary definition of the compression index and the coefficient of secondary consolidation, respectively, in this paper. The swelling index is also defined by the natural volumetric strain and natural logarithm as follows.
where is the natural elastic volumetric strain.
TEMPERATURE EFFECTS ON ONE-DIMENSIONAL COMPRESSION OF PEATS
Thermal compression of peats
The peat specimens underwent heating or cooling in the middle of secondary consolidation. The resulting behaviour is shown in Fig. 12 for heating and Fig. 13 for cooling, along with the EOP. They are plotted against both the elapsed time, with its origin corresponding to the stress application (20→37 kPa), and the volumetric strain rate. The arrows indicate the starts of temperature change.
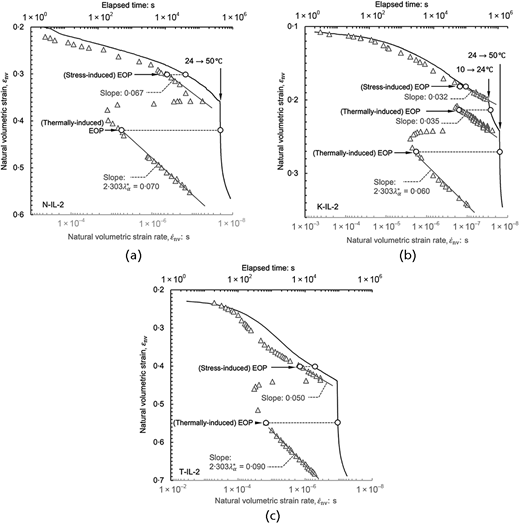
Heating effect on compression behaviour of peats in the middle of the secondary consolidation: (a) Nakajurin; (b) Kitamura; (c) Teshio (vertical stress level: 37 kPa), Note: black line indicates time–strain relationship; gray marker indicates strain rate–strain relationship
Heating effect on compression behaviour of peats in the middle of the secondary consolidation: (a) Nakajurin; (b) Kitamura; (c) Teshio (vertical stress level: 37 kPa), Note: black line indicates time–strain relationship; gray marker indicates strain rate–strain relationship
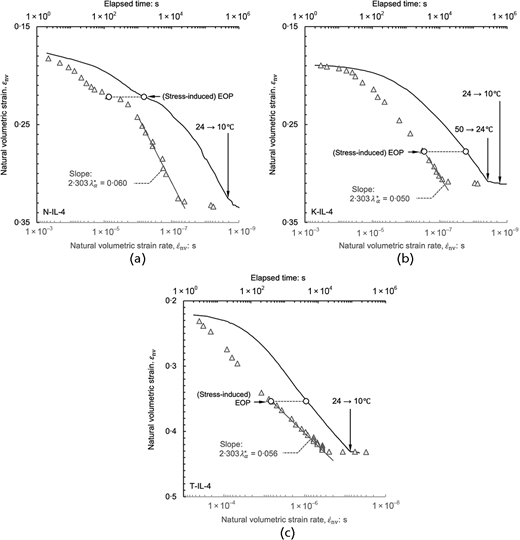
Cooling effect on compression behaviour of peats in the middle of the secondary consolidation: (a) Nakajurin; (b) Kitamura; (c) Teshio (vertical stress level: 37 kPa). Note: black line indicates time–strain relationship; gray marker indicates strain rate–strain relationship
Cooling effect on compression behaviour of peats in the middle of the secondary consolidation: (a) Nakajurin; (b) Kitamura; (c) Teshio (vertical stress level: 37 kPa). Note: black line indicates time–strain relationship; gray marker indicates strain rate–strain relationship
For some cases, the mechanical compression curve does not clearly display the inflection point which distinguishes the primary and secondary consolidation. The phenomenon is partly attributed to the relatively small load increment compared to the preconsolidation pressure. Similar behaviour was seen by Leonards & Girault (1961) and Tanaka & Tsutsumi (2016). A possible explanation is that the extra preconsolidation pressure developed due to the prolonged creep in the previous stages, and hence, the load increment ratio of one or 0·5 was insufficient for peats to surpass the preconsolidation pressure much.
The black lines in the figures illustrate that heating induced a compression, while cooling significantly reduced it, leading to an apparent overconsolidation, in agreement with previous studies (Fox & Edil, 1996; Oikawa & Ogino, 2001). The temperature effects led to the drastic changes in the slope of . While the earlier studies assumed these slope changes to represent the alteration in the coefficient of secondary consolidation, replotting the results against the volumetric strain rate (gray markers) provides a different interpretation of the process: the slope of after the EOP represents the coefficient of secondary consolidation, according to equation (13). Derived from , the coefficient of secondary consolidation is seen to change not as drastically before and after heating as that from . Fig. 13 indicates that cooling only resulted in the volumetric strain rate reduction, suggesting that the significant change of the slope of after cooling is not attributed to the temperature-dependent change of the coefficient of secondary consolidation, but rather a temporary drop in the strain rate.
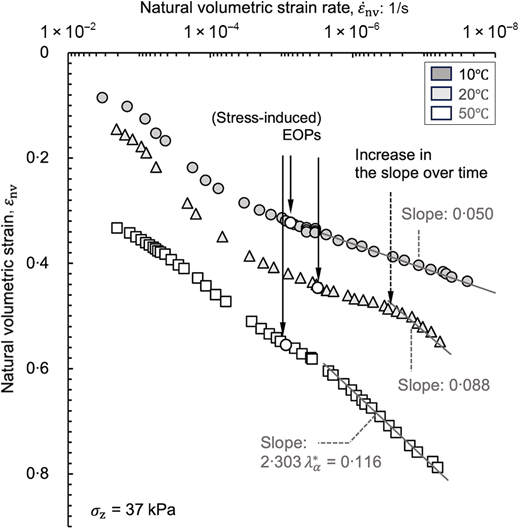
To investigate the intrinsic temperature dependency of the coefficient of secondary consolidation, , every test result was analysed by plotting . The result of T-12d series is shown in Fig. 14. The water content of each test sample is quite similar: 1098, 1097 and 1158 (%) for T-12d-10-1, T-12d-24 and T-12d-50, respectively, suggesting minimal variability in their mechanical properties. The results represent the temperature dependency of , with values being larger at higher temperatures. Note that the gradual increase of the slope even after EOP is seen in T-12d-24, and only the latter distinct linear part is considered for determination to isolate the potential influence of lingering excess pore water pressure dissipation (EOP here does not truly mean a 100% degree of consolidation).
Every test result is summarised as in Figs 15 and 16, including that at the high stresses, 900 and 1500 kPa, for Nakajurin. Note that the compression index, , was determined from the compression curves shown later, and is independent of temperature. For comparison, the typical range of for peats (that is ), reported by Mesri et al. (1997) and Mesri & Ajlouni (2007), is shown in the figures. The results show that for each peat is independent of the applied stress, even at the high stresses for Nakajurin (Fig. 15), but dependent on temperature (Fig. 16). Most values of at 10°C and 40% of those at 24°C are within the typical range of 0·06 ± 0·01. However, the rest at 24°C and most of those at 50°C are outside the typical range. The temperature dependency of the coefficient of secondary consolidation can be approximated by the following simplest linear function.
where represents the linear coefficient, denotes at a given temperature and is a reference temperature. = 0·0010 (/°C) is derived by applying a linear regression to the mean values in Fig. 16 (R2 = 0·76).
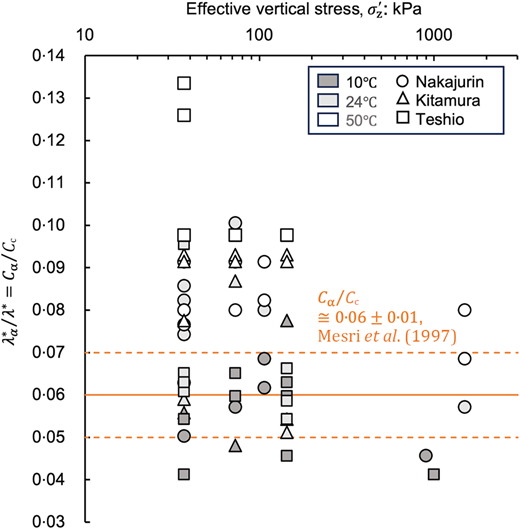
Ratio of the coefficient of the secondary consolidation to the compression index at different stress levels
Ratio of the coefficient of the secondary consolidation to the compression index at different stress levels
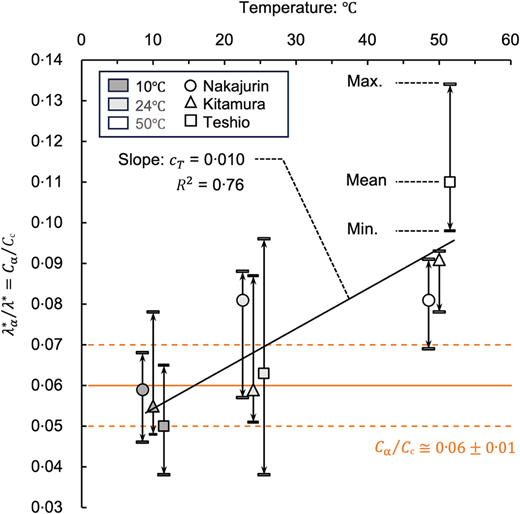
Ratio of the coefficient of the secondary consolidation to the compression index at different temperatures
Ratio of the coefficient of the secondary consolidation to the compression index at different temperatures
Temperature- and strain-rate-dependent compression lines: isothermal isotaches
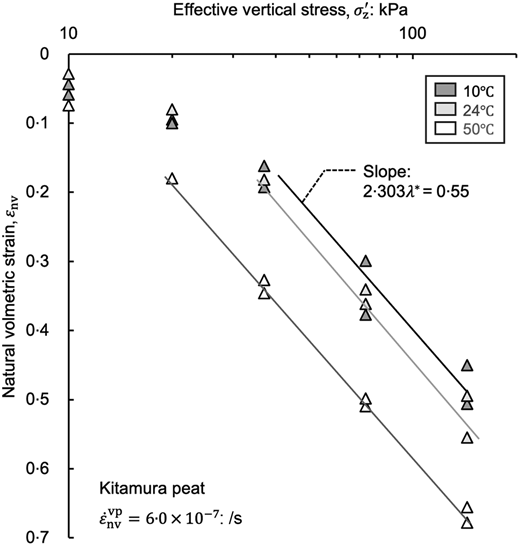
To demonstrate the temperature dependency of the compression line of peats, the result of T-IL series is first presented, by extracting the states observed at a strain rate of = 6·0 × 10−7 (/s) to isolate the influence of viscosity (i.e. creep), as shown in Fig. 17. Note that each strain rate taken in Figs 17–21 represents the smallest strain rate observed during IL tests for each peat. This ensures nearly complete dissipation of excess pore water pressure. The incremental loadings under constant temperatures resulted in different compression curves (i.e. dotted lines) for a given strain rate. They are derived from the results within the normal consolidation range. Note that the stress range of the dotted line corresponds to the normal consolidation range. The temperature-dependent compression lines will be referred to as isotherms in the paper. The dotted isotherms for higher temperatures locate lower in the (positive downwards) plane. The load increment after the cooling stage (24→10°C) in T-IL-4 resulted in reduced compression approaching the 10°C isotherm, as shown in Fig. 18(a). This response is interpreted as mechanical hardening by cooling. Similarly, the thermal compression, represented by the state approaching the isotherm for higher temperature, as shown in Fig. 18(a), is interpreted as the compensation for mechanical softening by heating. Similar interpretations were presented to account for the thermo-mechanical behaviour of clays (Hueckel & Baldi, 1990; Cui et al., 2000; Laloui et al., 2002; Li et al., 2018).
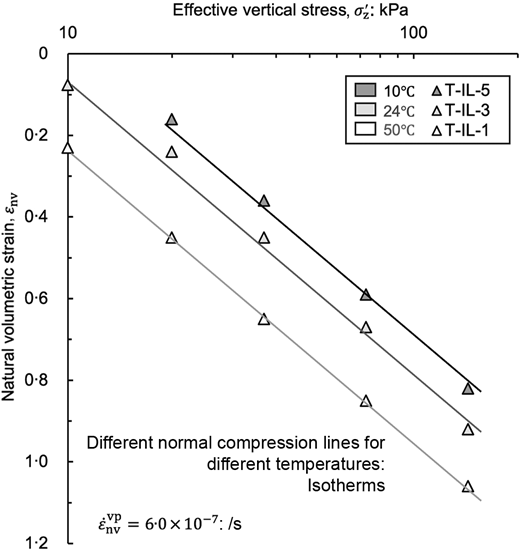
Effective stress–natural volumetric strain states of Teshio peat under constant temperatures and constant strain rate
Effective stress–natural volumetric strain states of Teshio peat under constant temperatures and constant strain rate
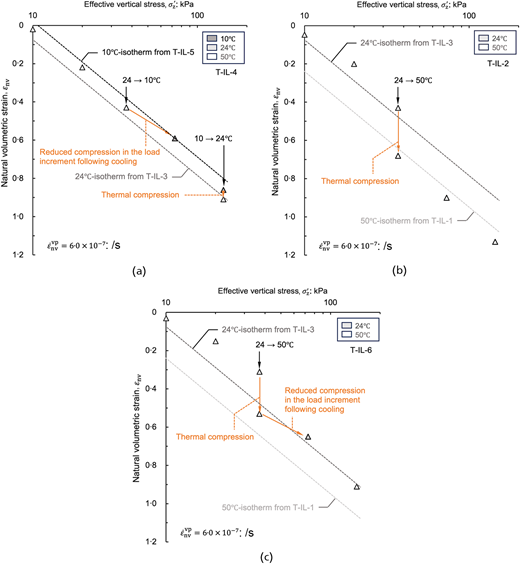
Effective stress–natural volumetric strain state transition of Teshio peat due to temperature changes: (a) T-IL-4; (b) T-IL-2; (c) T-IL-6
Effective stress–natural volumetric strain state transition of Teshio peat due to temperature changes: (a) T-IL-4; (b) T-IL-2; (c) T-IL-6
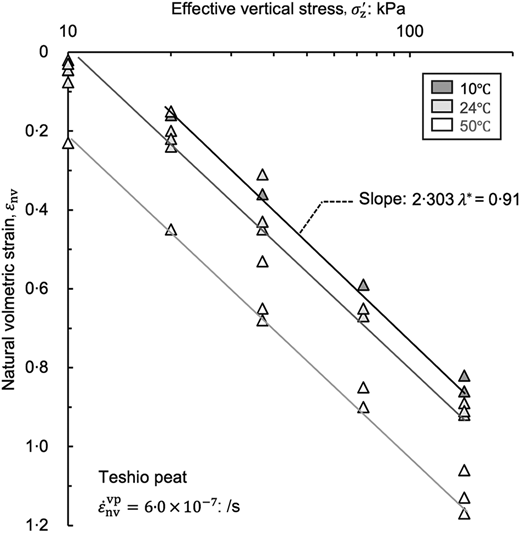
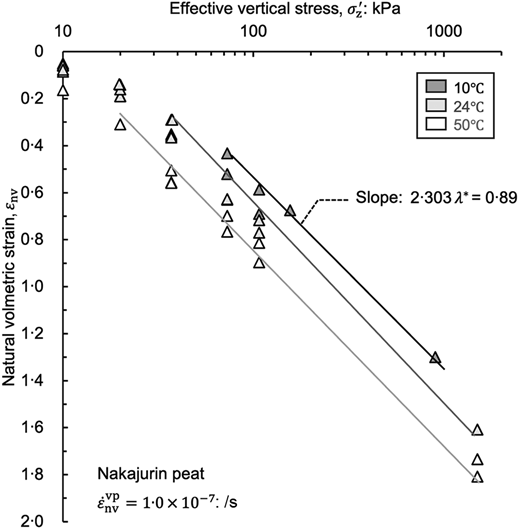
The thermo-mechanical behaviour in other tests, seen in Figs 18(b) and 18(c), can be interpreted similarly. Note that the behaviour in Fig. 18(c) does not completely follow the isotherms. This could be because of initial state differences in peat samples (e.g. disturbance) and the difference of inclusions as the samples were not reconstituted. Fig. 19 integrates all the T- series cases and T-12d series, suggesting that the effective stress–strain relationship of Teshio peat is determined by temperature under a given strain rate, irrespective of the stress–temperature change history. The results of N-IL and N-CRS series and K-IL series are summarised similarly in Figs 20 and 21 under a strain rate of 1·0 × 10−7 (/s) and 5·0 × 10−8 (/s), respectively. The temperature dependency of the compression lines is seen for Nakajurin and Kitamura peat as well as Teshio, except at low stresses, where the peats are in an overconsolidated state. The plots at the high stresses in Fig. 20 from N-CRS series reveal the existence of unique isotherms over very wide stress ranges.
The thermal compressibility of soils can be quantified as the offset of isotherms from a reference with temperature variations, , as shown in Fig. 1. To eliminate the influence of strain rate change, for each peat is evaluated under a given strain rate. The evaluation is based on Figs 19, 20 and 21, each of which summarises five to six test results for each peat. This approach provides an average offset value against temperature change, accounting for the variability in individual samples. Linearity of against , seen in Fig. 22, leads to a constant .
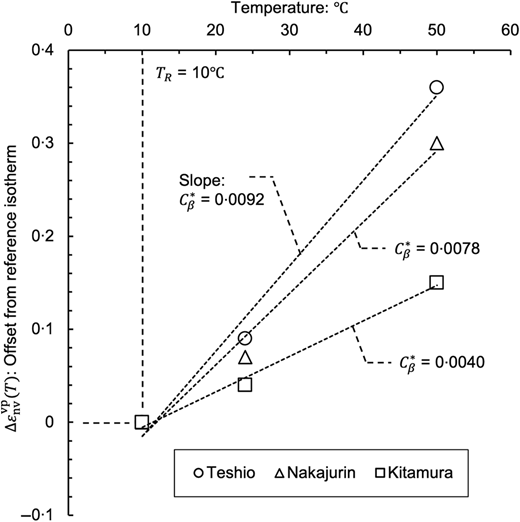
Offset from reference isotherm with temperature variation at 1·0 × 10−7 (/s) for Nakajurin, 5·0 × 10−8 (/s) for Kitamura, 6·0 × 10−7 (/s) for Teshio
Offset from reference isotherm with temperature variation at 1·0 × 10−7 (/s) for Nakajurin, 5·0 × 10−8 (/s) for Kitamura, 6·0 × 10−7 (/s) for Teshio
is here defined as the coefficient of thermo-plastic compression. The linear regression to the data suggests 0·0092, 0·0078 and 0·0040 (/) for Teshio, Nakajurin and Kitamura, respectively. When the following expression using the void rate is introduced:
they are interrelated to each other as
With equations (7) and (18)
Here, the ratio , or represents the thermo-plastic compressibility of soil considering its mechanical compressibility.
The spacing of isotherms, or , however, depends on the reference strain rate due to the modest temperature dependency of the coefficient of secondary consolidation seen earlier. This intertwined effect of temperature and strain rate can lead to a variation of 0·001 (/) in depending on which strain rate is considered as reference, between 1·0 × 10−6 and 5·0 × 10−8 (/s), although this is small compared to a representative value of 0·020 (/) of as discussed below.
From previous studies, values for Middleton peat (Fox & Edil, 1996) and Akita peat (Oikawa & Ogino, 2001) were calculated (see Appendix 3 for details), and they are summarised in Fig. 23 together with the results in the current study. The reference strain rate is of the order of 10−7 (/s) for Akita and 10−7 to 10−8 (/s) for Middleton. Despite the differences in the strain rate used and the natural water content, the result shows falls within the range of 0·020 ± 0·003 (/) for all the peats. This suggests that 0·020 (/°C) for peats is a good first estimation for the reference strain rates in order of 10−6 to 10−8 (/s). The parameters discussed earlier, including , and , are summarised in Table 2.
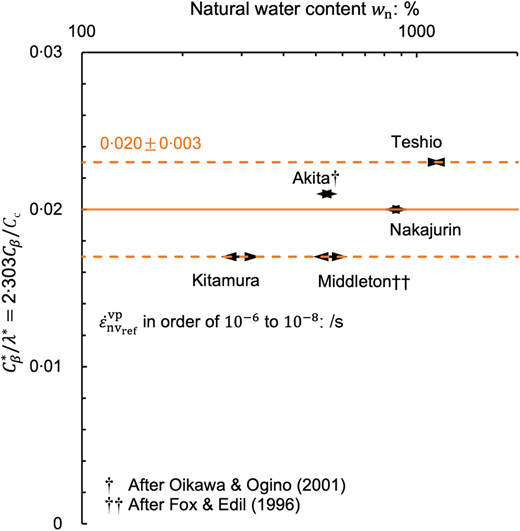
Relationship between the ratio of the coefficient of the thermo-plastic compression to the compression index and natural water content
Relationship between the ratio of the coefficient of the thermo-plastic compression to the compression index and natural water content
Mechanical parameters of peats used in this study
| : % | % | † | : /°C | : /s | ||||
|---|---|---|---|---|---|---|---|---|
| 10°C | 24°C | 50°C | ||||||
| Nakajurin | 800–940 | 94–96 | 0·39 | 0·059 | 0·081 | 0·081 | 0·020 | 1·0 × 10−7 |
| Kitamura | 260–340 | 25–35 | 0·24 | 0·055 | 0·059 | 0·091 | 0·017 | 5·0 × 10−8 |
| Teshio | 1090–1160 | 90–91 | 0·40 | 0·050 | 0·063 | 0·091 | 0·023 | 6·0 × 10−7 |
| Middleton‡ | 490–620 | 89–94 | No data | 0.064–0.072‖ | 0·018 | In order of 10−7 to 10−8 | ||
| Akita§ | 500–580 | 50–51 | 0·33 | 0.082‖† | 0·021 | In order of 10−7 | ||
† Mean values
‡ After Fox & Edil (1996)
§ After Oikawa & Ogino (2001)
‖ The temperature dependency of cannot be accounted for based on the data shown in the reference
The value of for clays were extracted from earlier studies (Towhata et al., 1993; Marques et al., 2004; Abuel-Naga et al., 2007; Tsutsumi & Tanaka, 2012), falling between 0·001 and 0·009 (/°C) for plasticity index of 29–60. This indicates the extent of the thermo-plastic compression in peats is several to tens of times greater than that in clays, even relative to the compressibility . Such a distinction underscores the significance of considering temperature effects in geotechnical analyses involving peats.
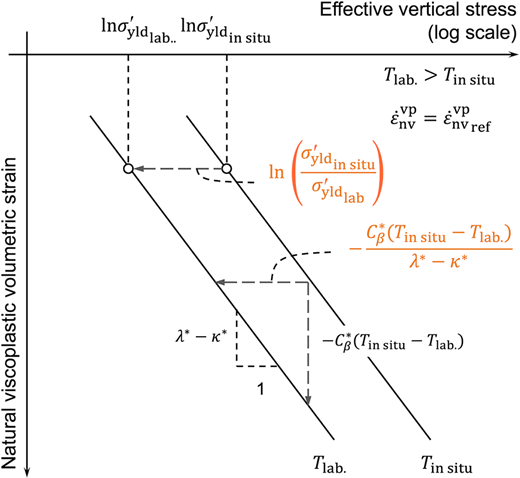
The isotherm concept highlights a potential underestimation of in situ preconsolidation pressure when consolidation tests are conducted at typical laboratory temperatures (20–25°C). The degree of this underestimation is derived from the geometry of laboratory and in situ isotherms shown in Fig. 24:
where is the laboratory preconsolidation pressure, is the in situ preconsolidation pressure, is the laboratory temperature and is the in situ temperature. To simply discuss the temperature effect, other possible factors such as the sample disturbance, which may cause the change in yield stress observed in the laboratory, are separated here. Employing typical values for peats (that is after Hayashi et al. (2012) and Yamazoe et al. (2020) and the current authors’ results in Fig. 25 and (/°C)), the following simplified form is obtained:
Effective stress–strain paths during multi-stage CRS test for (a) Nakajurin and (b) Teshio
Effective stress–strain paths during multi-stage CRS test for (a) Nakajurin and (b) Teshio
Assuming 25°C and 10°C gives for peats, meaning that could be underestimated by about 30%, while this might be lessened, considering that the volumetric hardening may occur due to an effective stress change during sampling (Yamazoe et al., 2023). For clays, this underestimation is just 8%, if (/°C) is adopted. Note that is assumed to be independent of temperature here and this assumption might lead to changes in this yield stress estimation.
The results of N- and T-mCRS test series (Fig. 25) show the strain-rate-dependent compression behaviour of peats. The strain rate changes induced the shifts of the effective vertical stress–strain path, and the discrete segments of the path at a given strain rate form a straight line, or isotache, at each temperature. The temperature change in the middle of CRS compression caused the shift in the isotaches. The observed strain-rate-dependent and temperature-dependent behaviour supports the validity of the isothermal isotaches approach (Fig. 1) in understanding the thermo-mechanical behaviour of peats.
CONCLUSIONS
In this study, the one-dimensional thermo-mechanical behaviour of peats has been investigated through a systematic consolidation test programme encompassing various thermo-mechanical paths. The study employed three types of peats with different natural water content: Nakajurin, Kitamura and Teshio peats. The experimental programme consisted of incremental loading (IL) and constant-rate-of-strain (CRS) consolidation tests. The natural volumetric strain, , was introduced to address the extremely high compressibility of peats. The coefficient of secondary consolidation, , was redefined by the natural volumetric strain rate, . The conclusions drawn from the investigation and discussion are as follows.
Heating peats under a constant load resulted in compression, or thermal compression, while cooling slowed down compression, in a similar manner to mechanical unloading, leading to apparent overconsolidation. This is consistent with previous studies on peats.
The compression after heating and the reduced compression after cooling resulted in a sharp bend in the slope of curves (where is elapsed time), without resetting the origin of after temperature changes. While such conspicuous changes were interpreted as the change in the coefficient of secondary consolidation due to temperature change in previous studies, replotting the same results against (that is curves) cancels such sharp changes in curve slopes, and indicates that the temperature dependency of is much more moderate.
Still, the coefficient of secondary consolidation of peats changes depending on temperature. While its ratio to the compression index, (, ), as the mean value, is in the conventional range of 0·0600·010 for 10°C and 40% of 24°C cases, the remaining cases exceeds this range, reaching 0·0900·020 especially for 50°C.
The incremental loading consolidation tests under different thermo-mechanical paths resulted in the unique temperature-dependent effective stress–volumetric strain relationships under a given volumetric strain rate. The temperature-dependent relationship at a given strain rate, was termed an isotherm. Similarly, the multi-stage CRS tests with step-by-step rate changes confirmed a family of strain-rate-dependent relationships: isotaches. These experimental results support the concept of isothermal isotaches for peats.
The shift of isotherms is approximated as linear against temperature change, and its slope is expressed as the coefficient of thermo-plastic compression, , which phenomenologically accounts for the temperature-dependent behaviour of peats. Its value only moderately depends on a reference strain rate, due to the temperature dependency of . Its ratio to the compression index, , falls within the range of 0·0200·003 (/°C) for the reference strain rates 10−7 – 10−8 (/s), regardless of the type of peats. This range is much higher than that of clays ( 0·001 – 0·009 (/°C)).
The test results suggest that the in situ (∼10°C) yield stress could be underestimated by around 30% for peats if tested at standard laboratory temperatures (e.g. 25°C). This underestimation is, theoretically, just around 8% for clays whose plasticity indices are within 29–60.
REFERENCES
APPENDIX 1. DETAIL OF THERMAL CONDUCTION ANALYSIS
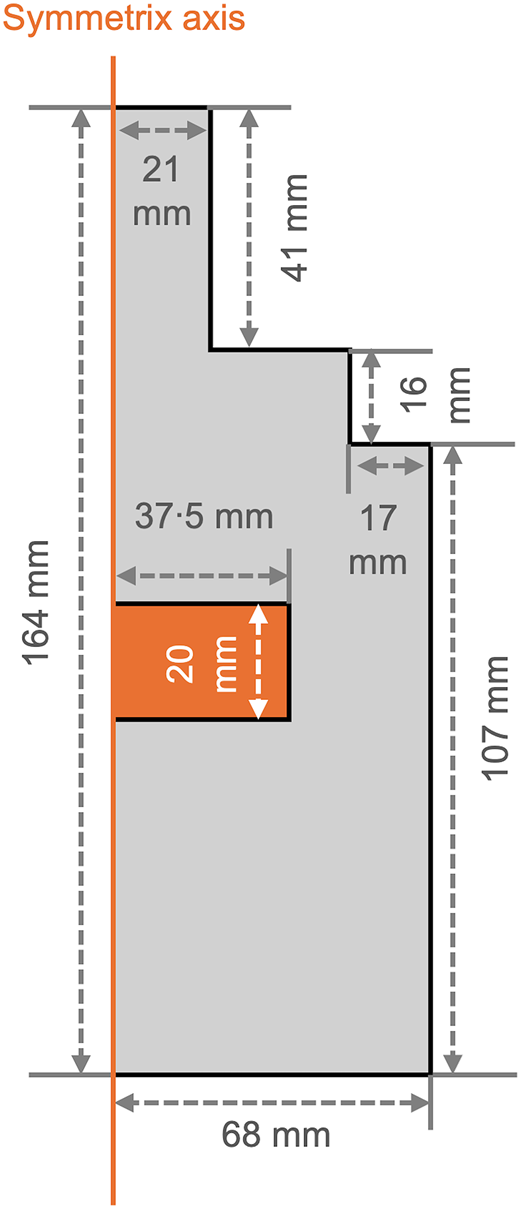
The numerical analysis of thermal conduction was performed to estimate the delay of temperature change at the specimen core against that at the boundary. The governing equation solved here was the axi-symmetric thermal conduction equation in the cylindrical coordinate system:
where is the coefficient of thermal diffusion. A forward finite-difference scheme was employed for the computational implementation. The in-house code was validated by comparison with the exact solution of a one-dimensional thermal conduction problem.
The whole system comprising a peat specimen and stainless steel apparatus was modelled as axi-symmetric, as shown in Fig. 26, with the thermal diffusivity for peat and steel being 1·4 × 10−7 and 4·0 × 10−6 (m2/s), respectively (Dissanayaka et al., 2012; Pichler et al., 2020). The numerical domain was discretised into square meshes with a side length of 1 mm, and a time interval of 1 s was selected for the simulations, after several trial computations to minimise the numerical errors. The uniform temperature distribution of 24°C was assigned as the initial condition, and the poly-linear approximation of the measured temperature was applied as a boundary condition at the outer rim of the apparatus. The simulation results in Fig. 27 show that, if the device with a temperature-controlled bath is used, the specimen core temperature reaches the prescribed value in an hour after the measured (surface) temperature reaches the same value, and with the incubator, the time lag in heat transfer is relatively smaller, due to the slower temperature change rate.
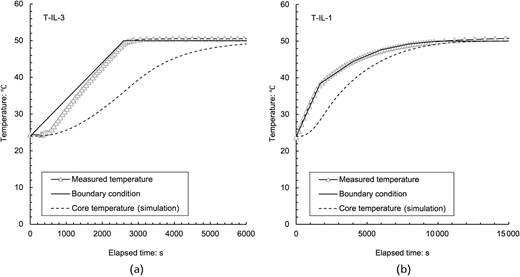
Result of heat transfer simulation assuming the use of: (a) the device with temperature-controlled bath; (b) incubator
Result of heat transfer simulation assuming the use of: (a) the device with temperature-controlled bath; (b) incubator
APPENDIX 2. END OF PRIMARY CONSOLIDATION ESTIMATION
The one-dimensional primary consolidation behaviour of peats does not strictly adhere to Terzaghi’s consolidation theory due to the large decrease of the coefficient of consolidation at high stresses (Yamazoe et al., 2020). Consequently, conventional approaches to determine the end of primary consolidation (= EOP) based on Terzaghi’s theory, such as the √t method, can be inaccurate for peats. This is the same for the end of thermally induced primary consolidation. In the paper, EOPs were determined in the following ways.
Determination based on excess pore water pressure measurement
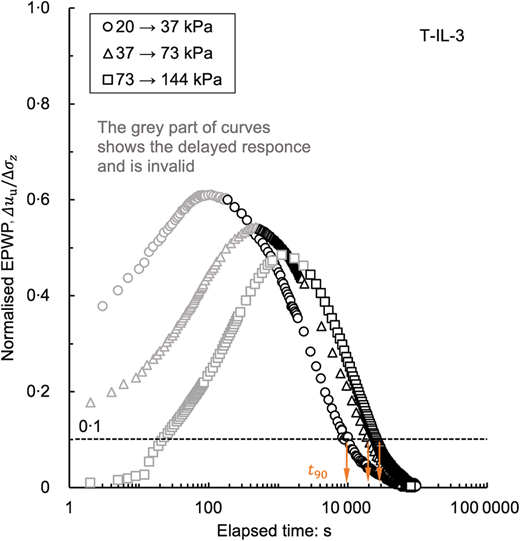
Figure 28 shows an example of the measured excess pore water pressure (= EPWP), , normalised by the applied stress, (that is ). The initial responses of the water pressure transducer were delayed due to the compliance of the whole experiment system, including the compressibility of the pore fluid and solid parts of peat. The grey part in the figure was therefore ignored. The peak value lower than one is a result of excess pore water pressure dissipation during the delay. The time corresponding to the EOP, , is defined for simplicity as follows.
where is defined as the time corresponding to 90% average degree of consolidation at the undrained end of the specimen (that is , where is the stress increment).
The natural volumetric strain rate corresponding to the EOP, , is determined as shown in Fig. 29.
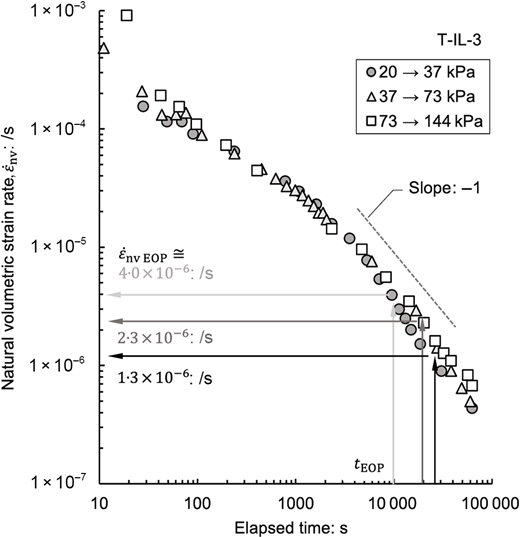
Estimation based on creep behaviour
Assuming that the creep after the EOP is described by the coefficient of secondary consolidation, .
namely, the slope of the curve converges to −1 at EOP.
Figure 30 suggests that the estimations by equation (23) are consistent with those by EPWP measurement This is also observed in the results of N- and K-IL-3, where EPWP was measured. With the confirmation, equation (24) is used as the EOP criterion for the cases without EPWP measurement. Fig. 30 displays the curves during and after a temperature change in the T-IL-2 case. The slope of each curve converges to −1 in 6 h after the temperature change terminated. The thermally induced primary consolidation is assumed to have completed at these points. This is examined for every case including temperature rise to determine EOP.
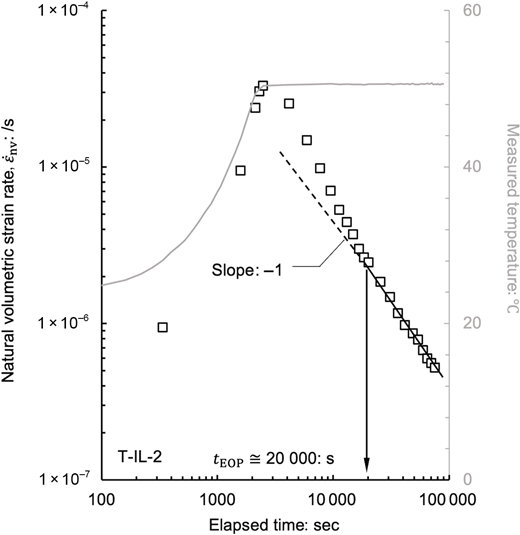
relationship during and after temperature change. Note: gray line for measured temperature (°C), right vertical axis; black marker for strain rate, left vertical axis
relationship during and after temperature change. Note: gray line for measured temperature (°C), right vertical axis; black marker for strain rate, left vertical axis
APPENDIX 3. REINTERPRETATION OF DATA IN PREVIOUS STUDY
Fox & Edil (1996) proposed two indices, and , which quantify the variation in the void ratio change rate, after a small stress increment (typically 3–5% of the existing load) and temperature change in the middle of the secondary consolidation as follows.
Equation (25) can be rewritten as
The substitution of pairs of and , obtained from their test result into equation (27) yields 0·064 – 0·072.
Equation (26) can be rewritten as:
Assuming =0·07 in equation (28), 0·02 is obtained. The reformulations indicate is proportional to the coefficient of secondary consolidation and is proportional to the coefficient of thermo-plastic compression.
