A coastal portion of the Greater Metro Manila Area, Philippines, is situated primarily on Quaternary alluvium deposits, which are likely to liquefy. Liquefaction is a hazard that occurs when loosely packed, saturated sediments at or near the ground surface lose their strength, caused by an earthquake. Currently, the standard in determining the soil properties and liquefaction potential of a site is by using conventional geotechnical techniques such as the standard penetration test (SPT). However, this method has disadvantages in terms of cost, logistics and workforce. The screw driving sounding (SDS) test was developed to estimate equivalent SPT parameters such as N-value and fines content, which are then used for liquefaction analysis. This paper presents a comparative analysis between SDS and SPT in selected schools in the Greater Metro Manila Area, Philippines. Moreover, soil classification and site-specific liquefaction potential evaluation were also estimated using the data acquired from the SDS test. Overall, the results of the study prove that the SDS test is an effective alternative method for soil investigation and estimation of the liquefaction potential.
Notation
- Cnl
coefficient of non-linearity obtained from screw driving sounding (SDS) data
- Cw
coefficient of seismic motion used to calculate R
- cp
index of hardness of a material calculated from SDS data
index of screw effect
- dE
penetration energy obtained from SDS
- dT/dst
relationship of the slope of torque with the penetration amount
- dT/dWD
normalised rate of torque with respect to the weighted load
- E0.25
total penetration energy needed for 25 cm penetration of the screw
- FCSDS
estimated fines content in per cent using SDS
- FCSPT
measured fines content in per cent using the standard penetration test (SPT)
- FL
risk of liquefaction in depth; a value of less than 1 means liquefiable
- L
seismic shear stress used for the calculation of F L
- NsdD
half-rotation needed for a 1 m penetration length
- NSDS
estimated N-value or soil strength using SDS
- NSPT
measured N-value or soil strength using SPT
- R
dynamic shear stress used for the calculation of F L
- R2
statistical measure of the strength of relationship between models
- RL
cyclic triaxial strength ratio used to calculate R
- T
measured amount of torque obtained from SDS
- t
measured thickness of a layer
- u
pore pressure
- W
measured amount of load obtained from SDS
- W0.25
vertical load needed for 25 cm penetration
- γ
unit weight of soil calculated from the empirical relationship from N
- γd
reduction coefficient
- πT/WD
relationship of the slope of torque and load
- σ1–σ4
constants derived from regression analysis
- σv
total overburden stress
effective overburden stress
Introduction
The Greater Metro Manila Area (GMMA), a megacity in the Philippines, encompasses the contiguous provinces surrounding Metropolitan Manila. It comprises Metro Manila and the adjacent provinces of Bulacan to the north, Cavite and Laguna to the south and Rizal to the east. The location of GMMA is particularly vulnerable to the adverse effects of natural hazards, including typhoons and earthquakes.
Based on a generated map published by the Department of Science and Technology–Philippine Institute of Volcanology and Seismology (DOST–Phivolcs), the western part of GMMA is prone to hazards such as liquefaction. According to Obermeier (2009) and Youd (1973), liquefaction is the transformation of a solid saturated granular material to a liquefied phase due to severe ground shaking caused by an earthquake. According to Castro and Poulos (1977), it is a phenomenon where a saturated sand material loses its shear resistance and acts like a liquid until the shear stress is as low as the lowered shear resistance. This phenomenon can be differentiated into two main categories: flow liquefaction and cyclic mobility. The former is where the static equilibrium has been destroyed by static (additional forces on the soil) or by dynamic (earthquake, pile driving or blasting) loads in a low-residual-strength soil (Johansson, 2000; Lade and Yamamuro, 2011). The latter is a phenomenon that is triggered by cyclic loading, which occurs in deposits with lower static shear stress than the soil strength (Baki et al., 2019; Johansson, 2000). Failure of road embankments, sand boils, fissuring and damage of structural buildings are among the most dangerous threats caused by liquefaction.
According to previous studies, conventional methods, specifically the standard penetration test (SPT), are the most used methods in classifying soil and in determining the index value that can be used to categorise the liquefaction potential (Ameratunga et al., 2016; Hore et al., 2020). The SPT can be used to estimate the factor of safety against liquefaction (FL) using the obtained geotechnical parameters: N-value (NSPT) and fines content of soil (FCSPT). However, the SPT has drawbacks such as high operation cost, bulky instrumentation and requirement of highly skilled personnel and labour force. Therefore, a more cost-effective, relatively new equipment, screw driving sounding (SDS), was developed. The SDS test is a geotechnical method established in Japan, designed for ground studies of subsurface soil. It is a more updated version of the Swedish weight sounding (SWS) machine, which is another piece of geotechnical equipment used for the subsurface estimation of the shear strength or N-value of soil material (Zarco et al., 2010). Essential parameters such as penetration depth, load (W), torque (T), number of rotations and penetration speed are measured using the SDS machine, making it possible to determine empirically the soil classification and estimate important engineering parameters needed for assessing liquefaction (Orense et al., 2019; Tanaka et al., 2012).
In this study, 56 selected schools in the western GMMA were assessed by performing several SDS tests in the selected schools. The analysed data from SDS were then compared with those from SPTs conducted in the vicinities of the selected schools. The SDS test was used as the primary method to satisfy the objectives of the study: (a) to perform a correlation analysis between the estimated geotechnical data calculated using SDS raw parameters and the actual value obtained from the SPT; (b) to develop an initial soil classification chart using the relationship between SDS parameters; and (c) to quantify the liquefaction potential of the selected sites using SDS and compare it with those from other methods. The overall research is an attempt of SDS analysis in Philippine settings based on previous studies, mainly by Maeda et al. (2015) in terms of the first objective regarding correlation analysis of geotechnical data and by Tanaka et al. (2012) in terms of the second objective regarding soil classification.
Study area
Geology and geomorphology
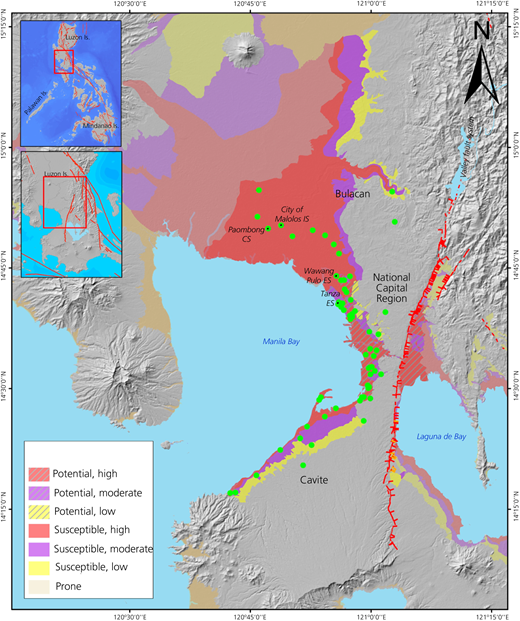
The study area is confined to the western coastal part of GMMA. The target sites of this study are 56 selected schools within the liquefaction-susceptible areas identified in the liquefaction hazard map published by DOST–Phivolcs. This includes Metro Manila and the Bulacan and Cavite provinces (Figure 1).
The Metro Manila area is generally affected by three lithologic types: Quaternary alluvial deposits, pyroclastic flows or ignimbrites and tuff or tuffaceous deposits. In the study area, a large portion is affected by Quaternary alluvium deposits. This deposit is classified as unconsolidated sediments with sandstone, siltstone and claystone interbeds. Channel-filled conglomerates are also among the dominant features of this deposit (JICA and DPWH, 2010).
Geomorphologically, the area shows three distinct features – coastal lowland, central plateau and Marikina Valley. The central plateau is characterised by the presence of welded tuffaceous deposits, whereas the Marikina floodplain is mainly composed of soft fluvial deposits caused by the deposition of deltaic deposits and Marikina River. The coastal lowland, characterised as the flat and low plain part facing Manila Bay, is the prevailing landform in the western coastal part of the study area.
Seismicity and seismic hazard
The West Valley Fault (WVF) is a tectonic feature that transects the east of Metro Manila and runs to Bulacan, Cavite, Laguna and Rizal provinces (Daligdig, 1997). A model earthquake scenario (model 08) showed that the expected magnitude produced by this 67 km long segment is M 7.2. According to the Metropolitan Manila Earthquake Impact Reduction Study, the movement interval of the fault is 200–400 years, and the last recorded movement of WVF was in 1658. This posed an imminent hazard to the highly populous area of GMMA.
In anticipation of a possible 7.2 magnitude earthquake, the liquefaction potential of soil should be included in the preparedness plan. A study published by DOST–Phivolcs showed that a very high liquefaction potential is found in areas located in a coastal lowland. The alluvial deposits of soft clays and loose sandy materials of approximately up to 40 m thick combined with a shallow water table depth (WTD) and ground acceleration are among the main reasons for the high potential of the hazard.
Methodology
SDS test
The SDS test uses a non-destructive probe hole-drilling tool that uses a screw tip designed for ground studies. It is advantageous compared with conventional soil investigation methods in terms of cost, logistics and manpower; the SDS equipment is compact and more straightforward and faster to operate. Recent studies on SDS showed that the equipment can provide an empirical correlation using the raw data of SDS to estimate the equivalent N SPT and FCSPT of a soil layer (Maeda et al., 2015). The corresponding soil classification and liquefaction assessment are also among the topics being studied using this method (Tanaka et al., 2012).
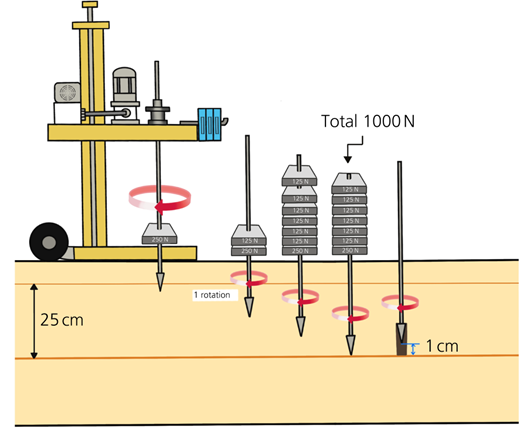
The SDS test process starts with the initial loading of a 250 N weight. A continuous loading of 125 up to 1000 N load is conducted until the penetration depth reaches the 25 cm cut-off per layer. After each applied load, the rod first rotates at a constant rate of 25 revolutions per min and then measures the required raw data. The rod is then lifted by 1 cm after each 25 cm cut-off and will make another rotation before measuring an additional parameter (rod friction) (Mirjafari et al., 2013, 2015). The process is repeated until the screw tip reaches a stiff rock or a layer that exceeds the penetration capability of the machine (Figure 2).
After the test, the data file is captured from the SDS machine using Bluetooth communication. The captured data are sent to a cloud-based system or Geoweb system to provide the processed data (Marto et al., 2019). The initial graphical result of the parameters can be immediately checked on site using a mobile phone for data confirmation. The final numerical data are made available in the Geoweb server, wherein the corrections and calculated estimates of the parameters are presented in downloadable Microsoft Excel spreadsheets.
SDS data
Two Excel files are readily downloadable from Geoweb upon capturing and sending the on-site data. One file (name_weight.csv) contains the data for each load sequence (0.25, 0.38, 0.5, 0.63, 0.75, 0.88 to 1 kN), whereas the other Excel file (name_depth25.csv) contains the data for each 25 cm depth reached. The data recorded in the load sequence Excel file (name_weight.csv) are: depth; load; torque as average, minimum and maximum; penetration velocity; number of half-turns; penetration energy; amount of penetration; πT/WD; c p; corrected torque; and corrected load. The data recorded on the name_depth25.csv file are depth, E 0.25, W 0.25, C nl, , N SDS, d T/d W D and soil type. The aforementioned parameters were used for the estimation of the fines content and N-value, soil classification and liquefaction analysis, which are further discussed in the sections headed ‘Estimation of fines content and N-value’, ‘Soil classification’ and ‘Liquefaction assessment’, respectively. To lay a foundation for the calculations, several parameters are discussed in this section.
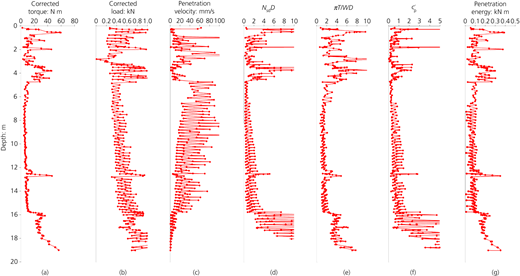
Torque (T) measures the force that can cause an object to rotate about an axis, whereas the load (W) is the amount of force exerted on the soil body. High values of T and W indicate more compacted or stiff soil, whereas low values of T and W indicate that the soil is softer and easier to penetrate. The penetration velocity is the speed of the rod when penetrating the ground. This parameter substantially decreases when a hard material is penetrated (Figure 3) (Mirjafari, 2016; Orense et al., 2019). N sd D is the half-rotation needed for a 1 m penetration length. It is the product of number of half-turns for every 25 cm penetration (N sd) and the outer diameter of the screw point (D). The higher the value of N sd D, the more difficult is the screwing, thus indicating a hard material. πT/WD is the torque and load ratio. The higher the πT/WD, the harder it is to penetrate the material (Figure 3) (Orense et al., 2019).
Another parameter is penetration energy (dE), which is the combined energy of load (W) and torque (T) that acts on a screw point. Both higher values of the index of hardness () and penetration energy (dE) indicate that the soil is stiff and harder to penetrate. E 0.25 and W 0.25 are, respectively, the amount of energy and load exerted until a 25 cm depth is penetrated. d T/d W D is the ratio of the normalised torque and normalised load with respect to the diameter of the rod, D. C nl or the coefficient of non-linearity is a dimensionless constant derived from regression analysis (Maeda et al., 2015).
Estimation of fines content and N-value
Based on the paper by Maeda et al. (2015), estimation of the N-value using SDS (N SDS) and estimation of the fines content using SDS (FCSDS) can be conducted using multiple regression analysis. This statistical procedure is used to assess the strength of the relationship between a dependent variable (outcome) and multiple independent variables (predictors). For better correlation results, SDS tests should be conducted near the available SPT site.
For FCSDS, the relationship between the vertical load needed for 25 cm penetration (W 0.25) and the normalised rate of torque with respect to the weighted load (d T/d W D) are used (Equation 1). On the other hand, N SDS is computed using the relationship between the slope of torque with penetration amount (d T/d st), the total penetration energy needed for 25 cm penetration of the screw (E 0.25) and the coefficient of non-linearity with an increasing tendency of penetration energy (C nl) (Equation 2). σ 1, σ 2, σ 3 and σ 4 are constants derived from regression analysis (Maeda et al., 2015).
In addition, the goodness of fit of the data to the model or R-squared (R 2) is calculated to determine the efficiency of the performed multiple regression formulae (Equations 1 and 2). R 2 has a value that ranges from 0 to 1, wherein R 2 that is approaching or equal to 1 means a good-fit correlation in the data, while the opposite represents poor-fit data.
Soil classification
ASTM D 2487 (ASTM, 2011), the standard practice for classification of soils for engineering purposes or the Unified Soil Classification System (USCS), is used to classify soils. The classification of soil is based on the laboratory estimation of the particle size, liquid limit and plasticity index of materials. The USCS classifications from the obtained SPT in the study are as follows: SW (well-graded sand), SP (poorly graded sand), SM (silty sand), SC (clayey sand), ML (inorganic silts and very fine sands with a liquid limit less than 50%), MH (inorganic silts with liquid limit more than 50%), CL (inorganic clays of low to medium plasticity) and CH (inorganic clays of high plasticity).
As SDS cannot provide soil samples, the soil classification for Philippine conditions was determined by incorporating several parameters of SDS, including T, W, N sd D and πT/WD, and by comparing the parameters to the existing SPT data available in the selected schools. This method was first introduced by Tanaka et al. (2012) to classify the soil in Japan. Furthermore, the method is approved by the institution that certifies and examines the Japanese technology.
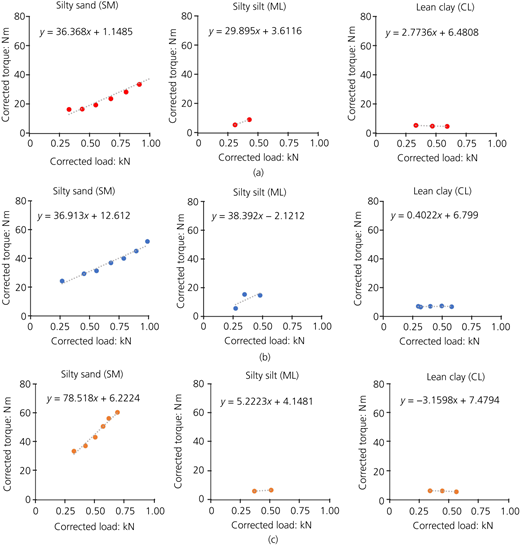
First, d T/d W or the relationship between T and W was plotted on a graph to establish distinct trends in their slope. If the material has an internal frictional force, then the torque increases with increasing load. Thus, in a T-against-W graph, the slope of frictional soil (sand) tends to have a positive value, whereas that of frictionless soil (clay, silt) tends to have a negative to zero value (Tanaka et al., 2012). This ratio is comparable with that from the conventional laboratory test, which is the slope of shear stress against the confining pressure (Orense, 2019).
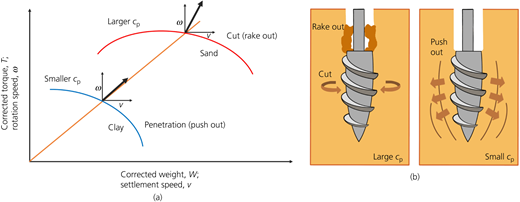
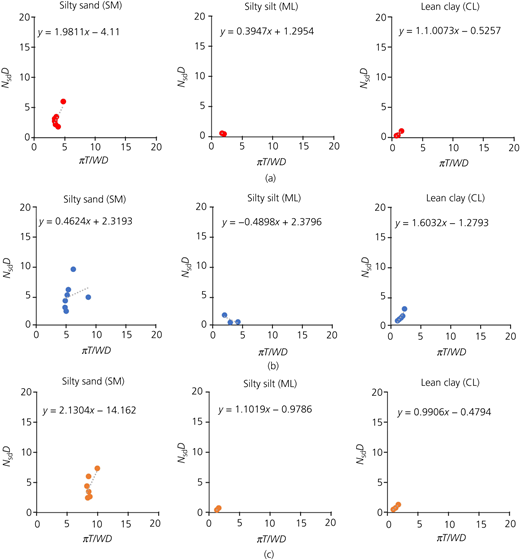
Second, or the resulting ratio between N sd D and πT/WD was also plotted to determine the different values of with each soil category. It showed the direction of the deformation vector of the screw point. The for sand is relatively larger than that of clay, because the raking and cutting of soil that is signified in sand material is more effective than pushing the soil outwards (Figure 4) (Tanaka et al., 2012).
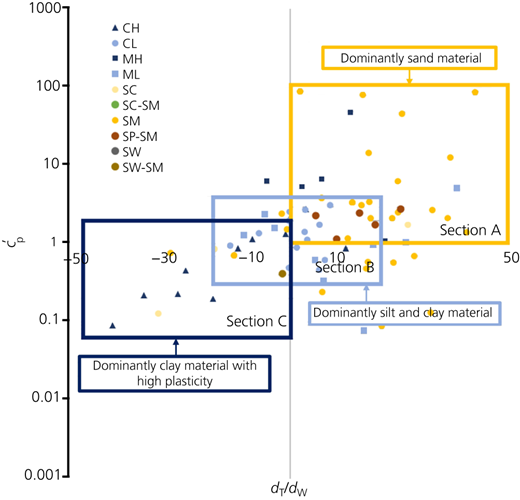
The combined relationship of both c p and d T/d W discussed earlier was then examined, as also shown in a study by Tanaka et al. (2012). This relationship provides a good classification of soil type for the soils in Japan. By plotting both the parameters in a graph, a soil classification chart of Japanese soils could be visualised using the SDS data. Three sections were categorised. Section A includes loam, loamy clay and tuff clay with greater than 1 and a positive d T/d W. Section B is composed of mainly silt and clay with in the range 0.3–1 and d T/d W in the range −15 to 15. Lastly, section C with of less than 0.3 and a high range of d T/d W is composed of peat and organic soil. For this study, an initial soil classification chart was produced based on the mentioned methodology.
Liquefaction assessment
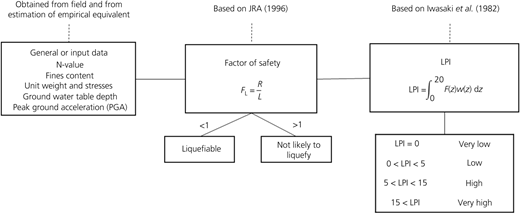
One of the most used methods in assessing liquefaction potential is using the factor of safety. Based on the Specifications for Highway Bridges published by the Japan Road Association (IISEE, 2022; JRA, 1996), the liquefaction index of soil can be computed through F L, which is the ratio between the dynamic shear stress (R) and seismic shear stress (L) (Equation 3). F L specifies the risk of liquefaction in depth: a factor of safety less than 1 indicates a possibility of hazard, while factor of safety more than 1 indicates a less likely possibility of liquefaction.
The L in the factor of safety equation is calculated from the reduction coefficient (γ d), peak ground acceleration (PGA or k hgl), total stress (σ v) and effective stress (). PGA is the maximum acceleration of the ground that occurred during ground shaking at a specific location. In this study, PGA is based on the probabilistic PGA at soft rock or stiff soil with a 10% probability of exceedance in 50 years published in The Philippine Earthquake Model by DOST–Phivolcs (2017). The PGA range in the study area is 0.23–0.60g.
For the stress estimation, σ is calculated as the product of unit weight of the soil (γ) and the corresponding thickness of the layer (t). γ is usually obtained by laboratory testing, but as the SDS equipment cannot return a sample material for testing, an empirical relationship between the N-value and γ is used. In the analysis, the empirical relationship between the N-value and its corresponding estimated unit weight (interpolated) in cohesive and cohesionless soil was established (Bowles, 2001).
is the combined effect of the σ of the soil layer and the pore pressure (u) that keeps it together. u is mathematically presented as the difference in the depth and WTD multiplied by the unit weight of water (Budhu, 2000; Schroeder et al., 2004). In this study, the WTD was determined using ground-penetrating radar (GPR). This geophysical equipment uses radar pulses to image the subsurface material, including the WTD, which is highly important in liquefaction study (Liu and Li, 2001).
Furthermore, R is the product of the cyclic triaxial strength ratio (R L) and coefficient of seismic motion (C w). It is directly obtained by conducting cyclic undrained triaxial tests but can also be estimated using the SPT general data N and FC%.
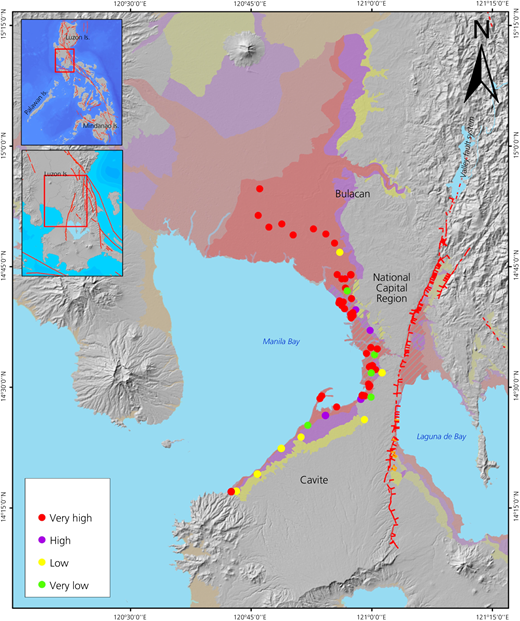
The liquefaction potential index (LPI) is a parameter that quantifies the rate of the liquefaction potential of an area. It is derived from the integrated F L along with the soil layer up to a 20 m depth. Based on the paper by Iwasaki et al. (1982), the level of liquefaction severity is very low for LPI values equal to 0, low for values 0–5, high for values 5–15 and very high for LPI values more than 15 (Figure 5).
Results and discussion
A total of 227 SDS points in 56 selected schools were tested, and liquefaction resistance was calculated. The penetration depths of probe holes ranged from 4.00 to 33.50 m. On the other hand, SPTs were conducted for a total of 28 sites within the school campuses with a depth of 12.00–30.00 m.
Fines content and N-value correlation
Following the regression study (Equations 1 and 2) conducted by Maeda et al. (2015) regarding the estimation of the fines content and N-value, the correlations between SPT and SDS tests were analysed. Tabular data for the field properties of the model sites are listed in Table 1 for reference.
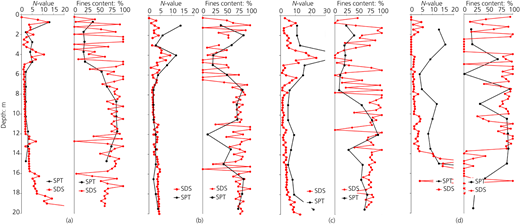
Figure 6 shows examples of visual comparison between the SPT parameters (N SPT and FCSPT) and estimated SDS values (N SDS and FCSDS) at Wawang Pulo Elementary School (Figure 6(a)), Paombong Central School (Figure 6(b)) and City of Malolos Integrated School (Figure 6(c)). Distances between the SPT and SDS for the three schools are less than 5.00 m. As observed in the graphs, the trend of the estimated N SDS (red line) is consistent with the movement exemplified by N SPT (black line). Similarly, FCSDS demonstrates a slightly jagged trend, but the overall trend is similar to that of the SPT.
On the other hand, some SDS data show a poor-fit correlation with SPT. One example is shown in Figure 6(d), which is for a test site at Tanza Elementary School, Navotas City. At depths of 0–14.00 m, the N-values estimated in SDS are noticeably underestimated, limited to values less than 5. In contrast, the actual SPT N-values are comparably higher, ranging from 4 to 16. In terms of fines content, some values calculated using SDS show the exact opposite trend from SPT (specifically at depths of 6 and 15 m).
One possible reason for the anomaly is the distance between the two methods. Compared with the three previous examples where the SPT and SDS locations are situated near to or at less than 5.00 m away from each other, the SDS test at Tanza ES was conducted 20.00 m away from the available in situ test. Because of some constraints inside the campus, the expected point of SDS was moved from the nearest location to a private lot outside the school perimeter. Therefore, there is a high possibility that the discrepancy between the recorded results was due to the difference in subsurface materials caused by the substantial distance between the two tests. Furthermore, the limitation of the machine should also be noted, including the inability to obtain soil samples for further testing and the maximum capacity of penetration (usually at N-value > 15)
In the statistical analysis, subdivision of material was first performed in accordance with the USCS classification from the SPT data for easier categorisation. Coarse-grained soils or sand groups include SW, SP, SM and SC, whereas fine-grained soils are composed of ML, MH, CL and CH.
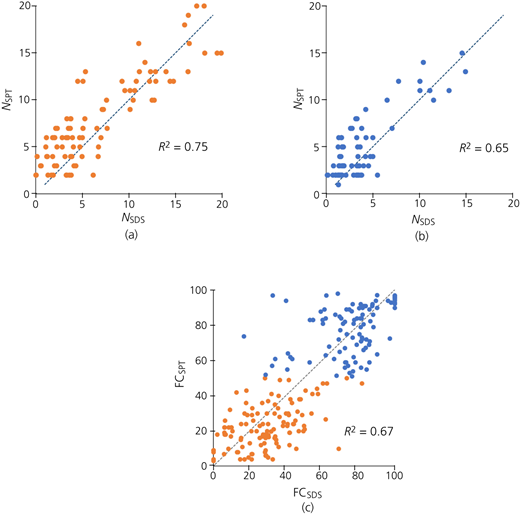
To estimate the N-value, the correlation between 92 data sets for coarse-grained soils and 83 data sets for fine-grained soils was analysed. The equivalent N SDS of the same N SPT depth layer was selected as a pair of data. Figures 7(a) and 7(b) show the correlation (R 2) between N SDS and N SPT in the coarse-grained and fine-grained soil groups, respectively. Similarly, a total of 216 data sets were assessed to estimate the fines content. Among them, 119 data sets were classified as coarse-grained with an FCSPT of less than 50%, while the remaining data sets were categorised as fine-grained with an FCSPT more than 50%. Figure 7(c) shows the correlation between FCSDS and FCSPT.
The resulting R 2 for the coarse-grained group N-value correlation was 0.75 – that is, a strong correlation – while a 0.65 R 2 or a moderate correlation was observed for the N-value in the fine-grained group. Lastly, for the correlation of fines content, the calculated R 2 was 0.67, which was also a moderate correlation.
In their methodologies, the specifications of the two tests are not characteristically similar. The sampling interval or the number of readings per layer is different from the usual 1.00–1.50 m of SPT to the 0.25 m of SDS. The values generated also have different functions, and therefore, it is expected that some layers will not produce a complete duplicate of the output because of the uniqueness of each method. Thus, scatters are present in the correlation model. In addition, the distance and test time interval between some of the SPT and SDS points might also contribute to the scatter.
Initial soil classification chart in Philippine soil conditions
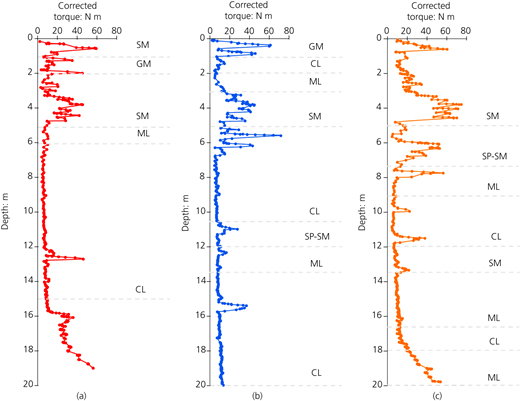
The graphical result of T values shows a pattern supported by the definitive characteristics of the available USCS data. In Figure 8, three similar representative schools show differences in the T signals of sandy, silty and clayey materials in the Philippine setting. Sand materials (SM), which are comparably harder to penetrate than clay or silt materials (CL, ML), produced a high and jagged torque signal. In contrast, soft material tends to concentrate on the low-value torque region.
Further combination of T with W produced another parameter known as d T/d W. A positive slope was found for frictional soil – sandy material – and an almost zero or negative slope was found for frictionless fine materials such as silt or clay (Figure 9). Similarly, the same slope trend was observed in c p, which is the ratio between N sd D and πT/WD at each 25 cm (Figure 10).
The relationship between d T/d W and (Figure 11) shows the classification of soil in the western coastal part of the Philippines using SDS. The USCS in borehole logs was used for soil classification. Analysis of the relationship between d T/d W and illustrates that section A, categorised as the sand section, is concentrated on the upper right of the graph, showing larger values of and d T/d W equal to or greater than 1. This behaviour is expected of sand because the tendency of the rod as it penetrates the soil is to rake out sandy materials as opposed to pushing soil outwards in clayey soil. Section A comprises coarse-grained material with a USCS code of SM, SP-SM. Section B, which is concentrated on the middle region, denotes the silt and clay section, with materials usually classified as ML and CL. Lastly, section C is categorised as the clay section of high plasticity, which is concentrated on the lower left region; this mainly consists of CH. The categorised plot of against d T/dW shows a similar trend to the soil classification developed in Japan reported by Tanaka et al. (2012). In conclusion, Figure 11 can be the preliminary soil classification chart in a Philippines setting. More data are needed to delineate further the unique boundary between materials.
Liquefaction evaluation of selected schools
The evaluation of FL is conducted based on Equation 3 of JRA. At the same time, LPI is assessed based on the study by Iwasaki et al. (1982). Geotechnical parameters used for SDS calculation are based on the derived estimated formula discussed in the previous section. Furthermore, similar WTD and PGA for each site are considered for both SPT and SDS tests to analyse comprehensively the efficiency of the new method in liquefaction analysis. Detailed results of LPI category calculated from SDS and SPT are shown in Table 2. The corresponding liquefaction assessment from the DOST–Phivolcs hazard map is also shown in Table 2.
The majority of the LPIs in both SDS tests and SPTs resulted in a high to remarkably high liquefaction potential risk. Cities situated adjacent to water bodies were the areas with high to very high liquefaction classification, while sites located near or atop the Guadalupe Formation or Central Plateau deposits produced a very low to low liquefaction potential.
Comparative liquefaction assessments between SDS and SPT, as well as between SDS and the hazard map of DOST–Phivolcs, are shown in Tables 3 and 4. For SDS and SPT, two divisions were made: (a) the very low and low and (b) high to very high liquefaction potential categories. As shown in Table 3, only three out of seven schools, according to the SPT results, resulted in a low and very low liquefaction potential classification; thus, the per cent match was 42.86%. On the other hand, the remaining 21 schools with SPT data provided a 100% match with SDS in terms of LPI category (high and very high). Overall, 85.71% match was observed between SDS and SPT.
As the general data (WTD and PGA) for each site are given with the same values, the difference in LPI results can be deduced to the layer thickness of the calculated liquefiable soil and slight differences in the geotechnical parameters (N-value and fines content). To reiterate, the sampling interval for SPT is observed every 1.00–1.50 m, while it is 0.25 m for SDS. Therefore, in calculating the factor of safety and the corresponding LPI, the result from SDS is found to be more detailed. In turn, the number of liquefiable layers is expected to be different between SDS and SPT. Moreover, the slight variation or distance between two tests is also a factor that may cause a variation in the results. Lateral heterogeneity might be present in specific schools. Therefore, the parameters obtained from SPT are different from the estimated SDS parameter.
In terms of liquefaction evaluation between SDS and the DOST–Phivolcs hazard map, a total of 85.71% match was calculated. Similar to the SDS and SPT comparative assessment, two divisions were made: (a) very low and low and (b) moderate, high and very high liquefaction categories. A 100% match (two out of two) was observed in the very low and low category. One site was located at Las Piñas Science High School, which was atop a Guadalupe Formation of a Central Plateau geomorphologic manifestation. This type of location was unlikely to liquefy due to the presence of a hard underlying material manifested by the geology, as confirmed from both the SDS and SPT results. As for the other division, 46 schools out of 54 schools resulted in a moderate, high and very high liquefaction evaluation risk.
The data difference between SDS and the DOST–Phivolcs liquefaction map can be traced to the area extent of hazard evaluation. SDS is a site-specific test, while the hazard map represents assessment of a large scope area. In addition, some significant features are present in the field, but they are not considered in the hazard mapping. For instance, Arkong Bato National High School has a high liquefaction potential in the hazard map but a very low liquefaction potential in SDS and SPT. Multiple attempts were made using the SDS machine, but the maximum penetration depth reached was only 1.25 m. Moreover, the downhole profile of the site from the SPT report showed layers with N-values of 15 up to 60. These values represent a dense material that is unlikely to liquefy, opposite to the result of the hazard map.
Figure 12 shows the hazard map of DOST–Phivolcs including the overlain SDS LPI points. The majority of the sites with a very high liquefaction potential in SDS are aligned with the hazard map of DOST–Phivolcs. However, in southern GMMA, some isolated cases are recorded. A similar justification as that for Arkong Bato National High School was supported by the data difference. Nevertheless, overall, the liquefaction analysis performed using the SDS provided a result where the majority of the classification agreed with the SPT data and the liquefaction published map of DOST–Phivolcs.
Seasonal variation result
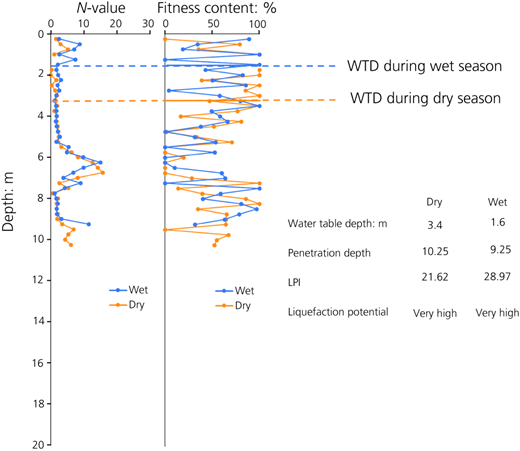
The research project also helped to understand better the subsurface characteristics of school sites with seasonal variation as a factor. A substantial difference in WTD below the ground surface was observed in Meycauayan City West Integrated School. Using GPR equipment, a WTD of around 3.4 m was taken on 12 April 2021, during the dry season, and a depth of around 1.6 m was taken on 27 September 2021, during the wet season. The difference can be specifically attributed to a rainfall event that occurred a day prior to the survey. Precipitation events caused WTD to rise, particularly in coastal areas where WTD was relatively shallow and was easily influenced by the changes in precipitation.
Based on the trend lines produced by the estimated N-value and FC%, no notable changes were observed between the dry and wet seasons (Figure 13). The main difference is the calculated LPI values, with a substantial difference in LPI values as high as 61%. Therefore, the SDS data provide the same readings regardless of the season conditions, and the changes can be mainly attributed to the much shallower WTD recorded, as the depth of water table is a critical factor in the liquefaction susceptibility of the site.
Conclusions
The purpose of this study was to classify the soil and evaluate the site-specific liquefaction of selected schools in GMMA using the SDS method based on the compilation of previous SDS papers. Regression analysis was performed to establish an effective relationship between the SPT and SDS data. Moreover, the relationships between dT/dW and were plotted to represent the USCS classification in Philippine settings using SDS. Liquefaction parameters were also then calculated using the estimated values gathered in the prior discussion. In summary, the conclusions of this study are listed as follows.
The statistical results for estimating the N-value and fines content using SDS show a moderate to high correlation with R2 of 0.75, 0.65 and 0.67 on N-value in sandy soil, N-value in clayey soil and fines content correlation, respectively.
An initial soil classification chart was plotted based on Tanaka’s study on the relationship between and dT/dW. Trends of the general soil type (sand, silt and clay) are shown on the chart. The sand section occupies the top right side of the graph, the section of clay of high plasticity is on the lower left side and in between the two sections is the silt and clay type material.
The majority of the calculated SDS LPIs resulted in a very high liquefaction potential risk, confirming the theoretical assumption that the study area in the coastal western part of GMMA is prone to liquefaction. In terms of comparative LPI values, the SDS and SPT analyses also show a good correlation, specifically in the Metro Manila area.
Overall, the SDS test can be an effective alternative method in soil studies and quantification of the liquefaction potential of a site.
Acknowledgements
This project is supported by the DOST Grant-in-Aid Program and monitored by the Philippine Council for Industry, Energy and Emerging Technology Research and Development. The project is implemented by DOST–Phivolcs, with the co-operation of Department of Education.