The flocculation and sedimentation of suspended clay particles in marine environments are an important process to form natural marine clays. In this study, the process of flocculation and sedimentation is simulated using appropriate flocculating agents in the laboratory. A series of laboratory sedimentation tests are carried out on various floc samples prepared with different concentrations of flocculating agents, and the size and density of flocs are measured and are found to serve as good parameters to characterise the development of flocculation. Multiple series of undrained triaxial compression tests under normal consolidation, as well as under over-consolidation, are then carried out on a slightly flocculated sample and a largely flocculated sample, as well as an ordinary remoulded sample. The values of the undrained shear strength of the flocculated samples are compared with those of the ordinary remoulded sample. The largely flocculated sample exhibits a higher undrained shear strength under normal consolidation as well as under over-consolidation. A comparison with past studies on natural marine clays also indicates that the highly variable values of the undrained shear strength of marine clays can be attributed to the different levels of development of flocculated structures in clays.
Notation
- A
area of a floc assumed as a polygon in the laboratory sedimentation test
- B
coefficient of pore pressure
- D50
particle size corresponding to 50% finer
- D60
particle size corresponding to 60% finer
- d
floc size analysed in the laboratory sedimentation test
- e
void ratio
- g
gravitational acceleration
- Ip
plasticity index
- Ko
coefficient of earth pressure at rest
- L
fall distance in the laboratory sedimentation test
- M
inclination of the failure envelope in p′–q
- p′
effective mean stress under triaxial conditions
- q
deviatoric stress under triaxial conditions
- qu
deviatoric stress at the ultimate state
- Su
undrained shear strength
normalised undrained shear strength
- v
settling velocity
- w
water content
- wL
liquid limit
- wP
plastic limit
- ΔT
time interval in the laboratory sedimentation test
- ϵa
axial strain
- η
dynamic viscosity of water
- ρe
effective floc density
- ρf
density of flocs
- ρs
density of soil particles
- ρw
density of water
effective confining stress
- σv
consolidation stress
- φ′
internal friction angle
Introduction
When a stream or river enters the estuarine and marine environments, it loses its velocity and most of the coarse-grained soil particles transported on its flow are subject to sedimentation. Part of the fine-grained soil particles remain in suspension and meet cations that abound in these environments. The flocculation of suspended clay particles then resumes under the presence of exchangeable cations. Organic polymers, which also abound in these environments, are conceived to be responsible for binding, bridging and building up larger flocs. The growth of such larger flocs in suspension eventually results in sedimentation. The sediments of flocs accumulate on sea floors and consolidate to form natural marine clay layers.
The size of flocs in natural estuarine environments varies significantly. Underwater monitoring of estuarine environments has indicated that the size of settling flocs varies with tidal events and increases up to 0.15 mm (Yamamoto et al., 2012; Zhu et al., 2022), and fragile flocs grow to as large as 2.2 mm dia. (Manning et al., 2006). Sampling of natural cohesive sediments collected from the Thames estuary in London indicated that the size of flocs varies widely from the order of 0.01 mm to over 1 mm (Spencer et al., 2021).
The mechanism of flocculation of suspended solid matters has been independently explored in coastal engineering and water science technology. The size, shape and effective density of flocs have been investigated by observing flocs in the sea, as well as by conducting laboratory sedimentation tests on flocs in the presence of various cations and polymers (Fan et al., 2020; Lee et al., 2012; Manning et al., 2006; Oda et al., 1999; Spencer et al., 2021; Yamamoto et al., 2012; Zhu et al., 2022). In water science technology, the roles of coagulant such as cations as well as flocculants such as polymers on the process of flocculation have been examined, and flocs are categorised into four groups that vary in size: primary particles, flocculi, microflocs and macroflocs (Lee et al., 2012). Primary particles are fine particles of various origins that vary in size from 0.25 to 2.50 μm. Flocculi are strongly bound clay minerals that vary in size from 10 to 20 μm. Microflocs consist of flocculi and primary particles that vary in size from 0.05 to 0.20 mm. Macroflocs are built from microflocs, primary particles and flocculi and are larger than 0.2 mm. Flocs are also known to exhibit loose porous structures, within which part of the molecules of water are immobilised and effectively control their density and porosity (Kotlyar et al., 1998).
It is known that there are two extremes of flocculated and dispersed structures, and any natural clays may exist between these two extremes (Lambe and Whitman, 1979; Lancellotta, 2009). The undrained shear strength is an important strength parameter for stability analysis and has been reported for natural marine clays by various researchers (Hanzawa and Tanaka, 1992; Jamiolkowski et al., 1985; Ladd and Edgers, 1972; Nakase and Kamei, 1988). However, the influence of the flocculation and sedimentation process on the resulting undrained shear strength of clays has been scarcely explored.
Floc characteristics
The flocculating agents in this study are magnesium salt and polyethyleneimine of dimethylaminoethyl acrylate and methacrylate copolymer composition. Magnesium salt would serve as a coagulant to release magnesium (Mg2+) cations, which would neutralise negatively charged suspended clay particles. Polyethyleneimine would serve as a flocculant to release cationic polymers, which would flocculate neutralised suspended clay particles, form visible flocs and eventually subject flocs to sedimentation. The reasons for choosing these flocculating agents are manifold: they contain cations as well as polymers similar to those in marine environments, they are known to be capable of inducing the flocculation of soils effectively and they are commercially available and not harmful to surrounding environments.
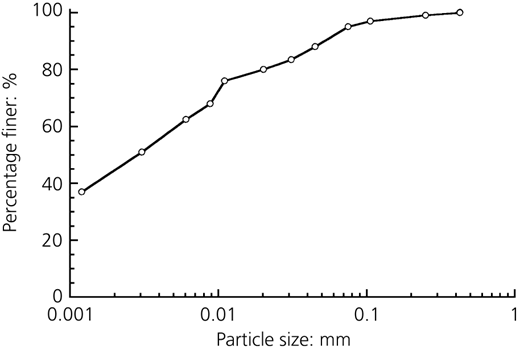
Flocs are fragile and difficult to sample and they vary in size (Spencer et al., 2021). The methodology for observing the size, shape and effective density of flocs using still and video cameras and microscopes has been explored in past studies (Fan et al., 2020; Oda et al., 1999; Spencer et al., 2021; Yamamoto et al., 2012). In the present study, a series of laboratory sedimentation tests were conducted to observe the size, shape and settling velocity of flocs formed from Kasaoka clay using a digital microscope. Kasaoka clay mainly contains clay minerals of montmorillonite and kaolinite, although it contains a substantial amount of silt as well as a small fraction of sand. The varying sizes of clay, silt and sand particles present in this soil sample are conceived to provide favourable flocculating environments. The physical properties of Kasaoka clay mixed with deionised water are as follows: density of soil particles ρs = 2.65 g/cm3, liquid limit wL = 57.5%, plastic limit wP = 26.3% and plasticity index Ip = 31.2. The particle size distribution is shown in Figure 1, and the particle sizes corresponding to 50 and 60% finer are approximately D50 = 0.003 mm and D60 = 0.005 mm, respectively. It is noted here that the flocculation of soils would not alter the grain size distribution of soils that is determined in a dry state.
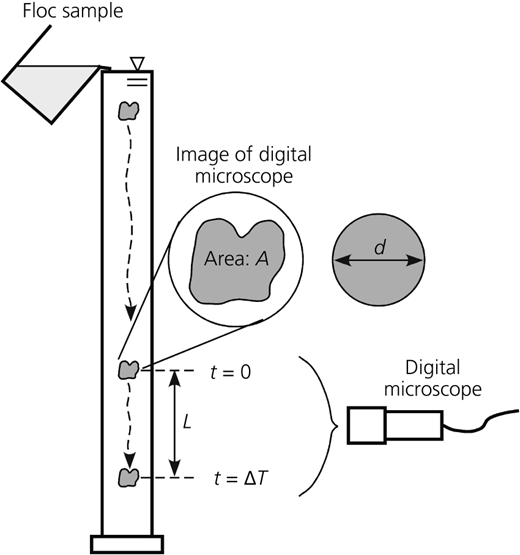
The floc size may vary in accordance with mixing ratios of clay and chemicals. Based on preliminary tests with a dozen of different mixing ratios of clay and chemicals, three different floc samples were prepared, as shown in Table 1. For example, in floc sample 1, a 40 g dry mass of powdery clay was first mixed with 1960 ml of deionised water. A 0.035 g mass of the chemical was also separately diluted with 50 ml of deionised water. The clay suspension and chemical solution were then mixed and blended with the same intensity of energy. Laboratory sedimentation tests were then conducted, using the three different floc samples shown in Table 1. Flocs settled more slowly than particles of silt with the same size, and a total of 60 flocs were filmed in each test, as shown in Figure 2, in which the free fall of each floc in the terminal velocity stage was observed at a time interval of 0.5–1.0 s. The settling velocity was determined as the fall distance L divided by the time interval ΔT. In addition, the screen image of each floc was assumed as a polygon and extracted, and the area A of the assumed polygon was analysed. The floc size d was then assumed as a diameter of a circle whose area would be equal to that of the polygon. The sedimentation of each floc in the terminal velocity stage followed Stokes’ law, and the effective floc density ρe could be determined as follows:
where ρf and ρw are the densities of flocs and water, respectively; η is the dynamic viscosity of water; v is the settling velocity; and g is the gravitational acceleration.
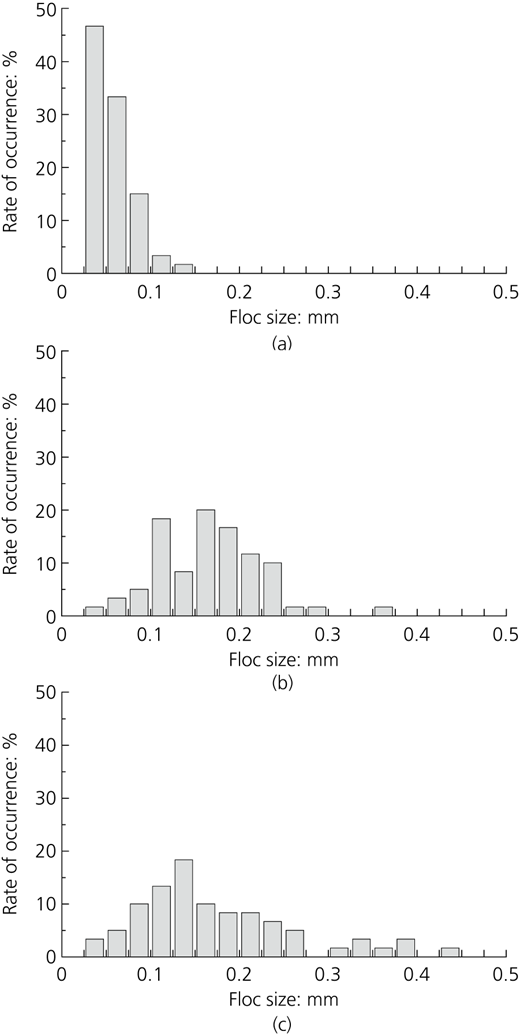
The rates of occurrence of flocs at individual ranges of sizes are plotted in Figure 3. The rate of occurrence was calculated as the number of flocs belonging to each range of sizes divided by the total number of flocs, 60. For floc sample 1, the floc sizes were all less than 0.15 mm, yet most of the flocs were larger than the value of D50 = 0.03 mm of Kasaoka clay itself. For floc sample 2, the floc sizes varied between 0.10 and 0.25 mm. For floc sample 3, there were some flocs as large as 0.30–0.45 mm, including the sizes of microflocs and macroflocs.
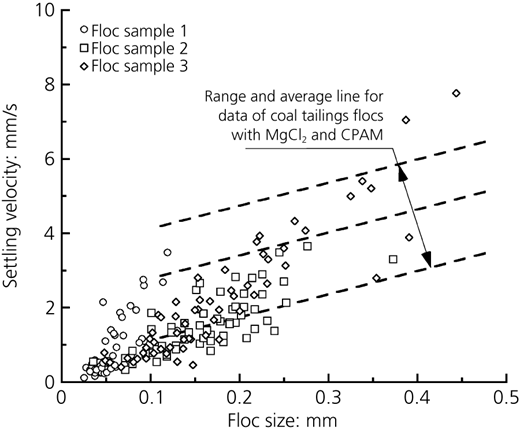
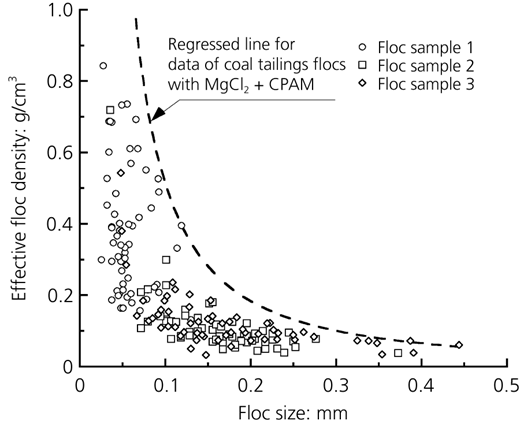
The plots of the settling velocity against floc size are shown in Figure 4. Larger flocs would settles faster than smaller flocs. In fact, the settling velocity increases as the floc size becomes larger, as shown in Figure 4. For comparison, the range and average line for the data of coal tailings flocs flocculated with the cations of magnesium chloride (MgCl2) and the cationic polymer of polyacrylamide (CPAM) are also indicated in Figure 4 (Fan et al., 2020). The plots of the effective floc density against floc size are shown in Figure 5. As larger flocs would contain more immobilised adsorbed water in their loose porous structures, the apparent floc density would reduce as the floc size becomes larger. In fact, when the floc size is larger than 0.2 mm, the effective floc density becomes lower than 0.1 g/cm3, as shown in Figure 5. For comparison, the regressed line for coal tailings flocs flocculated with magnesium chloride and CPAM is also indicated in Figure 5 (Fan et al., 2020).
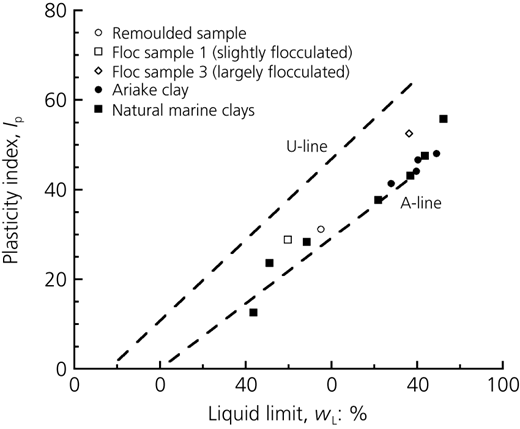
In the plasticity chart shown in Figure 6, the specific clay minerals are known to plot along the A-line and U-line. The U-line represents the dominant fraction of montmorillonite, whereas illites and kaolinite are located above and below the A-line (Holtz and Kovaks, 1981). Kasaoka clay contains mostly the clay minerals montmorillonite and kaolinite, and it is found that all the plots of Kasaoka clay lie between the A-line and the U-line, for both remoulded and floc samples. It is noted here that the plasticity of clays is apparently the inherited from natural processes beginning from their origin down to the current state; therefore, it may also be affected by the process of flocculation. In fact, compared with the remoulded sample and slightly flocculated sample (floc sample 1), the largely flocculated sample (floc sample 3) exhibited larger values of wL and Ip, yet it is plotted between the A-line and the U-line. In Figure 6, the plots of Ariake clay and natural marine clays are also shown (Hong et al., 2006; Nakase and Kamei, 1988). Ariake clay is a very soft sensitive clay that prevails in the coastal plain around Ariake Bay in Kyushu of Japan. The natural marine clays are the clay samples dredged from seven ports of Japan. Data on the undrained shear strength of these clays are also mentioned in the following section.
Specimen preparation
There were three different clay samples prepared in the present study. These were a remoulded sample, a slightly flocculated sample and a largely flocculated sample. The remoulded sample was prepared by simply mixing powdery clay at a water content 1.3 times as high as the liquid limit wL. The slightly and largely flocculated samples were prepared from floc samples 1 and 3, respectively, as indicated in Table 1. It is important to notice in Figures 3 and 5 that floc sample 1 contains flocs mostly less than 0.1 mm and the effective floc density is still large, whereas floc sample 3 contains flocs as large as 0.4 mm and its effective floc density is very low. It is conceived that floc sample 3 holds more loose porous structures with abundant adsorbed water.
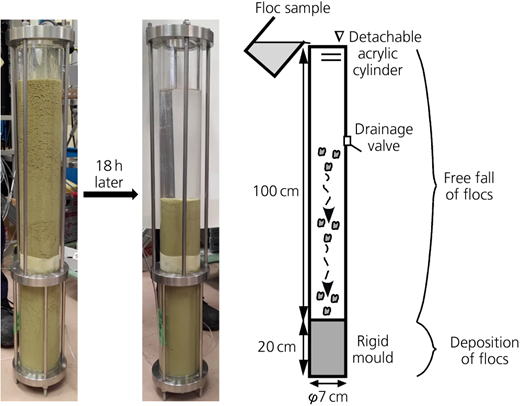
To achieve free-fall sedimentation of flocs in water, a detachable 1 m long acrylic cylinder was mounted on a rigid 7 cm dia. and 20 cm high mould and filled with water, as shown in Figure 7. Nearly 50 bottles of 1 litre floc samples were prepared, and each bottle was poured from the top of the 1 m long cylinder filled with water, by using a plastic funnel. After a time interval of 8 min, the drainage valve located 40 cm below the top of the long cylinder was opened, and the turbid water left in the top section of the long cylinder was drained out. The drainage valve was then closed, and the next bottle was poured again. This procedure allowed free-fall sedimentation of flocs for a distance of 60–80 cm at all times and was repeated until all the necessary bottles were poured. It was necessary to wait for at least 12 h to allow for completion of sedimentation and self-weight consolidation.
Multiple series of isotropically consolidated undrained triaxial compression tests were carried out on Kasaoka clay specimens in the present study.
In one series of tests, the remoulded sample, slightly flocculated sample and largely flocculated sample were prepared in the rigid mould and consolidated up to three different levels of consolidation stress of σv = 100, 200 and 400 kPa. They were then unloaded to an ambient atmospheric pressure and extracted from the mould. Triaxial specimens 5 cm dia. and 10 cm high were then trimmed out of the consolidated samples and mounted in the triaxial apparatus. Upon confirming that the coefficient of pore pressure B was greater than 0.95, they were isotropically reconsolidated to the same levels of effective confining stress, , 200 and 400 kPa, and subjected to undrained triaxial compression at an axial strain rate of 0.01%/min. This series is termed ‘normal consolidation’.
In the other series of tests, the remoulded sample and largely flocculated sample were prepared in the rigid mould and consolidated up to three different levels of consolidation stress of σv = 300, 500 and 1000 kPa. They were then unloaded and extracted from the mould. The triaxial specimens were then trimmed out and mounted in the triaxial apparatus. They were isotropically reconsolidated to an effective confining stress of and subjected to undrained triaxial compression. This series is termed ‘over-consolidation’.
The process of all these operations on Ko loading and unloading in the mould, extracting, trimming and isotropic reloading in the triaxial apparatus would have induced inevitable changes in the stress acting on the specimens (Lambe and Whitman, 1979). Nevertheless, this is the technical procedure employed in the present study, in order to prepare dozens of triaxial specimens.
Test results
Undrained shear strength under normal consolidation
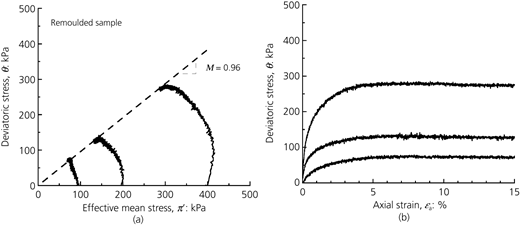
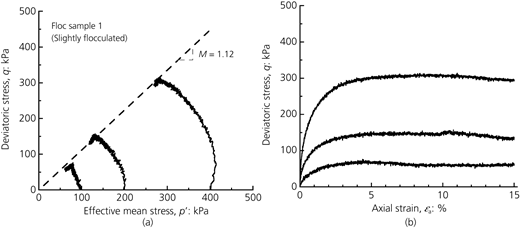
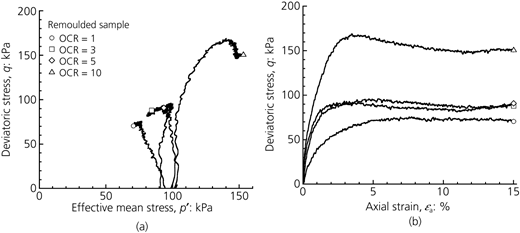
The results of isotropically consolidated undrained triaxial compression tests on the specimens prepared from the normal consolidated remoulded sample are shown in Figure 8. In Figure 8(a), the effective stress path in terms of effective mean stress p′ and deviatoric stress q is shown. The stress–strain relation in terms of axial strain ϵ a and deviatoric stress q is shown in Figure 8(b). From the inclination M of the failure envelope drawn in the diagram of p′–q in Figure 8(a), it is possible to calculate the internal friction angle φ′ as follows:
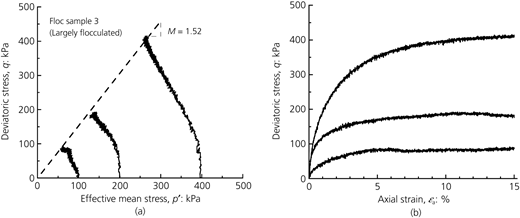
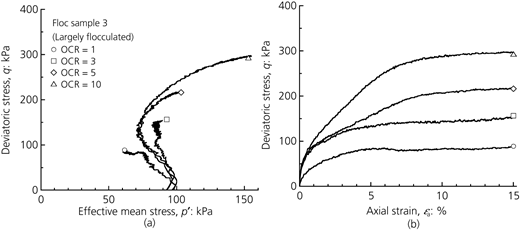
The φ′ value is therefore 24.5° for the remoulded sample. The test results for the slightly flocculated sample and largely flocculated sample are also shown in Figures 9 and 10. The φ′ values for the slightly flocculated sample and largely flocculated sample are calculated as 28.3 and 37.5°, respectively. When the two extremes of flocculated structure and dispersed structure are compared, it is more likely that the flocculated structure would exhibit a higher strength than the dispersed structure, due primarily to the interparticle attraction and greater difficulty of displacing particles (Lambe and Whitman, 1979). In fact, the φ′ value for the largely flocculated sample is greater than those for the remoulded sample and slightly flocculated sample.
The undrained shear strength can be defined as the shear stress observed at the ultimate state. Since all the stress–strain relations shown in Figures 8(b), 9(b) and 10(b) achieved ultimate states at an axial strain of ϵ a = 15%, the value of undrained shear strength S u is determined as the shear stress at ϵ a = 15% in the present study. It then follows that the normalised undrained shear strength can be defined as the undrained shear strength S u divided by the initial effective confining stress at consolidation, as follows:
where q u is the deviatoric stress at the ultimate state.
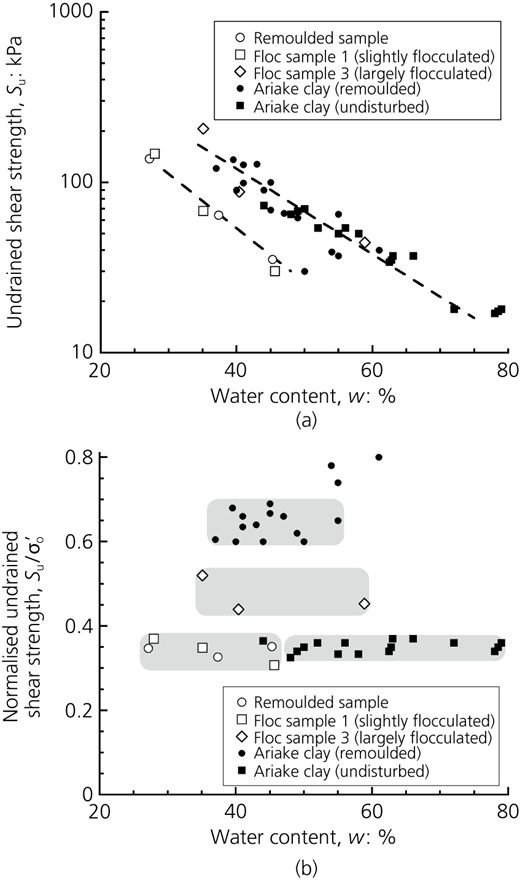
The plots of undrained shear strength S u as well as the normalised undrained shear strength against water content w are shown in Figures 11(a) and 11(b). The data of remoulded and undisturbed Ariake clays are also shown for comparison (Hong et al., 2006). All the data shown in Figure 11 are the results of isotropically consolidated undrained triaxial compression tests. In Figure 11(a), the undrained shear strength S u clearly reduces as the water content w increases, and the trend of the plotted data of the largely flocculated sample is similar to those of remoulded and undisturbed Ariake clays. In Figure 11(b), the normalised undrained shear strength for each sample does not vary significantly with the water content w. However, the values of for the largely flocculated sample are clearly larger than those for the remoulded sample and slightly flocculated sample.
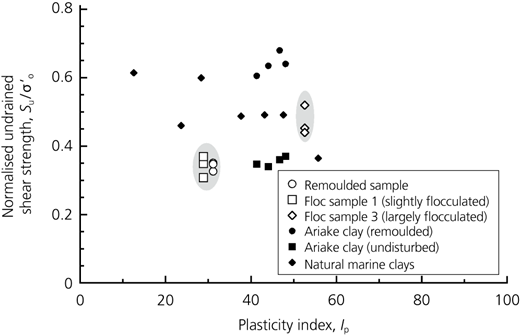
It has been customary to plot the normalised undrained shear strength under normal consolidation against the plasticity index I p (Bjerrum, 1954; Skempton and Henkel, 1954). Plots of this kind are shown in Figure 12. It is noted that the number of the plots of Ariake clay in Figure 12 is reduced as compared with those in Figure 11, since the average values for each sample of Ariake clay are plotted in Figure 12. It is also noted that all the data shown in Figure 12 are the results of isotropically consolidated undrained triaxial compression tests. In Figure 12, there seems to be no significant changes in the values of with respect to I p for each sample. It is known that the undrained shear strengths of clays are mostly distributed within the range of 0.2–0.4, and the plots of the remoulded sample and slightly flocculated sample are located within this range. However, the plots of the largely flocculated sample are higher than this range and are located similarly to those of natural marine clays. In fact, the values of and I p for the largely flocculated sample are both larger than those for the remoulded sample and slightly flocculated sample.
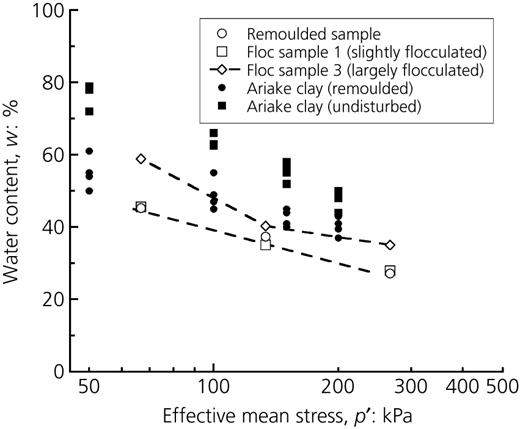
Some aspects of the effects of flocculation and sedimentation on the undrained shear strength under normal consolidation have been revealed, as described above. However, the effects of flocculation and sedimentation on compressibility remain unresolved. It would be worthwhile to shed some light on this issue, based on the data available from the present study. The vertical settlement of the saturated clay sample in the mould was monitored during K o consolidation, and it is possible to calculate the value of water content w of the sample at each consolidation stress σ v. It is also possible to estimate the value of effective mean stress p′, by assuming an appropriate value of K o. Herein, the value of K o may vary from 0.4 to 0.6, and it may be appropriate to assume that K o = 0.5 (Hanzawa and Tanaka, 1992; Nakase and Kamei, 1988). The plots of water content w against effective mean stress p′ during K o consolidation are shown in Figure 13. The conversion of the stress parameter from σ v to p′ was necessary to make comparisons with the data of remoulded and undisturbed Ariake clays, which were observed under isotropic consolidation (Hong et al., 2006). It was expected that larger flocs would contain more loose porous structures with abundant adsorbed water and were likely to show a higher water content. In fact, the largely flocculated sample exhibited higher values of water content w than the remoulded sample and the slightly flocculated sample, as shown in Figure 13. The data of remoulded Ariake clay were closer in trend to those of the largely flocculated sample, although it is important to recognise the difference between the K o and isotropic stress conditions of the two clays. The compressibility can be inferred from the inclination of the relation between w and p′, since the water content w is directly related to void ratio e under saturated conditions. There seems to be no large difference in the inclinations among the samples tested in the present study.
Undrained shear strength under over-consolidation
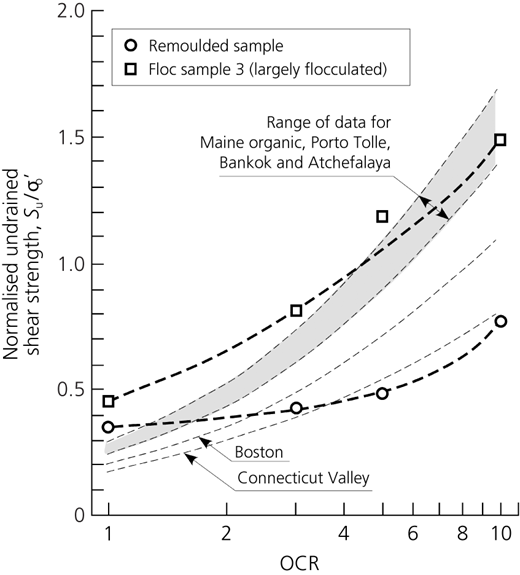
The results of isotropically consolidated undrained triaxial compression tests on the specimens prepared from the over-consolidated remoulded sample are shown in Figure 14. The test results for the largely flocculated sample are also shown in Figurex15. All the stress–strain relations shown in Figures 14(b) and 15(b) achieved the ultimate states at an axial strain of ϵ a = 15%. Therefore, the values of undrained shear strength S u can also be determined for the over-consolidated specimens. The plots of against over-consolidation ratio (OCR) are shown in Figure 16. It is interesting to see that as the value of OCR increases, the value of the of the largely flocculated sample increases rapidly. Therefore, the difference in the values of between the largely flocculated sample and remoulded sample becomes larger. The range and lines for the data of K o-consolidated undrained direct simple shear tests on various clays, including natural marine clays, are also shown in Figure 16 (Ladd and Edgers, 1972; Lancellotta, 2009). It is found that the effects of OCR vary tremendously among the various clays. Herein, for comparing the data of the various clays and the present study, it is important to recognise the difference in the shearing modes of direct shear and triaxial compression. Nevertheless, it is worth noting that the plots of the remoulded sample lie at the lower end of the various clays, whereas those of the largely flocculated sample lie close to the upper end. It is conceived that the effects of flocculation and sedimentation could be one of the important factors that would be attributable to the varying effects of OCR on the undrained shear strength.
Discussion
The experimental findings in the present study should raise some discussions from soil mechanics standpoints as well as practice-oriented standpoints.
From soil mechanics standpoints, it has long been known that all natural clays exist between the two extremes of flocculated structures and dispersed structures (Lambe and Whitman, 1979; Lancellotta, 2009). It is also known that the process of flocculation and sedimentation is a natural consequence that all fine-grained soils encounter in marine and estuarine environments. It was demonstrated in the present study that the process of flocculation and sedimentation could be simulated using some flocculating agents in laboratory study, and the development of flocculated structures in fine-grained soils could be evaluated by statistical analysis of the size and density of flocs, as has been employed in coastal engineering and water science technology. It was then demonstrated from the test results shown in the plasticity chart in Figure 6 that the flocculation of fine-grained soils could be linked in some way or another to the physical properties, particularly to the development of plasticity. Conversely, the process of flocculation and the resulting development of soil plasticity could be artificially reproduced and controlled by using some flocculating agents in laboratory study. It was also demonstrated from the results of laboratory triaxial tests shown in Figures 11–13 and 16 that the flocculation of fine-grained soils could be closely linked to the mechanical properties associated with consolidation and undrained shear, particularly to the highly variable values of undrained shear strength under over-consolidated conditions. Therefore, even when flocculated structures in fine-grained soils were subjected to consolidation and undrained shear, the impact of flocculation remained present, where the flocculated structures tended to retain porous fabric and to be resistant to shear. Nevertheless, it was also conceived that the process of flocculation and the resulting development of undrained shear strength could be artificially reproduced and controlled by using some flocculating agents in laboratory study.
From practice-oriented standpoints, the emphasis of the present study should be placed on the following aspects. In response to the increasing social demand for offshore power development, the stability of sea floor deposits needed to be assessed carefully. In doing so, instead of resorting to high-quality soil sampling from sea floor deposits, the present study paved the way for proposing an alternative procedure to evaluate the stability of sea floor deposits by artificially replicating the process of flocculation in fine-grained soils with the help of some flocculating agents and reproducing soil samples similar in physical and mechanical properties to natural marine clays.
Conclusions
The process of flocculation and sedimentation of fine-grained soils was simulated using some flocculating agents, and the size and density of flocs were measured in laboratory sedimentation tests. Statistical analysis of the size and density of flocs was found to serve as a good method to characterise the development of flocculation in fine-grained soils. The laboratory test results on the plasticity chart revealed that the development of plasticity in fine-grained soils should be linked in some way or another to the development of flocculation. Multiple series of laboratory triaxial tests were then carried out. When the clay particles were largely flocculated and subjected to sedimentation, the flocculated sample exhibited a higher water content than the ordinary remoulded sample, due to the loose porous structure developed during flocculation. However, they also exhibited larger internal friction angle and undrained shear strength under normal consolidation. They exhibited even larger undrained shear strength under over-consolidation. The undrained shear strength and normalised undrained shear strength of the flocculated sample were similar in trend to those of some natural marine clays. The present study contributed to revealing some of the aspects associated with the physical and mechanical properties, particularly the plasticity and the undrained shear strength of natural marine clays, with particular attention to the effects of flocculation and sedimentation. After all, it should be emphasised that the present study contributed to paving the way for proposing a procedure for evaluating the stability of sea floor deposits by artificially replicating the process of flocculation with the help of some flocculating agents and reproducing soil samples similar in physical and mechanical properties to natural marine clays.
Acknowledgements
The authors acknowledge M. Miyano and K. Sato, past students of the Tokyo University of Science, for their co-operation in carrying out the laboratory tests described in the present study. The publication of the present study would not have been possible without their ceaseless efforts.