A topple is a common rock slope failure – and usually the cause of a rockfall – that depends on the slope and rock geometries. This paper presents a laboratory simulation and field generation of a single-column rock topple failure. Innovative inertial measurement unit (IMU) sensors were used to collect three-dimensional acceleration and angular velocity data during four laboratory experiments to understand and characterise general toppling behaviours. A topple is identified by the gradual change in at least two gravity accelerations, the continuous increase in at least one of the angular velocities and a significant change in the linear acceleration in the direction of toppling. A field experiment showed similar sensor data patterns to those observed from the laboratory experiments. An isolated-block stability analysis of a single-column topple provides the basis for incorporating the IMU sensors into the development of future monitoring and early warning systems.
Notation
- g
gravitational constant
- gx
gravity acceleration in x-axis
- gy
gravity acceleration in y-axis
- gz
gravity acceleration in z-axis
- y
height of a rock block
linear acceleration in x-axis
- ÿ
linear acceleration in y-axis
linear acceleration in z-axis
- Δx
width of a rock block
- θ
inclination angle of a block
- Ψp
dipping angle of a rock block
- ω
angular velocity
- ωx
angular velocity in x-axis
- ωy
angular velocity in y-axis
- ωz
angular velocity in z-axis
Introduction
Topple is one of the most common landslide failures on slopes, especially rock slopes having a set of discontinuities dipping steeply into the slope face and striking approximately parallel to it (Norrish and Wyllie, 1996). Topple occurs when a rock column rotates forward and the center of gravity of the mass falls outside the base dimension. An analytical model for toppling analysis and the kinematic analysis using a stereonet projection was proposed by Goodman and Bray (1976). However, analytical procedures developed by researchers are not as clear-cut as for other failure modes, particularly the concept of factor of safety (Turner and Schuster, 1996). A series of nomograms to assess the toppling stability were established by Choquet and Tanon (1985), utilising computer solutions developed by Hittinger (1978). The unique nomograms were developed based upon the interlayer angle of shearing resistance and geometry of a toppling block. Toppling failures are frequently observed on man-made highway infrastructure (Cruden and Martin, 2006; Cruden and Varnes, 1996; Majdi and Amini, 2011; Ren et al., 2009; Strouth and Eberhardt, 2009; Tan et al., 2009), river dikes (Kuriqi et al., 2016) and open-pit mines (Alejano et al., 2010; Carlà et al., 2017; Kayesa, 2006), resulting in massive damages to facilities and risk to human lives. Furthermore, toppling failure occurs on natural slopes, which has led to road closures and created significant socio-economic impacts (Highland, 2012; Holmstadt et al., 2019).
To mitigate the losses due to toppling failures, several monitoring systems have been developed that aim to facilitate effective monitoring and failure prediction. Modern monitoring systems, such as terrestrial laser scanning (Kromer et al., 2017; Strouth and Eberhardt, 2009), ground-based interferometric synthetic aperture radar (Barla et al., 2011) and other ground-based radar devices (Carlà et al., 2017), have shown the potential to monitor toppling failures. Conventional systems, such as tiltmeters and extensometers, provide a direct measurement of toppling rotation and displacement (Oppikofer et al., 2012; Vanneschi et al., 2017). They have been implemented mostly for monitoring slowly deforming toppling failures (i.e., a few millimetres per year to centimetres per year) (Barla et al., 2011) and may not be effective for monitoring an instantaneous and rapid topple that occurs in several minutes to hours and requires the acquisition and processing of a large data set. On the other hand, microelectromechanical system (MEM)-based inertial measurement unit (IMU) sensors can collect and process data for slope monitoring and warning in a few seconds (Azzam et al., 2010; Kapoor et al., 2016; Kim, 2016). IMU sensors have been integrated with pressure sensors to study debris flows (Harding et al., 2014). A unified process model for an early warning system has been established to reduce the damage from geohazards through the integration of a data source from MEMs-IMU, data fusion and human/computer interfacing (Li, 2015). IMU sensors have been utilised to simultaneously measure triaxial accelerations and angular velocities (Testoni et al., 2019). The satisfactory agreement between the sensor measurements and that from a pinned steel beam model experiment revealed the suitability of the network system in real-time tilt monitoring applications.
A BNO055 MEMs-based IMU sensor device by Bosch© was selected in this study to meet the requirement of having a triaxial 14-bit accelerometer and a triaxial 16-bit gyroscope with a range of ±2000°/s (Giri et al., 2020). The IMU sensor consisted of a 32-bit cortex M0+ microcontroller running the sensor fusion software that combined readings from an accelerometer, a gyroscope and a magnetometer to obtain both gravitational and measured (total) accelerations. Using the orientation parameters, gravitational accelerations were deducted from the measured accelerations to obtain the linear accelerations in their respective x-, y- and z-axes (Shala and Rodriguez, 2011). A series of still experiments, constant rotation experiments and tilt experiments were conducted to evaluate the accuracy and determine the three-dimensional orientation of IMU sensors (Giri et al., 2020). The accuracy of accelerometer readings with respect to a local constant gravity acceleration of 9.8028 m/s2 was within ±0.0017 m/s2, and the accuracy of the gyroscope readings was within ±5°/s (Giri, 2017). The three orthogonal axes were conformed to the sensor axes by aligning the sensor with gravity (Geist et al., 2017) and checked against the gravitational accelerations from the still and tilt experiments. Laboratory experiments have been conducted to simulate fall (Giri et al., 2018a), translational slide (Giri et al., 2018b) and slide-flow (Giri et al., 2021), and this paper presents the study outcome on toppling.
The objective of this paper is to identify and describe the general toppling movement of a single-column block and understand its movement and failure behaviours using the IMU sensor readings through an experimental study. Studying the movement of a single-column toppling failure using the wireless IMU sensors is the first vital step in the identification of any toppling failures. The applicability of the wireless IMU sensors for toppling monitoring was evaluated by comparing the results obtained from the field and laboratory experiments. Typical sensor readings and data patterns were recognised to characterise a simple toppling failure behaviour. An isolated-block analysis was performed to determine the stability of a column against toppling. The criterion established from the isolated-block analysis provided the basis for monitoring toppling failures that could be incorporated into the future development of a prediction and early warning system for toppling failures. The novelty of this research is to demonstrate for the first time how the fusion of IMU sensor readings can be used to describe a rapid toppling failure, and the proposed criterion based on the isolated block analysis, along with IMU sensor data, can be implemented for monitoring a toppling failure and developing an early warning system.
Laboratory topple experiment
Experimental set-up
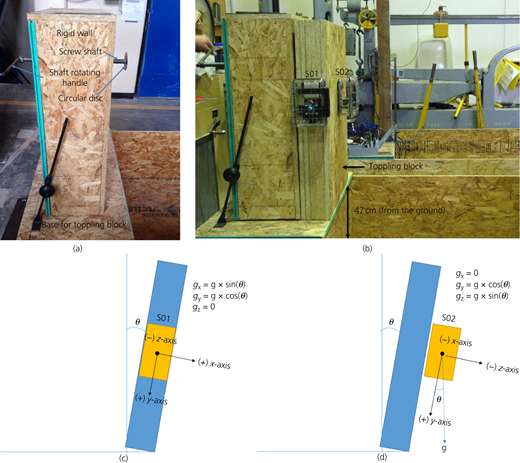
Four block topple experiments (T1 to T4) were conducted to simulate a single-column topple or the toppling of a series of bed rocks with a constant dip angle classified as a chevron topple (Cruden and Varnes, 1996) and a complex rock topple-rockfall (Varnes, 1978). The general set-up for the laboratory toppling experiments consists of a base for the toppling block and a rigid wall representing a bedding plane or rock slope discontinuity (Figure 1(a)). A push mechanism was designed to allow the forward rotation of the block and create a toppling failure. The push mechanism was built using a screw shaft of 1.90 cm external diameter (including threads) with a circular disc of 7.60 cm on one end of the screw shaft and a handle on the other end. This set-up was mounted on the rigid wall such that as the handle was being rotated clockwise, the screw would project linearly out of the wall at a rate depending on the applied revolutions per unit time.
A 61 cm long by 7.62 cm high by 10.8 cm wide heavy wooden block with a total weight of 28.57 kg was used as a toppling block (Figure 1(b)). The block was placed 47 cm above the ground, on a base against the rigid wall, to simulate a single block toppling. Two sensors, S01 and S02, were placed at the side face and front of the toppling block (Figure 1(b)), to compare the data collected by each sensor device and check the consistency of the readings and the data patterns. Figures 1(c) and 1(d) present the orientations of two sensors, along with their locations on the toppling block. The negative z-axis of S01 was placed into the block. If the sensors would be placed on the same flat face of a block, there would be no spatial variability in the gravity acceleration (g x, g y and g z) and angular velocity (ω) readings. However, the initial gravity acceleration readings at all three axes (g x, g y and g z) would depend on the initial inclination of the block face and can be determined based on the initial inclination angle (θ), as illustrated in Figures 1(c) and 1(d). The sensors have a maximum sampling frequency of 100 Hz, and the sampling frequency of 60 Hz was used to adequately capture the toppling movement. It was important to determine the initial orientations of these sensors so that the toppling movement could be determined based on their changes. Furthermore, this study was limited to a single-column topple failure simulation, and the interaction of multiple-column blocks was not investigated.
Experimental procedure
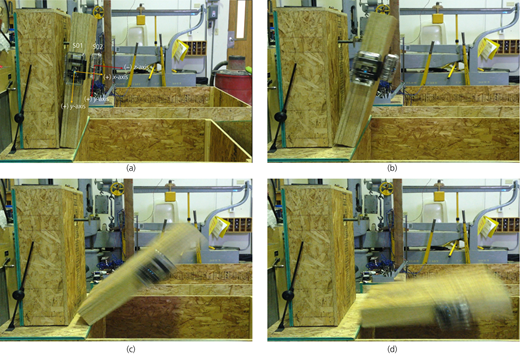
At the beginning of each experiment, the toppling block was placed nearly vertical to the ground (Figure 1(b)) such that the positive y-axis of all the sensors was in the direction of gravity (‘g’), while the x- and z-axes were normal to the gravity. The toppling of the block was triggered by rotating the screw at a constant rate until its center of gravity fell outside the base width. For example, a rate of 30 revolutions/min (rpm; i.e., an equivalent horizontal rate of 1.3 mm/s) was applied on the laboratory experiment 1 (T1). A video was used to document the toppling movement. Figure 2 illustrates the chronological movement behaviour of the toppling block for T1.
Results of laboratory topple experiment 1
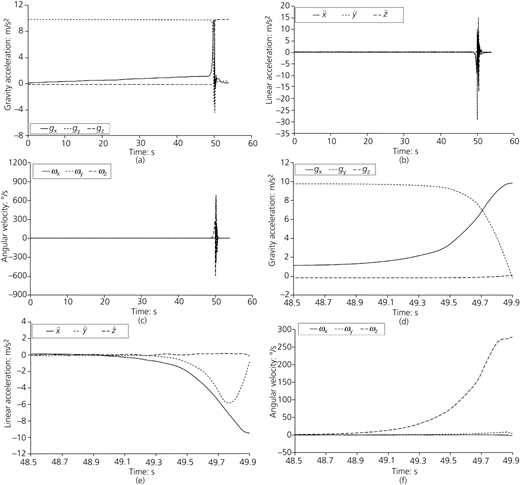
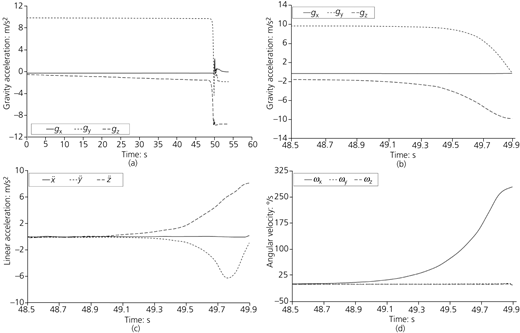
The total duration of T1 was about 50.30 s. During this experiment, the block was pushed forward from 0 to 48.50 s and became unstable to toppling from about 48.50 to 49.90 s. From about 49.90 to 50.30 s, the block fell off the platform and hit the ground. This observation was made based on the video recorded during the experiment and confirmed by the rapid changes in all sensor readings. Prior to toppling, the gravitational acceleration in the x-axis (g x) of sensor S01 and g z of sensor S02 were close to zero and changed gradually toward the gravitational constant (g) of 9.81 m/s2 at 48.50 s (Figure 3(a) and Figure 4(a), respectively). On the other hand, the g y of both sensors decreased from about 9.81 m/s2 to zero magnitude. Figures 3(b) and 3(c) show that the linear accelerations (, ÿ and ) and angular velocities (ω) collected by S01 in all three axes remain about zero from 0 to 48.50 s (i.e., prior to toppling). Although the linear acceleration and angular velocity readings from S02 for the entire experimental duration were not shown in Figure 4, they shared the same observation of near-zero readings. For a better visualisation of the sensor readings during the topple, the data collected by S01 and S02 from 48.50 to 49.90 s are presented in Figures 3(d)–3(f) and Figures 4(b)–4(d), respectively.
The gravity acceleration readings for S01 (Figure 3(d)) show a gradual increase in g x toward the gravitational constant (g) of 9.81 m/s2, a decrease in g y from 9.81 to 0 m/s2, and a nearly constant g z at about 0 m/s2. It can be interpreted from such changes in the gravity acceleration data that the sensor device rotated about the z-axis normal to the gravity with the gradual tilting of the positive x-axis toward ‘g’, while the positive y-axis rotated away from the direction of ‘g’. From 48.50 to 49.74 s, the and ÿ readings gradually increased in the negative axis directions from 0.06 to −6.59 m/s2 and from −0.06 to −5.66 m/s2 (Figure 3(e)), respectively. These readings indicated that the mass continued to accelerate while tilting with the linear motion in the resultant direction of x- and y-axes. The negative and ÿ readings were associated with the reaction of the accelerometer to the inertial force acting on the toppling block (Starlino Electronics, 2009). Thus, while accelerating in the resultant direction of the positive x- and y-axes plane, the sensor readings were negative. On the other hand, the reading parallel to the ground remained close to zero, suggesting no lateral motion in the z-axis during the block topple. After that, ÿ readings began to change from −5.66 to 0 m/s2, while the continued to increase to −9.18 m/s2 at 4.90 s. This change in the direction and decrease in magnitude of ÿ readings were due to the tilting of S01 with the positive y-axis moving further away from ‘g’ (i.e., the direction of motion), contributing a smaller resultant linear acceleration (i.e., nearly equal to or less than 1.00 g). At a 90° tilt, the ÿ reading was nearly zero as the positive x-axis became parallel to the direction of motion, solely recording the acceleration experienced by the toppling block.
The angular velocity readings (ω) in any axis are the measure of the rotational speed of the body about that axis. Hence, when a rock begins to topple, the angular velocity about the axis of rotation increases significantly. In this experimental study, the wooden block toppled fairly about the z-axis of S01, resulting in a significant increase in the angular velocity in the z-axis (ω z) from 0°/s at the beginning of the experiment to 277°/s at 49.90 s (Figure 3(f)). During the same period, the angular velocities in x-axis (ω x) and y-axis (ω y) are close to 0°/s, indicating that there was no rotation of the block about those axes.
The sensor readings collected by S02 that were attached on the front face of the same toppling block were plotted in Figure 4. The objective of using two sensors at different locations of the toppling block was to compare the results and explain the toppling failure behaviour based on those sensor orientations and locations. The gravity acceleration data exhibited gradual change in y- and z-axes as the wooden block rotated forward in the y–z plane such that g y decreased from 9.81 to 0 m/s2 and g z increased from 0 to 9.81 m/s2 in the negative y-axis (Figure 4(b)). The x-axis, being the axis of rotation parallel to the ground, resulted in constant g x readings close to 0 m/s2. The linear acceleration readings exhibited similar behaviour as explained for S01, except that the motion in S02 was along the resultant of positive y-axis and negative z-axis, with the negative z-axis being the major axis in the direction of motion (Figure 4(c)). In other words, the linear acceleration data patterns for S01 and S02 were similar, considering the main motion direction of S01 in the positive x-axis and S02 in the negative z-axis. Since the orientation of y-axis was the same for both sensors, ÿ readings were similar in both magnitudes and directions. Comparing the orientations of S01 and S02, the block rotated about the z-axis of S01 and x-axis of S02 such that there was no linear motion in the direction of those axes. Hence, both readings for S01 and readings for S02 were close to zero. Lastly, the angular velocities about the y- and z-axes remained close to zero as compared to that about the x-axis during the block toppling since the mass rotated about the x-axis (Figure 4(d)). Additionally, the significantly increasing pattern of ω x readings indicated the rapid increase in the angular velocity because of the free forward rotation of the toppling block between 48.50 and 49.90 s.
The comparison of the data patterns and the magnitude of all sensor readings during the same duration between 48.50 and 49.90 s concluded that the S01 readings match very closely with those of S02. Despite the difference in the orientations of S01 and S02, the gravity acceleration readings changed continuously between 0 and 9.81 m/s2 in two of the axes as the mass rotated about the third axis perpendicular to ‘g’. Likewise, a significant increase in the magnitude of the linear accelerations and angular velocities observed in any axes indicated rapid movement with a rotational motion. Thus, it can be confirmed that regardless of the position and orientation of a sensor on a toppling rock, the toppling failure behaviour can be distinctly characterised from the sensor data during a field monitoring.
Comparison of S01 readings from laboratory experiments 1–4
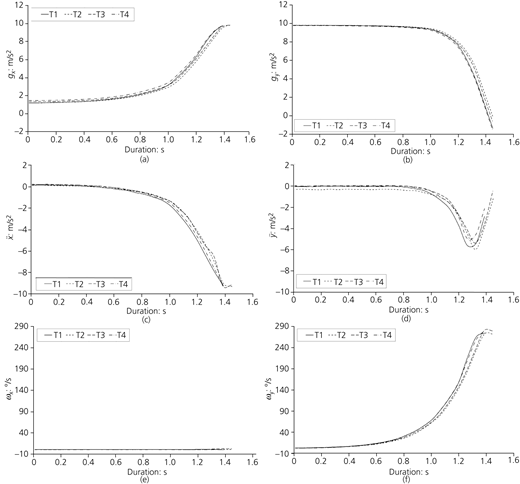
The additional three experiments (T2, T3 and T4) were repeated using the same set-up as illustrated in Figure 1(b). These experiments were conducted using the same sensors S01 and S02 installed at the same respective locations and orientations (Figures 1(c) and 1(d)). The difference among the four experiments was the rate of rotating the screw that pushed the block forward to create toppling failures. While T1 was conducted at a constant rate of 30 rpm (i.e., an equivalent horizontal rate of 1.30 mm/s), T2 was conducted at a constant rate of 15 rpm (i.e., an equivalent horizontal rate of 0.70 mm/s), and T3 and T4 were conducted at a constant rate of 6 rpm (i.e., an equivalent horizontal rate of 0.3 mm/s). Since the linear accelerations and angular velocities in all three axes were near zero (Figures 3(b) and 3(c)) and gravity accelerations were gradually changed (Figure 3(a)) in T1 prior to toppling, this comparison was only conducted based on sensor readings collected during toppling failures. Only the results from S01 were discussed because the results from S02 yielded the same conclusion. To facilitate the comparison, the different data recording times of the four experiments were normalised to their respective equivalent toppling times. The sensor readings collected from S01, except g z, and ω y that were close to zero readings for all four experiments, are presented in Figure 5 with respect to the equivalent toppling time. Figure 5 generally shows the agreement in the gravity accelerations, linear accelerations, and angular velocities in all axes among the four experiments regardless of their different rates of pushing the block to toppling failures.
The g x readings in the toppling direction increased toward 9.81 m/s2 (Figure 5(a)), while the g y readings decreased from about 9.81 m/s2 to zero magnitude (Figure 5(b)) as the block rotated about 90° from a vertical to a horizontal position.
The readings increased toward 9.81 m/s2 (Figure 5(c)). The ÿ readings increased in magnitude, on average, to about 5.50 m/s2 at 1.30 s before decreasing to zero at the end of toppling (Figure 5(d)). These ÿ patterns were attributed to the initial resultant linear acceleration in the x–y plane followed by a final resultant linear acceleration in the x-axis plane as the y-axis moved farther away from the direction of motion or ‘g’.
For the block rotating about the z-axis, the ω x readings remained about zero, while the ω z readings increased significantly, on the average, from 0 to 276°/s at the end of toppling.
Field rock topple experiment
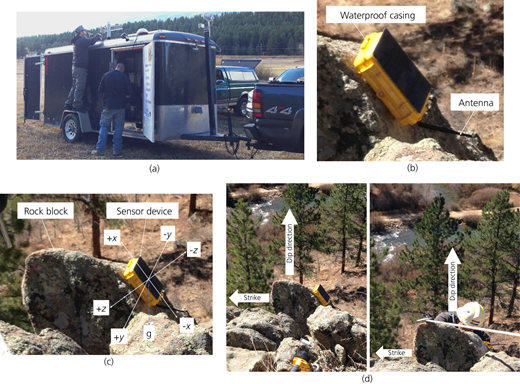
A field rock topple experiment was conducted on a hill slope behind Willow Creek, which is about 150 m north of US Highway 285 in Shawnee, CO, USA. The purpose of the field experiment was to compare the sensor readings during the rock topple with the laboratory results. A trailer, equipped with a computer (base station) for bidirectional communication with the sensors and an antenna for a high-band cellular network to transmit data to the cloud for remote access and storage, was placed at an open field about 120 m away from the test location (Figure 6(a)). A BNO055 IMU sensor enclosed in a yellow waterproof casing was mounted on the side of a rock located at the edge of the slope (Figure 6(b)). A removable antenna was attached to the sensor device projecting out of the casing to enable a long-range communication with the base station (Figure 6(b)). The initial orientation of the sensor with the positive z-axis normal to the sensor box and into the rock block (Figure 6(c)) to allow a comprehensive description of the sensor movement during the rock topple and to compare the results with the laboratory experiment. The potential dip direction of the rock was in the direction of the slope face pointing toward the Willow Creek, and its strike was almost parallel to the back slope face (Figure 6(d)). Although topple was a kinematically viable failure mode, the rock was stable until it was manually pushed from the top-back and out of the slope toward the x–z plane to create a toppling with a forward rotation about its base.
Results of field topple experiment
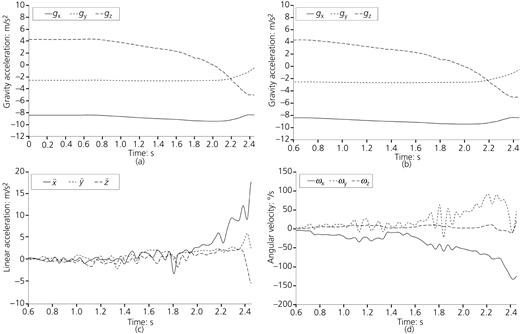
The initial orientation of the sensor attached to a rock was such that the negative x-axis was facing down, making roughly 30° with the gravity, the negative y-axis tilted about 15° below the horizontal line, making nearly 75° with the gravity, and the positive z-axis with 60° with the gravity was facing into the rock face (Figure 7(a)). The gradual increase in the magnitude of g x from −8.41 to −9.45 m/s2 and a significant decrease in g z from +4.33 to 0 m/s2 with constant g y readings of −2.55 m/s2 between 0.6 and 2 s indicated a rock toppling about a resultant direction of x- and y-axes and in the x–z plane (Figure 7(b)). The more significant change in the g z readings was attributed to the rotations of the x-axis slightly toward ‘g’ and of z-axis parallel to the horizontal plane. Thereafter, the rock continued to tilt forward in all three axes, which can be interpreted from the changes in g x, g y and g z readings. The fluctuations in the linear acceleration data in all three axes after 0.60 s indicated undulated motion of the rock in the resultant direction of x-, y- and z-axes (Figure 7(c)). After about 1.80 s, the exponential increase in readings to 17.95 m/s2 and decrease in readings to −5.18 m/s2 suggested a rapid movement of the rock in the x–z direction with the x-axis rotating toward ‘g’ and the z-axis rotating away from ‘g’. Likewise, the increasing patterns of relatively high magnitudes of ω x and ω y and negligibly small ω z (<10°/s) (Figure 7(d)) confirmed the rotational motion of the rock about the resultant direction of x-and y-axes. These results aligned with the laboratory toppling failure described by the increasing angular velocity readings about the axis of forward rotation (i.e., x-axis for S02 in the laboratory experiment).
Rock topple stability analysis
An isolated-block stability analysis was conducted in this study to assess the criterion recommended by Wyllie and Mah (2017) as Equation 1 to estimate the stability of an orthogonal block object prone to toppling. The Δx and y in Equation 1 can be expanded to account for a non-orthogonal block or discontinuity as suggested by Roy and Maheshwari (2017). However, it is important to recognise that this method of analysis cannot describe the mechanics of the toppling. The objective of this analysis is to determine how the sensor gravitational acceleration measurements can be incorporated into the isolated-block analysis method to describe the toppling movement and determine the toppling time. The knowledge gained will provide the foundation for the future development of a more advanced wireless sensor network (WSN) monitoring and early warning system. To evaluate the stability of a rock block using Equation 1, the width (Δx), height (y), and dipping (Ψp) of the rock under study have to be known.
If the above condition given by Equation 1 is satisfied, a rock is considered potentially liable to toppling. The application of the isolated-block stability analysis was based on the following assumptions.
The stability analysis performed on the basis of block shape holds true if the block is isolated and has negligible adhesion between the rock block and the base.
The dipping of the base of the rock equals the tilting of the block with respect to ‘g’ by assuming that the base of the block is nearly perpendicular to its face in contact with the slope.
Although an actual slope may not necessarily satisfy these assumptions, the use of this isolated-block kinematic test to evaluate the stability of a rock block against toppling using the sensor readings provides the first step toward establishing a movement threshold criterion. This criterion is part of the requirements to develop WSN monitoring and an early warning system (Giri et al., 2018a).
The width and height of the wooden block used in the experiments were 10.795 and 76.20 cm, respectively. Gravity acceleration readings can be used to estimate the dipping of the base (Ψp) if the block rotates about an axis that remains perpendicular to the ‘g’, and its corresponding gravity acceleration reading is zero as well as the block tilts in other two axes with respect to ‘g’. For example, an S02 sensor rotated about the x-axis nearly perpendicular to the direction of ‘g’, while gy and gz readings represented the two gravitational components in the two-dimensional rotation plane (Figure 1(d)). After identifying two axes that share the gravity components, the dipping angle of the tilting mass (Ψp) with respect to acceleration due to g ∼9.81 m/s2 was calculated using the simple trigonometric equation (Equation 2).
The angle θ is the tilt angle (Figure 1(d)) and can be calculated using either the gy readings, gz readings over the ‘g’, or a combination of gy and gz for S02 (Equation 2). In theory, the tilt angle calculated using gy and gz should be the same, considering zero gx readings, but it is not usually possible in reality to achieve the perfect perpendicularity of an axis to ‘g’, which results in non-zero readings in that axis. For that reason, some differences in tilt angles calculated using gy and gz, as well as their combined readings, were realised. Using the sensor data from S02, Ψp with respect to the gravity was calculated for each timestamp data using both gy and gz readings as well as the combined accelerations. Next, the stability against toppling at each Ψp value for the known width and height of the wooden block was checked using Equation 1. The potential instability was considered based on the dipping angle calculated either using gy or gz, whichever is first, and the combined accelerations. In this case, the gy data showed the instability first, and the sample of the stability analysis is presented in Table 1. The results of this analysis hinted that the block became unstable and on the verge of toppling at about 31.504 s of the experiment. The observation made from the video showed that the block actually experienced the toppling failure at about 48.50 s. The observed time was determined when the wooden block tiling out of the vertical supporting wall started to freely rotate forward due to gravity and failed in toppling. The discrepancy was attributed to the friction between the block and the base that delayed the toppling time; the block base was not perfectly perpendicular to its face as justified by the differences in the tilt angles based on gy and gz readings and the limitation of the isolated-block stability method in evaluating the kinematic toppling. Other potential causes could be attributed to possible minimal misalignment between the sensors and the axes of the wooden block, the imperfectly right-angled lower corner of the block, leading to a distributed force at the corner, and the weight of the S02 that was light and neglected in this study.
The stability analysis of the toppling block was also performed using the S01 sensor data following the same procedure. Table 2 compares the time of toppling determined using the stability analysis with the observed toppling time for all four experiments. For T1 using the single acceleration, the estimated times of instability of the wooden block were 36.848 s for S01 and 31.504 s for S02, which were about 11.652 s for S01 and 16.996 s for S02 prior to the observed toppling time of 48.50 s. Positive time differences were also determined for T2, T3, and T4. The results implied that the sensor measurements following the isolated-block analysis method could be applied to predict the toppling prior to the observed toppling in terms of times. Similar positive but slightly smaller time differences were observed based on the combined accelerations. However, the significantly small positive time differences ranging from 0.345 to 16.996 s could create challenges in initiating an early warning given sufficient time to protect life from toppling hazards. Furthermore, Table 2 shows that toppling was detected by S02 before S01, except T4, while the estimated times in T2 and T4 from both sensors were similar. Although S02 at the front face of the block and in the direction of toppling (Figure 1) can be more critical than S01 in determining toppling, it cannot be generally concluded for all conditions.
The successful estimation of the topple times prior to the observed times by both sensors supports the idea of incorporating the IMU sensor readings into the isolated-block stability analysis to describe the toppling. However, the positive but relatively small time differences are sensible to the aforementioned factors, such as imperfect block geometry, alignment and installation, which deviate from an ideal and simple condition presented in this study. Hence, the other kinematic criteria (Roy and Maheshwari, 2017) that rely on a fusion of measured data should be evaluated in future studies before the best criterion or a combination of criteria can be recommended for implementation. The aforementioned positive outcomes provide the foundation for future studies to advance WSN monitoring and the early warning system.
Conclusions
Previous studies have shown that the existing slope monitoring technologies are not suitable for detecting a rapid toppling failure and cannot be implemented to differentiate different slope failure modes, especially a topple. These limitations hinder the application of existing stability analysis methods and movement threshold criteria in a real-time slope monitoring. This paper demonstrates, for the first time, how the sensor data patterns and magnitudes from the proposed WSN-IMU system can be applied to identify and describe the toppling failure and how the sensor data can be incorporated into the isolated block analysis method for topple monitoring. Based on laboratory and field topple experiments, the following conclusions are drawn as regards the applicability of the WSN system with IMU sensors for monitoring toppling failures.
Gravity acceleration readings are considered as one of the most useful indicators of the toppling failure. A single block topple can be directly identified if one of the sensor axes is parallel to the axis of rotation and normal to ‘g’. This proposed sensor orientation during a toppling failure will have the gravity acceleration readings in that axis being closer or equal to zero, while the readings in the other two axes of toppling plane will continuously change as the block topples. These changes in the gravity accelerations in those two axes of toppling occur, such that the reading magnitudes increase in the axis moving toward ‘g’, while they decrease in the axis moving away from ‘g’.
Readings also demonstrate a smooth exponential increase in the linear acceleration in the toppling direction. In other cases, when any of the three axes of the sensor device is not aligned with either the toppling direction or axis of rotation, changes in linear accelerations are observed in all the three axes, and the linear accelerations may not be smooth, but may fluctuate due to the discontinuous movement of the toppling block.
Angular velocities exhibit high-magnitude readings in at least one of the axes about which the block topples. Also, the magnitude of the particular angular velocity increases with toppling.
Consistent and unique sensor reading patterns are observed from four laboratory experiments. The repeatability of the sensor readings and patterns supports the application of WSN-IMU sensors in characterising a potential block toppling failure.
The approach of incorporating sensor readings into the isolated-block stability analysis provides the opportunity to improve the monitoring of toppling failure. Toppling times are determined prior to the observed toppling times in all four laboratory experiments. However, these positive and relatively small time differences observed in ideal and simple topple experiments are sensible to factors that create the discrepancy.
Using the knowledge gained from this study, future research can be conducted to include other factors influencing the toppling failure and sensor readings. The other factors include multiple column blocks and their interactions, base and block surface roughness, noises and other trigger mechanisms. Furthermore, additional real-time field monitoring of actual slopes should be considered in future studies to assess the performance of the proposed WSN-IMU system and the failure criteria on topple monitoring and early warning system while accounting for environmental and external effects such as rain, snow, wind, traffic and vegetation movement.
Acknowledgements
The authors would like to thank the University of Wyoming Tier-I Engineering Initiative for funding this research and are grateful to Marian Phillips from Silent Solutions Security.