


This paper investigates the physico-mechanical and petrographic attributes of the Palaeocene Lockhart Limestone, which were measured, sampled and described from the Rumli and Shah Allah Ditta sections of Islamabad, Pakistan. Petrographic analysis shows that the limestone is categorised mainly into mudstone and wackestone microfacies and the dominant presence of the micrite matrix favours the strength of the rock, whereas veins, microfractures and porosities adversely affect the stability of the rock. Unconfined compressive strength (UCS) and point load test (PLT) analyses show that the limestone samples that have the lowest porosities partnered with bioclasts present the highest UCS and PLT values, and the higher porosities partnered with bioclasts correspond to the lowest values of UCS and PLT. The physico-mechanical analyses reveal that the limestone aggregates are within the limits of the respective standards for utilisation in wearing, coating and cement concrete. The limestone of both sections can be utilised for geotechnical purposes such as crushed material and aggregate sources. Simple regression analysis was employed, and based on these correlations, the limestone of the studied formation is designated as moderately strong and recommended for road or bridge construction.
Notation
Introduction
Sedimentary rocks constitute a major portion of the Potwar basin of Pakistan. Specifically, the Palaeocene and Eocene successions of the Potwar basin are of utmost significance in terms of geotechnical use and hydrocarbon exploration (Hussain et al., 2021). The wider use of limestone in the geotechnical field and its major uses in crushed rock aggregates in the construction industry are dependent mainly on its physical and mechanical properties. In the fields of geotechnical and rock engineering, the most employed rock classification systems are based on mechanical parameters such as uniaxial compressive strength, Young’s modulus (E), tensile strength and Poisson’s ratio (v). However, it is the mineral constituents that determine whether a specific rock is suitable or not as construction material.
Physical properties coupled with the mechanical behaviour of rocks are influenced by the modal mineral composition, cement, grain size and grain contact (Meng and Pan, 2007). Moreover, the physical and petrographic characteristics of sedimentary rocks have significant influence on their mechanical properties (Mosch and Siegesmund, 2007; Sabatakakis et al., 2008; Tandon and Gupta, 2013; Wang et al., 2019). Numerous studies have been documented to propose the relationship of sedimentary rocks (Douma et al., 2017; Li et al., 2014; Shalabi et al., 2007; Wang et al., 2019).
Previously, several studies have determined that petrographic characteristics have an intrinsic effect on the strength of rocks (Gupta and Sharma, 2012; Zorlu et al., 2008). A number of studies have proposed the effects of petrographic features on the rock stability and some have established the relationship between the mineralogical composition and mechanical properties of the rocks (e.g. Dincer et al., 2008; Kilic and Teymen, 2008; Liu et al., 2005; Meng and Pan, 2007). Zorlu et al. (2008) and Gupta and Sharma (2012) have documented that the petrographic characteristics have an intrinsic effect on the strength of rocks. Several research studies on aggregate and limestone that have been undertaken in Pakistan have investigated the mechanical properties, made an engineering assessment and/or carried out aggregate investigations and have proposed their use in construction (e.g. Akram et al., 2017; Kamran et al., 2021; Majeed and Abu Bakar, 2016; Mustafa et al., 2016; Naeem et al., 2014a, 2014b; Naseem et al., 2016; Rehman et al., 2020; Ullah et al., 2020).
The study of Naeem et al. (2014b) on the Lockhart Limestone in the Rumli area highlighted its mechanical and petrographic characteristics, yet it still lacked a comparison of this formation with others from other locations in Islamabad for aggregate and other construction uses. Moreover, systematic studies on the Lockhart Limestone in easily accessible areas such as the current study area of Pakistan (Figure 1) are so rare as to be almost non-existent. The aim of this study is to elucidate the relationships between the petrographic and mechanical parameters of the Lockhart Limestone based on the comprehensive analysis of influencing factors affecting mechanical properties. Moreover, the correlation of the physical properties with the mechanical behaviours of limestone is significant to determine the physical properties. Results of this study can provide a direction and guidelines to understand the mechanical behaviour of Palaeocene Lockhart Limestone and its subsequent excavation and usage in indigenous geotechnical and construction industries.
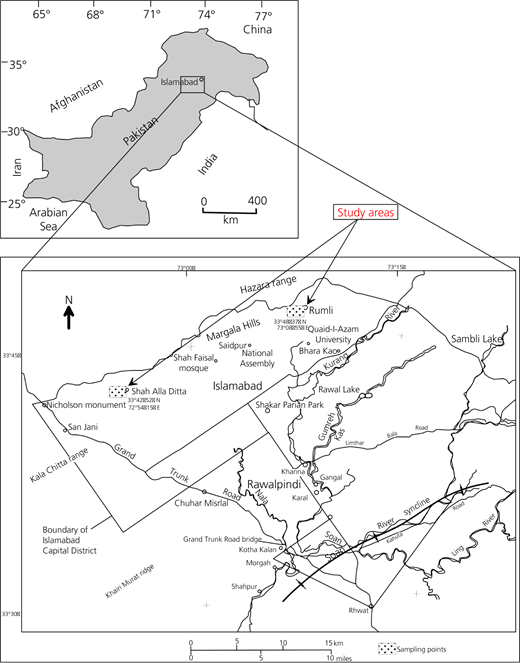
Location map of Islamabad and adjacent areas, including the study areas (shown by arrows)
Location map of Islamabad and adjacent areas, including the study areas (shown by arrows)
Materials and methods
The Rumli (RUM) and Shah Alla Ditta (SAD) sections of the Lockhart Limestone were investigated through detailed geological field and laboratory mechanical and petrographic studies. They are located within the geographic coordinates of 33°46′12″ north and 73°8′6″ east and 33°42′45″ north, 72°55′3″ east, respectively. Cores of 30 mm diameter from 15 block samples were drilled from all the limestones for determination of physio-mechanical properties. The volume of the block samples was around 0.9 cubic feet (0.0255 m3). The remaining samples were crushed into smaller pieces and subjected to various tests – for instance, water absorption (Wa), specific gravity, total and effective porosity (nt and ne), aggregate impact value, flakiness index (IF), elongation index (IE) and Los Angeles abrasion value (LAA) tests – in accordance with standard specifications (ASTM, 2003, 2004; BSI, 1985, 1990a, 1990b). For petrography studies, 15 thin sections of around 30 μm thickness were prepared. Conventional petrography was carried out using the method and chart of Scholle and Ulmer-Scholle (2003) and Hussain et al., (2021), and mineral contents were estimated by using the grain-counting technique. The collected samples were crushed to aggregate and made into cubic forms by systematic cutting to analyse the physical and mechanical properties of limestone from the studied sections. Laboratory work encompassed several tests conducted based on standards set by the American Association of State Highway and Transportation Officials (Aashto, 2008) and BSI (1990a, 1990b). The conducted tests included point load tests (PLTs), universal compressive test, water absorption tests, specific gravity tests, Los Angeles abrasion tests (Aashto, 2002), and flakiness and elongation tests and petrographic analysis (ASTM, 1998). PLTs were carried out following the method suggested by the International Society of Rock Mechanics (ISRM, 1985), and for unconfined compressive strength (UCS) tests, core samples were extracted from bulk samples by using a core drilling machine.
Petrographic analysis
In the petrographic study, thin sections were examined under a Nikon Eclipse polarised microscope to assess the mineral characteristics, bioclast content or allochems of the Lockhart Limestone (Figure 2). For the determination of the porosity in the studied samples, the classification by Choquette and Pray (1970) was employed. Some of the terms of porosities used in the classification are ‘intra-particle’ (existing within original skeletal grains), ‘inter-particle’ (existing between grains) and ‘inter-crystal’ (existing within grains usually micrite, sparite or dolomite). The classifications by Dunham (1962) and Embry and Klovan (1971) were employed for the textural classification of carbonate rock (Table 1). The classification by Dunham (1962) of limestone or carbonates is based on three textural characteristics: (a) the binding of original components during deposition, which differentiates boundstone from fine-grained carbonate rocks; (b) the presence of the type of orthochem, which is the cement (sparry calcite) in carbonate rocks, which set apart grainstone from muddy carbonates; and (c) grain abundance in muddy carbonates, which subdivides them into mudstone, wackestone and packstone (Table 1). The modified version of Dunham’s classification of coarse-grained carbonate rocks was introduced by Embry and Klovan (1971) by naming coarse-grained wackestone (grain size is more than 2 mm) as floatstone and coarse-grained grainstone as rudstone. Boundstone is further classified into the three subdivisions of framestone, bindstone and bafflestone on the basis of depositional fabric (Table 1). Based on Table 1, carbonates are categorised into two main classes – namely, allochthonous and autochthonous carbonates, which differ from each other through the original components, which are not organically bound together during deposition or originally bound together during deposition, respectively. In this study, mudstone, wackestone and packstone are the autochthonous carbonates and the grains in these microfacies are considered as coarse grains, for the ease of plotting in the regression analysis.
Classification of carbonate rock by Dunham (1962) with modifications by Embry and Klovan (1971)
| Autochthonous limestonesa | Autochthonous or allochthonous | Allochthonous limestonesb | ||||||
|---|---|---|---|---|---|---|---|---|
| Boundstone | >10% >2 mm components | No mud | Has mud | Mud supported | ||||
| Organisms build a rigid framework | Organisms encrust and bind | Organisms act as baffle | Grain supported | Matrix supported | Grain supported | >10% grains | <10% grains | |
| Framestone | Bindstone | Bafflestone | Rudstone | Floatstone | Grainstone | Packstone | Wackestone | Mudstone |
Original components bound together
Original components not bound together, less than 10% >2 mm components
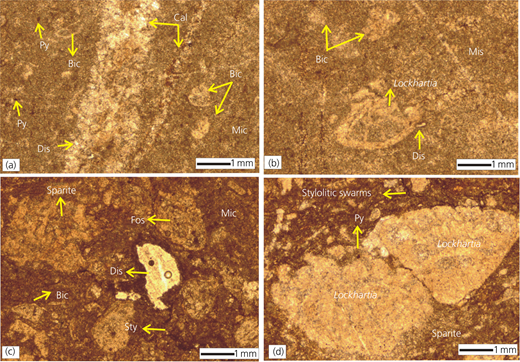
Representative micrographs of the identified microfacies of the Lockhart Limestone through petrography at RUM. (a, b) Micrographs of the mudstone microfacies. The micrograph in (a) has allochems of bioclasts (Bic), calcite veins (Cal), micrite orthochem (Mic), pyrite (Py) and dissolution (Dis). The micrograph in (b) has bioclasts (Bic), microsparite (Mis), dissolution (Dis) and Lockhartia fossil. (c, d) Micrographs of Lockhartia-rich wackestone microfacies with orthochems of micrite (Mic), sparite, allochems of bioclast (Bic) and fossil (Fos), with diagenetic fabrics of dissolution (Dis) and stylolitisation (Sty), stylolite swarm and fossil Lockhartia partnered with pyrite precipitation (Py)
Representative micrographs of the identified microfacies of the Lockhart Limestone through petrography at RUM. (a, b) Micrographs of the mudstone microfacies. The micrograph in (a) has allochems of bioclasts (Bic), calcite veins (Cal), micrite orthochem (Mic), pyrite (Py) and dissolution (Dis). The micrograph in (b) has bioclasts (Bic), microsparite (Mis), dissolution (Dis) and Lockhartia fossil. (c, d) Micrographs of Lockhartia-rich wackestone microfacies with orthochems of micrite (Mic), sparite, allochems of bioclast (Bic) and fossil (Fos), with diagenetic fabrics of dissolution (Dis) and stylolitisation (Sty), stylolite swarm and fossil Lockhartia partnered with pyrite precipitation (Py)
Physical and mechanical properties
The collected block samples of the Lockhart Limestone were investigated for determining physical and mechanical properties, and the core samples were subjected to UCS, PLT and shear strength analyses. PLT was performed based on the suggested method of ISRM (1985). Statistical analysis was carried out using Excel data analysis tools. In this way, column charts were prepared, displaying the mean physical and mechanical properties of each sample. Similarly, simple and multiple linear regression analyses were performed to develop equations for elucidating strength and Young’s modulus, according to the variables representing the highest correlation coefficients for them. Physical properties, such as dry and saturated unit weights, were determined. The porosity and unit weight were analysed based on the ASTM D 2216-05 method (ASTM, 2005). The mechanical properties of the Lockhart Limestone, which include uniaxial compressive strength and Young’s modulus, were measured using oven-dried samples. UCS was analysed based on the ASTM D 2938-95 method (ASTM, 1995). The tangent Young’s modulus, the slope of the stress–strain curve at the point of 50% ultimate load, was measured according to the ASTM D 3148-93 method (ASTM, 1993). Thin sections from all bulk samples were prepared for petrographic studies. Furthermore, the specific gravity and water absorption of these aggregate samples were determined in the Geochemistry Laboratory, National Centre of Excellence, Geology University of Peshawar. LAA, flakiness and elongation tests were performed on aggregates to determine the abrasion resistance and impact of shape caused by aggregate fragments, and the results were compared with the standards ASTM D 4791-10 (ASTM, 2010) and Aashto T 96 (Aashto, 2002). The results of the conducted tests were correlated based on standards of the Aashto (2008) and BSI (1990a).
Petrographic characteristics of the Lockhart Limestone
The petrographic study of the studied RUM and SAD sections of the Lockhart Limestone revealed that the limestone of the formation can be classified as mudstone and wackestone. They comprise about less than 15% allochems (bioclasts, both skeletal and non-skeletal) such as foraminifera and shallow faunal assemblages and above 82% orthochems, mainly micrite and minor microsparite to very rare sparite (Table 2 and Figures 2 and 3).
Lockhart limestone classification, mineralogical composition and porosity based on Dunham classification (1962) at RUM
| Sample | Rock name | Calcite: % | Bioclasts: % | Haematite: % | Limonite: % | Pyrite: % | Porosity: % |
|---|---|---|---|---|---|---|---|
| R1 | Mudstone | 89 | 9 | 0.3 | 0.3 | 0.1 | 1.2 |
| R2 | Mudstone | 88 | 11 | 0.0 | 0.0 | 0.0 | 1.0 |
| R3 | Mudstone | 86 | 13 | 0.3 | 0.2 | 0.1 | 0.4 |
| R4 | Wackestone | 82 | 17 | 0.3 | 0.2 | 0.1 | 0.4 |
| R5 | Mudstone | 86 | 13 | 0.1 | 0.1 | 0.0 | 0.8 |
Average bioclasts 12%, average calcite 86%, average porosity 0.76%
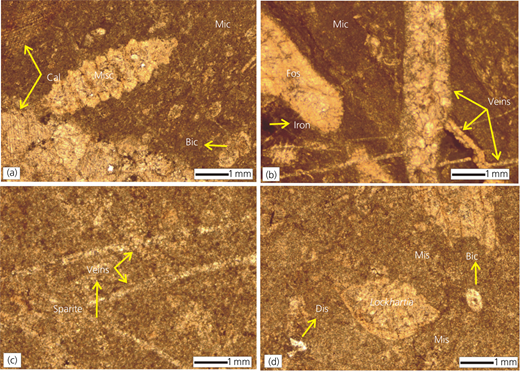
Representative micrographs of the identified microfacies of the Lockhart Limestone through petrography at SAD. (a, b) Micrographs representing wackestone microfacies of the Lockhart Limestone at SAD. Panel (a) has micrite (Mic), bioclast (Bic), calcite (Cal) and shallow fauna of echinoids and rare Miscellanea species (Misc); panel (b) has micrite (Mic), iron, veins and a bioclast of Miscellanea fossil (Fos). (c, d) Micrographs representing mudstone microfacies at SAD with orthochems of sparite, microsparite (Mis), allochems of bioclasts (Bic), Lockhartia and diagenetic imprints of veins and dissolution (Dis)
Representative micrographs of the identified microfacies of the Lockhart Limestone through petrography at SAD. (a, b) Micrographs representing wackestone microfacies of the Lockhart Limestone at SAD. Panel (a) has micrite (Mic), bioclast (Bic), calcite (Cal) and shallow fauna of echinoids and rare Miscellanea species (Misc); panel (b) has micrite (Mic), iron, veins and a bioclast of Miscellanea fossil (Fos). (c, d) Micrographs representing mudstone microfacies at SAD with orthochems of sparite, microsparite (Mis), allochems of bioclasts (Bic), Lockhartia and diagenetic imprints of veins and dissolution (Dis)
The average calcite and bioclast contents of the Lockhart Limestone in RUM are 86 and 12%, respectively (Table 2). Calcite is the major mineral constituent, followed by pyrite and very rare to non-existent haematite and limonite. Pyrite is a minor component in limestone composition of about <1.4% (Table 2). The range of calcite in the limestone is about 85–90%, whereas the bioclast content ranges from 9.3 to 17% (Table 2). Similarly, the mean calcite content of the Lockhart Limestone at SAD is 87%, while the mean bioclast content is 12% with less than 1% hematite, limonite and pyrite. The calcite content ranges from 92 to 93%, whereas the biotite content varies within the range 8.6–13% (Table 2).
The major components in the form of calcite (micrite) and bioclasts have a greater effect on the overall strength of the rock. The samples from RUM have greater porosity comparatively than those from SAD (Table 2).
Results
The Lockhart Limestone was studied for petrographic and physio-mechanical assessment in the RUM and SAD sections. Petrography reveals that micrite or calcite make up the dominant part of allochems followed by bioclasts, representing 88% calcite and 13% bioclasts in the RUM section and an average of 86% calcite and 12% bioclasts in the SAD section (Table 3). The limestone samples collected from the RUM section have a lower strength comparatively; they have a lower calcite content of 86%, around 13% bioclasts and 0.77% porosity on average (Table 2 and Figure 4). On the other hand, among the SAD limestone samples, SD2 possesses the best rock stability parameters: as 89% calcite, 10% bioclasts and 0.4% porosity (Table 3). The average bioclast or allochem value in overall samples of RUM remains 13% with a range between 9 and 17% in R1 and R4 samples, respectively (Table 3). In the limestone samples of SAD, the lowest and highest bioclast values are 10 and 14% for the SD2 and SD1 samples, respectively, with an average bioclast value of 12% in overall limestone samples (Table 3).
Lockhart Limestone classification, mineralogical composition and porosity based on Dunham classification (1962) at SAD
| Sample | Rock name | Calcite: % | Bioclasts: % | Haematite: % | Limonite: % | Pyrite: % | Porosity: % |
|---|---|---|---|---|---|---|---|
| SD1 | Wackestone | 85 | 14 | 0.1 | 0.0 | 0.1 | 0.8 |
| SD2 | Mudstone | 89 | 10 | 0.3 | 0.2 | 0.1 | 0.4 |
| SD3 | Mudstone | 88 | 11 | 0.1 | 0.1 | 0.0 | 0.8 |
| SD4 | Mudstone | 87 | 12 | 0.0 | 0.2 | 0.0 | 0.8 |
| SD5 | Mudstone | 86 | 13 | 0.3 | 0.2 | 0.1 | 0.4 |
Average bioclast 12%, average calcite 87%, average porosity 0.64%
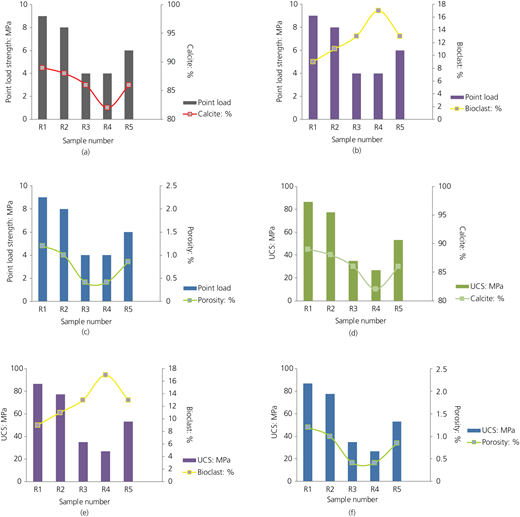
The bar graphs show that the Rumli limestone samples (R1–R5) have average values of: (a) calcite content as 86%, with PLT strength as 6.2 MPa; (b) bioclasts as 13%, with PLT strength as 6.2 MPa; (c) porosity as 0.77%, with PLT strength as 6.2 MPa; (d) calcite content as 86%, with UCS as 56 MPa; (e) bioclasts as 13%, with UCS as 56 MPa; and (f) porosity as 0.77%, with UCS as 56 MPa
The bar graphs show that the Rumli limestone samples (R1–R5) have average values of: (a) calcite content as 86%, with PLT strength as 6.2 MPa; (b) bioclasts as 13%, with PLT strength as 6.2 MPa; (c) porosity as 0.77%, with PLT strength as 6.2 MPa; (d) calcite content as 86%, with UCS as 56 MPa; (e) bioclasts as 13%, with UCS as 56 MPa; and (f) porosity as 0.77%, with UCS as 56 MPa
The UCS values of Lockhart Limestone vary between 27 and 87 MPa, with an average of 56 MPa in RUM samples (Table 4). In SAD limestone samples, the UCS values vary between 21 and 100 MPa, with an average of 65 MPa (Table 4). The highest UCS values of 100 MPa in the SAD section and 87 MPa in the RUM section correspond to maximum calcite percentages of 90 and 89%, respectively, whereas the minimum values of 21 MPa in the SAD section and 27 MPa in the RUM section correspond to a minimum calcite content of approximately 85% (Figures 5 and 6).
Details of UCS and PLT calculated from limestone samples from the RUM section (R1–R5) and SAD section (SD1–SD5)
| Sample | Area: in.2 | Load: N/m2 | Strength: MPa | Point load strength index: MPa |
|---|---|---|---|---|
| R1 | 24 | 5 413 198.4 | 86.61 | 9 |
| R2 | 24 | 4 834 517.6 | 77.35 | 8 |
| R3 | 24 | 2 182 621.6 | 34.92 | 4 |
| R4 | 24 | 1 664 222.0 | 26.63 | 4 |
| R5 | 24 | 3 314 654.5 | 53.03 | 6 |
| SD1 | 24 | 1 325 756.4 | 21.21 | 2 |
| SD2 | 24 | 6 252 778.7 | 100.04 | 7 |
| SD3 | 24 | 4 808 758.03 | 76.94 | 5 |
| SD4 | 24 | 4 445 298.98 | 71.12 | 7 |
| SD5 | 24 | 3 580 294.2 | 57.28 | 4 |
1 in.2 = 1 square inch = 645.2 mm2
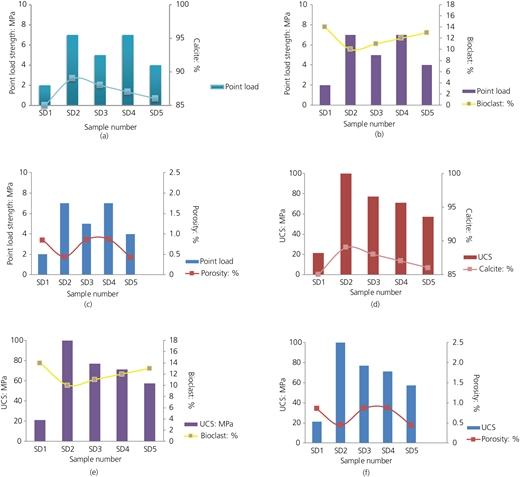
The bar graphs show that the Shah Allah Ditta limestone samples (SD1–SD5) have average values of: (a) calcite content as 87%, with PLT strength as 5.0 MPa; (b) bioclasts as 13%, with PLT strength as 5.0 MPa; (c) porosity as 0.64%, with PLT strength as 5.0 MPa; (d) calcite content as 87%, with UCS as 65.3 MPa; (e) bioclasts as 12%, with UCS as 65.3 MPa; and (f) porosity as 0.64%, with UCS as 65.3 MPa
The bar graphs show that the Shah Allah Ditta limestone samples (SD1–SD5) have average values of: (a) calcite content as 87%, with PLT strength as 5.0 MPa; (b) bioclasts as 13%, with PLT strength as 5.0 MPa; (c) porosity as 0.64%, with PLT strength as 5.0 MPa; (d) calcite content as 87%, with UCS as 65.3 MPa; (e) bioclasts as 12%, with UCS as 65.3 MPa; and (f) porosity as 0.64%, with UCS as 65.3 MPa
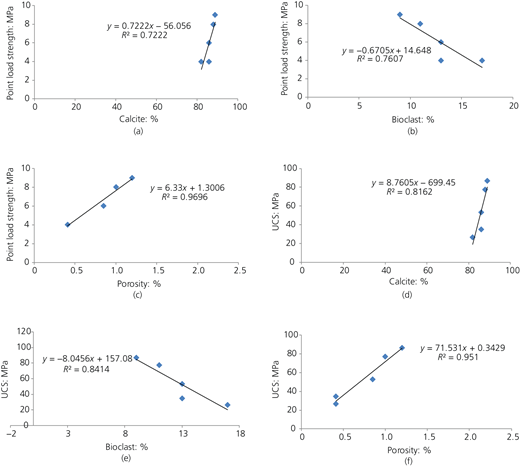
The RUM regression analysis, indicating (a) a positive correlation between PLT and calcite content (R2 = 0.72); (b) a negative correlation between PLT and bioclasts (R2 = 0.76); (c) a negative correlation between PLT and porosity (R2 = 0.96); (d) a positive correlation between UCS and calcite content (R2 = 0.81); (e) a negative correlation between UCS and bioclasts (R2 = 0.84); and (f) a negative correlation between UCS and porosity (R2 = 0.95)
The RUM regression analysis, indicating (a) a positive correlation between PLT and calcite content (R2 = 0.72); (b) a negative correlation between PLT and bioclasts (R2 = 0.76); (c) a negative correlation between PLT and porosity (R2 = 0.96); (d) a positive correlation between UCS and calcite content (R2 = 0.81); (e) a negative correlation between UCS and bioclasts (R2 = 0.84); and (f) a negative correlation between UCS and porosity (R2 = 0.95)
The PLT values in RUM range from 4 to 9 MPa with an average of 6.2 MPa, whereas these values range from 2 to 7 MPa in SAD with an average of 5 MPa (Table 4 and Figures 5 and 6). The limestone samples of RUM have values of porosity ranging from 0.41 to 1.2% with an average of 0.77%. The values of porosity in SAD range from 0.43 to 0.8% with an average of 0.64% (Table 4 and Figure 5). The relatively higher porosity in the former may be related to its higher bioclast or allochemical contents.
Specific gravity has a direct relationship to the strength of aggregate (Kahraman et al., 2005). Rocks with a specific gravity value greater than or equal to 2.55 are classified as good construction material, which can be used as aggregate (Blyth and De Freitas, 1974). Moreover, the minimum requirement for cement concrete is 2.60 (Naeem et al., 2014a).
Water absorption (Wa) is a direct indicator of permeability. The water absorption values are 0.99 and 0.76% in SAD and RUM samples, respectively (Table 5). The abrasion value indicates the toughness of the aggregate under natural and stressed conditions (Neville, 2012). The LAA test is performed using specially graded mixed-size aggregate (4.75 and 9.5 mm). The following specified formula for LAA is used:
where WT is the total weight and WR is the weight retained.
Calculated limestone values for specific gravity and water absorption in both sections
| Sample name | Saturated surface dry weight: g | Weight in water: g | Oven dry weight: g | Sample absorption: % | Aggregate absorption: % | Apparent specific gravity | Bulk oven dry specific gravity | SSD specific gravity |
|---|---|---|---|---|---|---|---|---|
| Shah Alla Dita | 1125 | 704 | 1114 | 11 | 0.99 | 2.717 | 2.646 | 2.672 |
| Rumli | 1199 | 751 | 1190 | 9 | 0.76 | 2.711 | 2.656 | 2.676 |
SSD, saturated surface dry
The LAA percentage values of Lockhart Limestone are 22.2 and 17.0% in RUM and in SAD, respectively (Table 6).
LAAs of the SAD and RUM sections
| Pass through sieve number 1: mm | Retained on sieve number 2: mm | Weight: g Class A |
|---|---|---|
| SAD samplesa | ||
| 37.5 | 25 | 1250 |
| 25 | 19 | 1250 |
| 19 | 12.5 | 1250 |
| 12.5 | 9.5 | |
| 9.5 | 6.3 | |
| 6.3 | 4.75 | |
| 4.75 | 2.36 | |
| Total | 5000 | |
| RUM samplesb | ||
| 37.5 | 25 | 1250 |
| 25 | 19 | 1250 |
| 19 | 12.5 | 1250 |
| 12.5 | 9.5 | |
| 9.5 | 6.3 | |
| 6.3 | 4.75 | |
| 4.75 | 2.36 | |
| Total | 5000 | |
Percentage loss = 5000 − 4150/5000 × 100 = 17%
Percentage loss = 5000 − 3890/5000 × 100 = 22.2%
The shape of particles in coarse material influences the engineering properties of aggregate in construction by affecting material placement and consolidation. The specifications state that the measured value shall not exceed 10%. In the present study, the thin and elongated particle index ranges from 1.1 to 2.0% for SAD samples and 0.8 to 3.4% for RUM section (Tables 7 and 8). Likewise, the cumulative elongated and flaky index values are 1.6 and 3.1% for SAD and RUM sections, respectively, which fall within the safe range of 35–40%, as per specifications of the British standard BS 812-105.2:1990 (BSI, 1990a) for road construction.
Aggregate flakiness and elongation test on SAD samples
| Size of aggregates: in. | Original gradation(A) | Weight of test fraction: g(B) | Weight of thin and elongated particles: g(C) | Thin and elongated particles: %(D)D = C/B × 100 | Corrected average weight: %(E)E = D × A%/100 | |
|---|---|---|---|---|---|---|
| Passing through sieve | Retained on sieve | |||||
| 0.500 | 1.000 | 25.0 | 3000.0 | 37 | 1.2 | 0.3 |
| 1.000 | 0.750 | 18.0 | 2000.0 | 27 | 1.4 | 0.2 |
| 0.750 | 0.500 | 23.0 | 1500.0 | 16 | 1.1 | 0.2 |
| 0.500 | 0.375 | 21.0 | 1000.0 | 27 | 2.7 | 0.6 |
| 0.375 | 0.750 | 13.0 | 500.0 | 10 | 2.0 | 0.3 |
| Total | 100.0 | 1.6 | ||||
1 in. = 1 inch = 25.4 mm
Aggregate flakiness and elongation test on RUM samples
| Size of aggregates: in. | Original gradation(A) | Weight of test fraction: g(B) | Weight of elongated particles: g(C) | Thin and elongated particles: %(D)D = C/B × 100 | Corrected average weight: %EE = D × A%/100 | |
|---|---|---|---|---|---|---|
| Passing through sieve | Retained on sieve | |||||
| 0.500 | 1.000 | 21.0 | 3000.0 | 24 | 0.8 | 0.2 |
| 1.000 | 0.750 | 23.0 | 2000.0 | 48 | 2.4 | 0.6 |
| 0.750 | 0.500 | 25.0 | 1500.0 | 30 | 2.0 | 0.5 |
| 0.500 | 0.375 | 19.0 | 1000.0 | 75 | 7.5 | 1.4 |
| 0.375 | 0.250 | 12.0 | 500.0 | 17 | 3.4 | 0.4 |
| Total | 100.0 | 3.1 | ||||
1 in. = 1 inch = 25.4 mm
Multiple linear regression models are constructed for the prediction of the mechanical behaviour of these rocks. The regression coefficient (R2) value was determined by regression evaluation of mechanical properties such as UCS and PLT with calcite, bioclasts and porosity of suggested limestone samples (Figures 6 and 7).
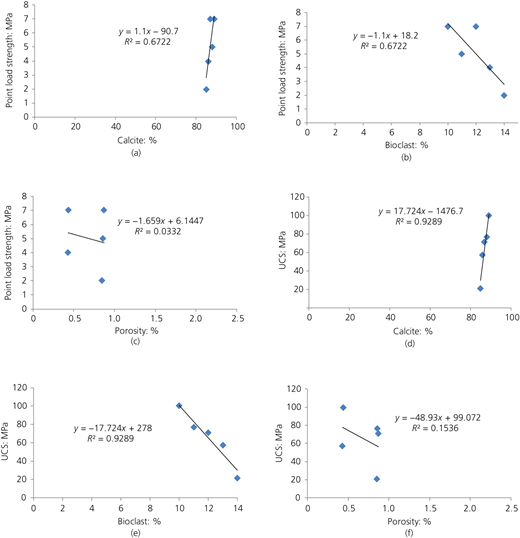
The SAD regression analysis, indicating: (a) a positive correlation between PLT and calcite content (R2 = 0.67); (b) a negative correlation between PLT and bioclasts (R2 = 0.672); (c) a negative correlation between PLT and porosity (R2 = 0.33); (d) a positive correlation between UCS and calcite content (R2 = 0.92); (e) a negative correlation between UCS and bioclasts (R2 = 0.92); and (f) a negative correlation between UCS and porosity (R2 = 0.15)
The SAD regression analysis, indicating: (a) a positive correlation between PLT and calcite content (R2 = 0.67); (b) a negative correlation between PLT and bioclasts (R2 = 0.672); (c) a negative correlation between PLT and porosity (R2 = 0.33); (d) a positive correlation between UCS and calcite content (R2 = 0.92); (e) a negative correlation between UCS and bioclasts (R2 = 0.92); and (f) a negative correlation between UCS and porosity (R2 = 0.15)
The relationships of UCS and PLT with porosity and bioclast content suggest that they have a negative impact on the overall strength of the rock, whereas a positive correlation is seen between PLT and calcite and between UCS and calcite (R2 = 0.72 and R2 = 0.81, respectively; Figure 6). The positive regression correlations of the RUM samples are represented as follows:
However, there is a significant negative correlation for RUM samples between PLT and bioclasts and between UCS and bioclasts (R2 = 0.76 and R2 = 0.841, respectively, Figure 6) and, similarly, a negative correlation between PLT and porosity and between UCS and porosity (R2 = 0.969 and R2 = 0.951, respectively; Figure 6). The relationships of UCS and PLT with bioclasts of the Lockhart Limestone at RUM samples are as follows:
Similarly, there is a negative correlation for SAD samples between PLT and bioclasts and between UCS and bioclasts (R2 = 0.67 and R2 = 0.928, respectively, Figure 7) and between PLT and porosity and between UCS and porosity (R2 = 0.033 and R2 = 0.153, respectively; Figure 7). The relationships of UCS and PLT with bioclasts are given by
On the other hand, a positive regression correlation prevails for SAD samples between PLT and calcite and between UCS and calcite (R2 = 0.67 and R2 = 0.928, respectively; Figure 7). The relationships of UCS and PLT with calcite are determined through the following formula:
Discussion and implications
According to the analysis conducted in this research, the calcite percentage increases the overall strength of the rock, while porosity and bioclast percentages deteriorate mechanical properties by decreasing the UCS and PLT values of the limestone. The samples of RUM have greater porosity comparatively than those of SAD, which reflects that the limestone of the SAD section has good mechanical attributes. In other words, higher porosity prevails as the main contributory factor imparting relatively lower strength (UCS) in the samples of RUM than the samples of SAD. Limestone samples with the lowest porosities have the highest UCS values, and samples bearing the highest porosity (1 and 1.2%) have the lowest UCS values (77.3 and 86.1 MPa) (Table 4 and Figure 6). This gives clear evidence that the higher the porosity and bioclast content, the lower the strength and stability (UCS and PLT) of the limestone sample would be, whereas a greater abundance of calcite or micrite leads to an increase in the stability and strength of the rock. This is also verified through the limestone samples of the SAD section which have a higher abundance of micrite than the RUM limestone. Calcite contents in the limestone samples of both sections are comparable, but bioclast contents are relatively higher in the RUM section as compared with those in the SAD section, resulting in relatively weak mechanical properties (UCS). Besides veins, microfractures, bioclasts and porosities, the mineralogy of the Lockhart Limestone lacks any known or specific and higher concentration of deleterious minerals, making the studied rock unit favourable for construction and as an aggregate source for roads and bridges.
The PLT data revealed that an increase in calcite content causes an increase in strength values, while an increase in bioclast content decreases PLT values, depicting an inverse relationship. Although limestone samples have very low porosity, they do have negative impacts on the mechanical properties (UCS) of a rock. The PLT values of the studied samples of limestone from the two localities fall within the range of high to very high. The UCS and PLT analyses indicate that the samples of the Lockhart Limestone from the two localities of RUM and SAD break along fracture lines, and the majority of these limestone samples are very strong, except sample SD1 (a sample of SAD), whose alternative behaviour was due to macroscopic fracture.
In the present study, the calculated apparent specific gravity values are 2.717 and 2.711 for limestone samples of SAD and RUM, respectively (Table 5), indicating that the values of specific gravity of these rocks are within the limits of ASTM 127-04 (ASTM, 2004) and ASTM 131-03 (ASTM, 2003), as the specific gravity of aggregates normally used in construction ranges from about 2.5 to 3.0 with an average value of about 2.68. Hence, the samples from the Lockhart Limestone are suitable for heavy construction projects such as roads, railway and buildings. They can also be used in cement concrete and asphalt mixes, as the specified limit for these is 2.7. The average value of specific gravity in the studied samples shows that the Lockhart Limestone can be a good-quality aggregate source.
Based on the various physico-mechanical analyses, the Lockhart Limestone is recommended for the construction use. ASTM C 127-04 (ASTM, 2004) recommends that water absorption be less than 2.5% for aggregates for use in cement concrete. In this way, based on the indicated results, the Lockhart Limestone qualifies for cement concrete. Similarly, the measured LAA values fall in the suitable range of use of the aggregate appropriate for wearing, coating and road surface (Table 6), as the maximum permissible abrasion value for bituminous surface dressing and cement concrete surface course is 35% and that for bituminous concrete surface course is 30%. Moreover, the cumulative elongated and flaky index values are 1.6 and 3.1% for SAD and RUM sections, respectively, which fall within the safe range of 35–40%, as per specifications of BS 812-105.2 (BSI, 1990a) for road construction.
Conclusions
The mechanical properties of the Lockhart Limestone, in terms of UCS, were determined in prospective localities of RUM and SAD, Islamabad. The petrographic study reveals that the Lockhart Limestone presents mainly wackestone and mudstone microfacies. Calcite and bioclasts are the main constituents of these limestones, which significantly affect the mechanical properties of the limestone.
Based on the physico-mechanical analyses of UCS, PLT and specific gravity, the samples of the Lockhart Limestone from the RUM and SAD sections lie within the specified limits of ASTM and Aashto, suggesting their suitability for heavy construction projects such as roads, railways and buildings. The average values of the specific gravity of the studied samples recommend the usage of the limestone as good-quality aggregate. Similarly, the water absorption values of the SAD and RUM samples, which range from 0.16 to 0.32 and 0.15 to 0.47%, respectively, reflect that the limestone is a good-quality aggregate based on Aashto, ASTM and National Highway Authority (NHA) standards. The average LAAs of these rock samples are 22 and 17% in the SAD and RUM sections, respectively, which place them within the limits of the respective standards of ASTM, Aashto and NHA for utilisation in wearing, coating, cement concrete and construction of roads. The IF and IE values are 3.1 and 1.6% in the RUM and SAD sections, respectively, reflecting suitable placement and consolidation behaviour for construction and cement preparation.
Regression analyses indicate a significant positive correlation between UCS and calcite contents and between PLT and calcite contents. On the other hand, inverse relationships of UCS with bioclasts, PLT with bioclasts, UCS with porosity and PLT with porosity in samples of the RUM and SAD sections are observed. Based on these correlations, the limestone of the formation is designated as moderately strong. After comparison with standards, it was concluded that the Lockhart Limestone from both sections can be utilised for geotechnical purposes, such as crushed material and aggregate source. The results indicate that the engineering properties of the Lockhart Limestone have certain values that are placed within the specified limits and the limestone has mineralogically no specified or known higher concentration of deleterious minerals to hinder its use for construction and as an aggregate source for roads and bridges.

