


Five sewage sludge specimens with different organic contents were prepared by mixing mass ratios of 0, 5, 10, 20 and 40% dry soil powder into raw sewage sludge. The addition of dry soil powder can reduce the organic content of sewage sludge without significantly changing its particle composition. Oedometer tests were conducted, starting from a small effective vertical stress . It is observed that the compression curves show an inverse ‘S’ shape due to suction pressure resisting deformation. The suction pressure decreases exponentially with the organic content, a regression equation for which is provided. Burland’s concept of the intrinsic compression line (ICL) is adopted for correlating the compression curves of sludge with various organic contents. It is found that the ICL with a high organic content lies above the low one – that is, the higher the organic content, the greater the void index. In addition, the shape of the ICL for organic sludges is an inverse S rather than slightly concave upwards for inorganic reconstituted clays. An average ICL is provided to normalise the compression curves of sludges with different organic contents. The intrinsic compression parameters and can be correlated with the organic content, which increase linearly with the organic content, and the regression equations for them are provided.
Notation
- A
activity
intrinsic compression index
- e
void ratio
- e0
initial void ratio
void ratio at
void ratio at
- eL
void ratio at the liquid limit
- Gs
specific gravity (or particle density)
- IP
plasticity index
- Iv
void index
- R
coefficient of correlation
- w0
initial water content
- wL
liquid limit
- wp
plastic limit
- wu
organic content
- γ
unit weight
- λ
mass percentage of the dry soil powder dose
suction pressure
effective vertical stress
Introduction
Municipal sewage sludge is the residue by-product of waste-water-treatment processes. The amount of sewage sludge has increased dramatically over recent years due to urbanisation and strict regulation of waste water discharge quality (Koenig and Kay, 1995; Lo et al., 2002; O’Kelly, 2016). As a non-traditional geotechnical material, sewage sludge usually has an extremely high water content, a high organic content, high compressibility and low shear strength (Chen et al., 2014; Diliūnas et al., 2010; Koenig and Kay, 1995; Koenig et al., 1996; Lo et al., 2002; O’Kelly, 2005, 2006; Stone et al., 1998). The extremely high water content and organic content make sewage sludge exhibit a non-linear large deformation consolidation behaviour (Geng and Yu, 2017; Hu et al., 2014; Indraratna et al., 2017; Nguyen and Kim, 2019), which may cause some geotechnical problems, such as differential settlement, long-term creep settlement behaviour and instability of landfill slopes (Brandl, 2018; Koenig and Kay, 1995; Lo et al., 2002; Nguyen et al., 2020; O’Kelly, 2005; Santagata et al., 2008). Knowledge of the compression behaviour of sewage sludge with a high organic matter and water content is of central importance, not only beneficial to solving the aforementioned problems but also closely related to storage capacity design and operation safety of the landfill (Koenig and Kay, 1995; Koenig et al., 1996; Lo et al., 2002; O’Kelly, 2016).
Burland (1990) proposed an intrinsic compression line (ICL) with introduction of a normalised void index, established based on reconstituted soils at an initial water content of 1.0–1.5 times the liquid limits. Hong et al. (2010) derived an extended ICL, established based on reconstituted soils at an initial water content of 0.7–2.0 times the liquid limits. It was observed by Hong (2007) and Hong et al. (2010, 2012) that the compression curves of reconstituted soils with various initial water contents show an inverse ‘S’ shape due to suction pressure resisting deformation. It is the suction pressure that has a significant effect on Burland’s ICL. Yang et al. (2022) investigated the compression behaviour of a sewage sludge with an initial water content of 0.13–1.48 times the liquid limit and found that the compression curves of sewage sludges with various initial water contents also show an inverse S shape. This indicates that the void index is a powerful index for correlating the compression curves of sewage sludge with different initial water contents. However, it has been reported that the compression behaviour of sewage sludge is not only affected by the initial water content but also closely related to the organic content (Lo et al., 2002; O’Kelly, 2005, 2016; Santagata et al., 2008; Yang et al., 2022; Zeng et al., 2017). In this paper, the effect of organic content on the compression behaviour of sewage sludge is clarified.
The objective of this study is to investigate the compression behaviour of sewage sludge at various organic contents using oedometer tests. This work is complementary to the intrinsic compression theory of Burland (1990), Hong (2007) and Hong et al. (2010, 2012). The following questions will be addressed: (a) how does the organic content affect the physical properties of sewage sludge? (b) How does the organic content affect the suction pressure? (c) Can the ICL be extended to expound the intrinsic compression behaviour of sewage sludges with various organic contents? (d) How does the organic content affect the ICL and intrinsic compression parameters and ?
Materials and methods
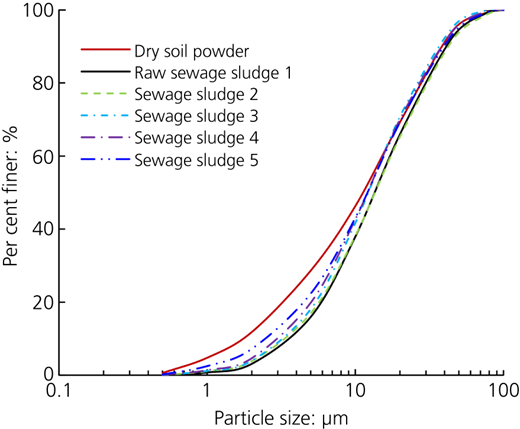
The raw sewage sludge for tests was taken from a waste-water-treatment plant in the Chinese city of Chuzhou, and its particle size distribution curve is shown in Figure 1. It is observed that the clay (<2 μm), silt (2–60 μm) and sand (60–2000 μm) contents of raw sewage sludge are 3, 93 and 4%, respectively. The dry soil powder is the residual soil from the excavation of a foundation pit in Bengbu, China, which was air-dried, crushed and sieved, and its particle size distribution curve is also shown in Figure 1. The clay (<2 μm), silt (2–60 μm) and sand (60–2000 μm) contents of dry soil powder are 12, 84 and 4%, respectively. The physical properties of raw sewage sludge and dry soil powder are given in Table 1.
Physical properties of sludge specimens and dry soil powder
| Specimen | λ: % | wu: % | w0: % | w0/wL | e0 | e0/eL | wL: % | wp: % | γ: kN/m3 | Gs | eL |
|---|---|---|---|---|---|---|---|---|---|---|---|
| Dry soil powder | — | 3.5 | 0.0 | — | — | — | 45.2 | 26.3 | 16.72 | 2.73 | — |
| Raw sewage sludge 1 | 0 | 27.03 | 220.3 | 1.01 | 4.749 | 1.01 | 217.6 | 117.4 | 11.98 | 2.15 | 4.700 |
| Sewage sludge 2 | 5 | 23.38 | 179.25 | 1.02 | 4.143 | 1.01 | 176.5 | 77.0 | 12.27 | 2.26 | 4.093 |
| Sewage sludge 3 | 10 | 20.67 | 151.42 | 0.95 | 3.607 | 0.96 | 159.0 | 69.3 | 12.96 | 2.38 | 3.746 |
| Sewage sludge 4 | 20 | 16.78 | 125.56 | 1.00 | 2.989 | 1.00 | 125.1 | 54.6 | 13.77 | 2.43 | 2.981 |
| Sewage sludge 5 | 40 | 11.63 | 90.34 | 1.00 | 2.216 | 1.00 | 90.1 | 36.7 | 15.42 | 2.61 | 2.216 |
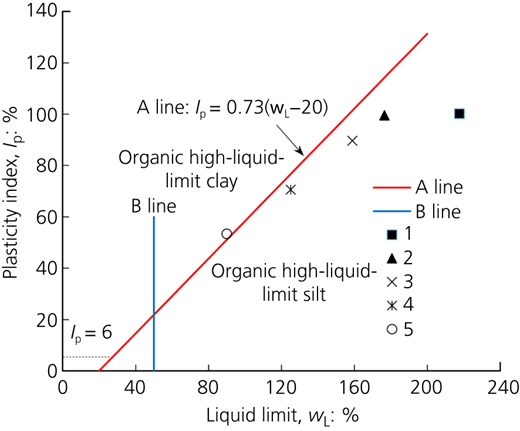
Sludge specimens were prepared by mixing mass ratios of 0, 5, 10, 20 and 40% dry soil powder into the raw sewage sludge, numbered 1, 2, 3, 4 and 5, respectively. Figure 1 shows that the particle size distribution curves of sludge specimens do not differ much – for example, the clay contents of specimens 1, 2, 3, 4 and 5 are 3.0, 3.8, 3.9, 4.6 and 7.2%, respectively. Moreover, it is observed from Table 1 that the addition of dry soil powder can reduce the organic content of sewage sludge without significantly changing its particle composition. As can be seen from Table 1, the initial water content of raw sewage sludge was 220.3%, and the ratios of the initial water content to the liquid limit w0/wL of five sludge specimens were adjusted to be nearly equal, about 1.0, so that the influence of the initial water content could be excluded in the following analysis. As can be seen from the Casagrande plasticity chart plotted in Figure 2, specimens 1 (raw sewage sludge), 2, 3 and 4 are below line A and to the right of line B, meaning they are organic high-liquid-limit silts, and specimen 5 is located to the right of line B, nearly on line A (slightly above line A), which makes it an organic high-liquid-limit clay. Moreover, it may be considered a transition soil from silt to clay. Compared with sewage sludges of extremely high-plasticity organic clay reported by numerous researchers such as O’Kelly (2005, 2018) and Santagata et al. (2008), the research in this paper mainly focuses on sewage sludges of organic high-liquid-limit silt in China. Many organic soils were reported by Zhang et al. (2008), Chen et al. (2014), O’Kelly (2018) and Huang et al. (2019), which were organic high-liquid-limit silts.
Referring to the JTG 3430 standard by the Professional Standards Compilation Group of China (PSCGC, 2020), the soil was dried and crushed using a soil pulveriser and then sieved through a 0.075 mm sieve as a dry soil powder for the test. The dry soil powder was mixed with the raw sewage sludge, and sludge specimens 1, 2, 3, 4 and 5 were prepared according to the ratios of dry soil powder to the total mass of 0, 5, 10, 20 and 40%, respectively. Referring to the standard by the PSCGC (2020) and the paper by O’Kelly (2018), the water content was determined using the oven-drying method, maintaining temperature of 65°C, in conjunction with a 48 h drying period and a wet specimen mass of 100 g. Referring to the thesis by Kayser (2012), particle size distribution curves were determined using a laser diffraction particle size analyser, and test specimens were prepared with a dispersion agent, allowed to soak and then placed in an ultrasonic bath for a 1 h period with frequent stirring, which was found to be more effective in disaggregating the particle flocs. The dispersion agent used contained 2 g/l sodium hexametaphosphate and an additional 0.5 g/l sodium carbonate according to NZS 4402 (SANZ, 1986). According to the GB/T 50123 standard by the PSCGC (2019), the liquid limit was determined using the cone penetrometer method. The plastic limit was determined using the rolling method according to the American Society for Testing and Materials (ASTM) standard D 4318 (ASTM, 2005). According to the standard by the PSCGC (2019), the unit weight was measured using the ring knife method, and the sludge specimens were compacted, keeping the same hammer weight, drop distance and compaction times to ensure the same compaction energy.
The organic content was determined using the ignition loss method. The British Standards Institution (BSI, 1990) recommends a lower oven-drying temperature range of 50.0 ± 2.5°C and higher ignition temperatures (e.g. 550 or 800°C); determination of the organic content of sewage sludge according to BSI (1990) may obtain an overestimated value (O’Kelly, 2018). The ignition loss measurements for biosolid and sewage sludge materials based on the specimen oven-drying temperature range 105–110°C (ASTM, 2014) and an ignition temperature of 440 ± 25°C (ASTM, 2014) were equivalent to the organic content value for more than 10% (O’Kelly, 2019). For sludge specimens of organic high-liquid-limit silt, drying at a lower range of the oven-drying temperature for more than 48 h would not leave too much residual pore fluid. Thus, the organic content of sludge specimens was determined based on an oven-drying temperature of 65°C and an ignition temperature of 550°C, referring to the standards by the PSCGC (2020) and BSI (1990) and the paper by O’Kelly (2019). According to the paper by O’Kelly (2018) and the standard by PSCGC (2020), the specific gravity was measured using the pycnometer method, using kerosene as a medium liquid, and a shorter vacuum period of 24 h was usually adequate to achieve complete degassing of the submerged test specimens. Referring to ASTM D 2435 (ASTM, 2004) and the standard by the PSCGC (2019), specimens for oedometer tests at various organic contents were prepared and left in a humidifier for 24 h. The initial water contents and void ratios of sludge specimens for oedometer tests are listed in Table 1. It can be seen that the normalised water content and normalised void ratio of sludge specimens were nearly the same, about 1.0. Therefore, the influence of the initial water content and void ratio was excluded. The well-stirred sludge pastes were filled into consolidation rings, whose diameter and height were 39.1 and 20 mm, respectively. Two-way vertical drainage consolidation and vertical stresses of 3.0, 6.0, 12.5, 25.0, 50.0, 100.0, 200.0, 400.0, 800.0 and 1600.0 kPa were applied successively, and then the specimens were consolidated for 24 h at each vertical stress.
Physical properties
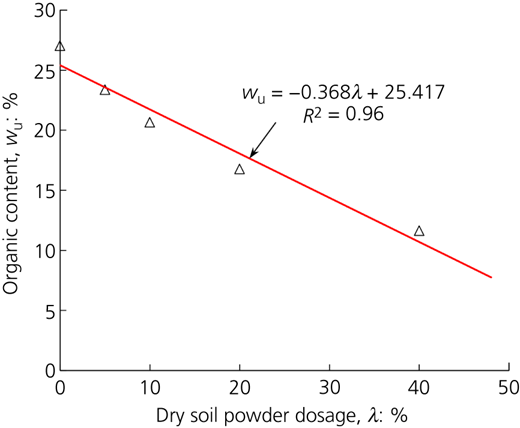
Figure 3 presents the relationship curves of organic content plotted against the dosage of dry soil powder. It is observed that the addition of dry soil powder changes the organic content of raw sewage sludge, and the organic content decreases exponentially with the dosage of dry soil powder. Figure 4 shows the relationship curves of liquid limit, plastic limit and plasticity index plotted against organic content. It is observed that the liquid limit, plastic limit and plasticity index increase linearly with the organic content. The regression equations are expressed as follows with correlation coefficients of 0.995, 0.954 and 0.972:
where wL, wp and Ip are the liquid limit, plastic limit and plasticity index, expressed in per cent, respectively. Additionally, wu is the organic content, expressed in per cent. It was reported by Huang et al. (2019) that the Atterberg limits for Pudong sludge of organic high-liquid-limit silt also increased linearly with the organic content.
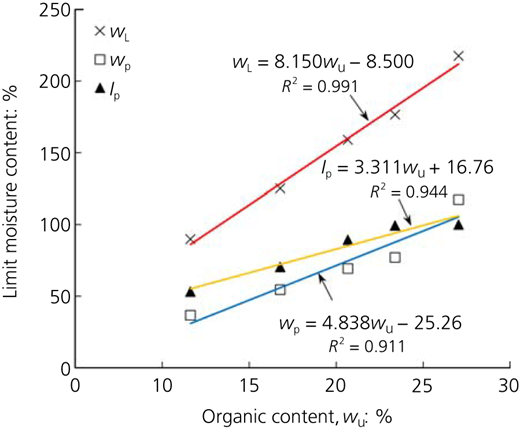
Relationships of liquid limit, plastic limit and plasticity index plotted against organic content
Relationships of liquid limit, plastic limit and plasticity index plotted against organic content
Figure 5 presents the relationship curve of specific gravity plotted against organic content. It can be seen that the specific gravity of sludge decreases linearly with the organic content. The regression equation is expressed as follows with a high correlation coefficient of 0.993:
where Gs is the specific gravity. It was reported by O’Kelly (2006, 2016) that the specific gravity of sewage sludge of organic high-liquid-limit clay also decreased linearly with the organic content.
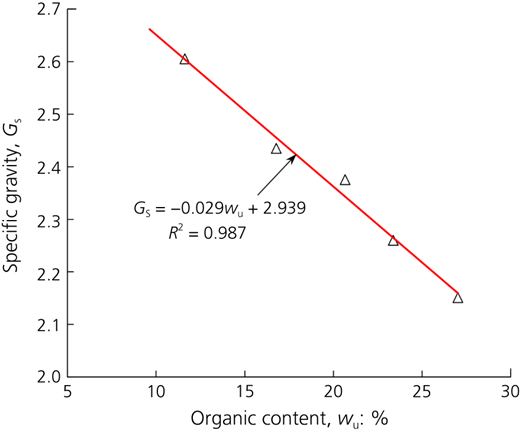
Figure 6 shows the relationship curve of unit weight plotted against organic content. It is observed that the unit weight decreases with the organic content following a power function, and the regression equation is expressed as follows with a high correlation coefficient of 0.997:
where γ is the unit weight expressed in kilonewtons per cubic metre. As can be seen from Table 1, the dry soil powder has a unit weight of 16.72 kN/m3, which is significantly larger than that of the raw sewage sludge, 11.98 kN/m3. When the unit weight is measured, the compaction energy of the sludge specimen is the same. Thus, the unit weight will increase with the dosage of dry soil powder. Moreover, it can also be observed from Table 1 that the organic content decreases with the dosage of dry soil powder; hence, the unit weight decreases with the organic content.
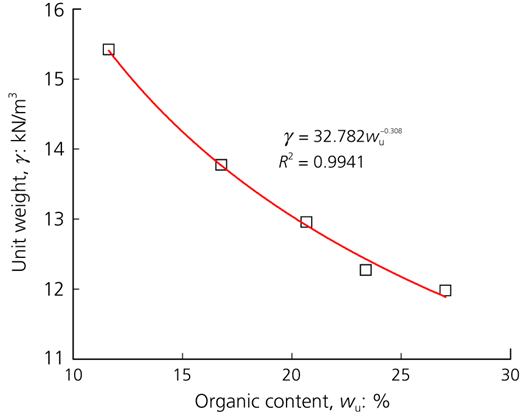
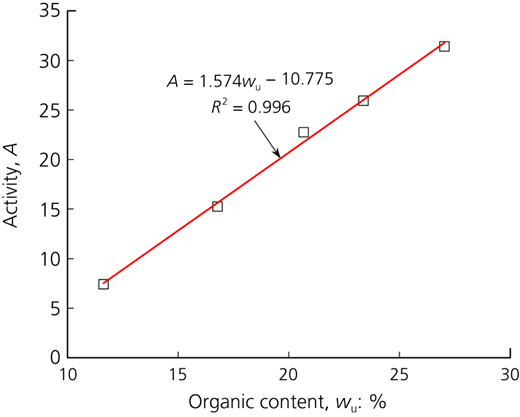
Figure 7 presents the relationship curve for activity of sludges plotted against organic content. It can be seen that the activity increases linearly with the organic content, and a regression equation is expressed as follows with a high correlation coefficient of 0.998:
where A is the activity of sludge, defined as A = Ip/(content of clay-sized fraction, by weight). The plasticity index Ip and the content of clay-size fraction are expressed in per cent.
Compared with inorganic clays, the organic sewage sludge has extremely high plasticity, and the correlation between liquid limit and organic content is excellent. Moreover, the effect of the organic content on the liquid limit is the most significant. The specific gravity and unit weight of sewage sludge are lower compared with those of inorganic clays, which are greatly affected by the organic content. It is well known that the activity is used to measure the ability of clay minerals in soil to adsorb bound water. An organic sewage sludge with an extremely high activity will absorb a large amount of bound water, leading to low permeability and high compressibility of sludge. Thus, the effect of organic content on the activity is significant.
Compression curves and suction pressure
Figure 8 presents the compression curves of sludge specimens with different organic contents. It is observed that the compression curves of sludge specimens show an inverse S shape, which is the same as those of several reconstituted clays with high water contents reported by Hong (2007) and Hong et al. (2010, 2012) and some sewage sludges reported by O’Kelly (2005, 2006), Santagata et al. (2008), Zhang et al. (2008), Chen et al. (2014), Huang et al. (2019) and Yang et al. (2022), rather than the slightly concave upward shape of reconstituted clays reported by Burland (1990). The compression curves tend to show an inverse S shape for the sewage sludges of organic high-liquid-limit clay or silt mentioned above.
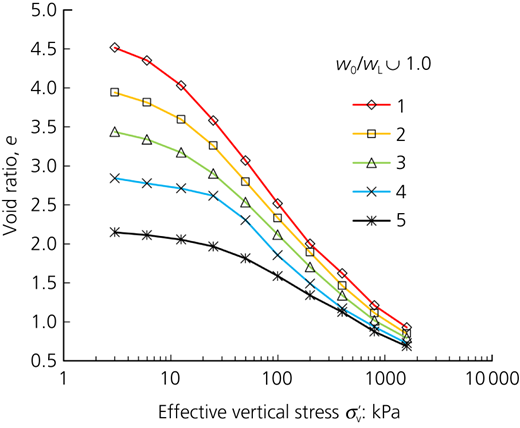
As can be seen from Figure 8, when the effective vertical stress is greater than the stress corresponding to the inflection point of the curves, the compression curves are indeed slightly concave upwards, which is consistent with the results of Burland (1990). The stress corresponding to the inflection point was called ‘suction pressure’ by Hong (2007), which was responsible for the inverse S shape of curves, and it was the suction pressure that resisted the loads, resulting in low compressibility in the low-stress range.
According to the method of Butterfield (1979), the compression curves with an inverse S shape can be well represented by two straight lines in the plot of log(1 + e) or ln(1 + e) against or . Thus, curves are plotted in Figure 9. Hong (2007) and Hong et al. (2010) proposed a unique relationship between suction pressure and normalised water content w0/wL of several inorganic clays, which is (kPa). In this paper, the normalised water contents w0/wL of five organic sludge specimens are nearly the same – that is, w0/wL ≈ 1.0. According to the formula for suction pressure proposed by Hong (2007) and Hong et al. (2010), the suction pressures of five sludges should be nearly equal. However, the suction pressures of the five organic sludges decrease with the organic content. This indicates that the formula for the suction pressure of inorganic reconstituted clays proposed by Hong (2007) and Hong et al. (2010) is not applicable to organic sludges. Therefore, for the organic sewage sludge, the effect of organic content on suction pressure is significant, and its contribution to suction pressure is considerable.
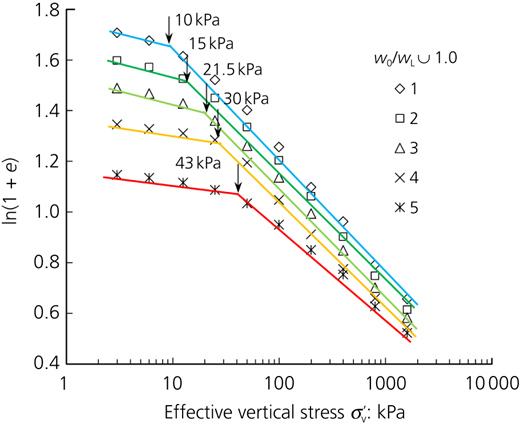
Figure 10 presents the relationship between suction pressure and organic content. It is found that the suction pressure decreases exponentially with the organic content. The regression equation is expressed as follows with a high correlation coefficient of 0.991:
where is the suction pressure, expressed in kilopascals. When the normalised water content w0/wL is the same, a unique relationship between suction pressure and organic content may exist. It was reported by Huang et al. (2019) that the suction pressure of Pudong sludge of organic high-liquid-limit silt also decreases exponentially with the organic content.
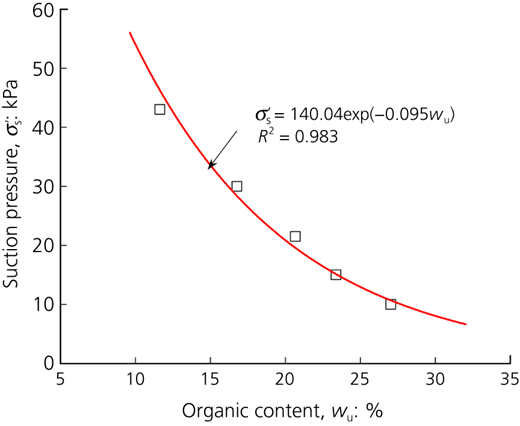
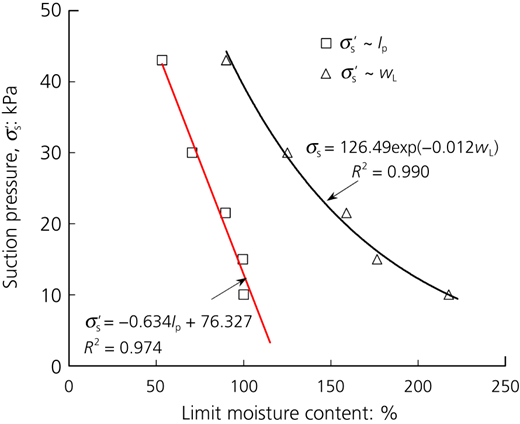
Figure 11 presents the relationships of suction pressure to liquid limit and plasticity index. It is found that the suction pressure has a good correlation with the liquid limit and the plasticity index, but the correlation with the plastic limit is not as good. The suction pressure decreases exponentially with the liquid limit and reduces linearly with the plasticity index. The regression equations are expressed as follows with high correlation coefficients of 0.995 and 0.987:
where wL is the liquid limit, expressed in per cent, and Ip is the plasticity index, expressed in per cent. The suction pressure of Pudong sludge of organic high-liquid-limit silt reported by Huang et al. (2019) decreases with liquid limit and plasticity index. However, the suction pressure of inorganic high-liquid-limit clay reported by Hong et al. (2010) increases with liquid limit and plasticity index.
Normalising compression curves
Burland (1990) introduced the void index Iv to correlate compression curves of various reconstituted clays with eL ranging from 0.6 to 4.5. The void index is defined as follows:
where and are the void ratios of the reconstituted clays at effective vertical stresses of 100 and 1000 kPa, respectively, and is termed the ‘intrinsic compression index’.
Burland (1990) reported the ICLs of several reconstituted clays (e.g. Kleinbelt Ton Clay, London Clay and Magnus Clay) at water contents such that wL < w0 < 1.5wL. Hong et al. (2010) reported the ICLs of three reconstituted clays (Lianyungang Clay, Baimahu Clay and Kemen Clay) at water contents such that 0.7wL < w0 < 2.0wL. Yang et al. (2022) reported the ICL of a sewage sludge of organic high-liquid-limit silt at water contents such that 0.13wL < w0 < 1.48wL. To facilitate comparative analysis, the ICLs from the papers by Hong et al. (2010), Burland (1990) and Yang et al. (2022) and this paper are plotted in Figure 12. It is observed that the ICLs are nearly coincident when . As can be seen from Table 1, the normalised water contents w0/wL of sludge specimens 1, 2, 3, 4 and 5 are nearly equal to 1.0. Thus, the influence of the initial water content can be excluded in the following analysis. Seen from Figure 12, when w0/wL is the same, the ICL with a high organic content lies above the low one, and the ICL of sewage sludge with a high organic content is an inverse S shape, whereas that of inorganic clay (e.g. Burland, 1990; Hong et al., 2010) is a slightly concave upward shape, indicating the effect of the organic content on the ICL.
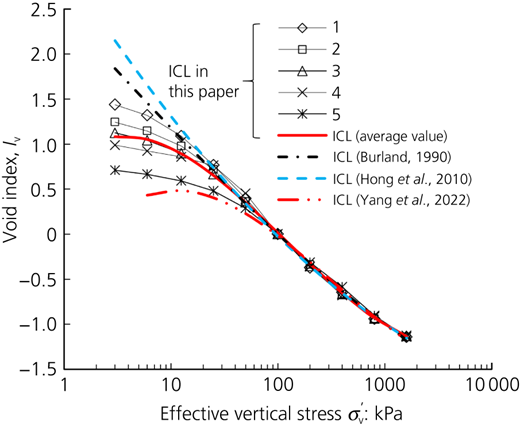
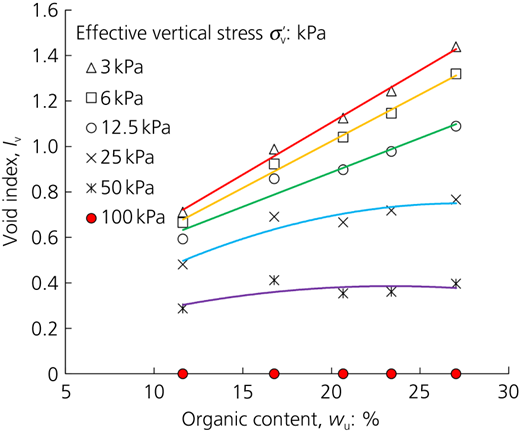
Figure 13 shows the relationships between void index and organic content under different effective vertical stress . As can be seen from Figures 12 and 13, when , it is obvious that the void index increases linearly with the organic content. When , the effect of the organic content on the void index decreases gradually. When , the organic content has little effect on the void index. Burland (1990) believes that the void index may be used as a measure of the intrinsic compactness of a sediment. When Iv is less than zero, the sediment is compact, and when Iv is greater than zero, the sediment is loose. According to the theory of Burland (1990), when , the higher will be organic content, and the looser will be the intrinsic compactness of the sludge. When , the intrinsic compactness of the sludge remains almost unchanged with the increase in organic content.
An average ICL for sludge with different organic contents is proposed as follows with a high correlation coefficient of 0.988:
where is the effective vertical stress, expressed in kilopascals. It can be seen that the void index can undoubtedly be used as a powerful index for correlating the compression curves of sewage sludges with different organic contents. It was reported by Huang et al. (2019) that the average ICL of Pudong sludge of organic high-liquid-limit silt had also a cubic polynomial distribution, and the ICL of sludge with a high organic content was also located above the one for sludge with a low organic content.
Discussion on intrinsic compression parameters
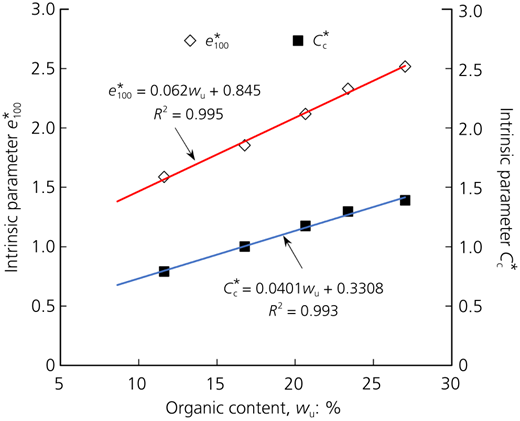
The intrinsic compression parameters and are essential for determining the void index Iv. It is reported by Hong et al. (2010) and Yang et al. (2022) that and can be significantly affected by the initial water content. Hong et al. (2010) proposed that the intrinsic compression parameters and of inorganic reconstituted soils satisfy a unique relation with the normalised initial water content w0/wL. According to the theory of Hong (2007) and Hong et al. (2010), the normalised water contents w0/wL of five sludge specimens are equal. Thus, the intrinsic parameters of five sludge specimens should be equal, whereas the intrinsic parameters are not equal in fact but they increase with the organic content. Figure 14 presents the relationships of and plotted against organic content. It is observed that both and increase linearly with the organic content. The regression equations of and are expressed as follows with high correlation coefficients of 0.997 and 0.996:
where and are the intrinsic compression parameters. When w0/wL = 1.0, the parameters and can be uniquely determined using the organic content. It was reported by Hong et al. (2010) that the intrinsic compression parameters of three inorganic reconstituted clays increased linearly with the normalised initial water content w0/wL (or the normalised void ratio e0/eL). It was reported by Yang et al. (2022) that the intrinsic compression parameters of sewage sludge of organic high-liquid-limit silt increased exponentially with the normalised initial water content w0/wL and increased linearly with the normalised void ratio e0/eL. It was reported by Huang et al. (2019) that the intrinsic compression coefficients and of Pudong sludge of organic high-liquid-limit silt also increased linearly with the organic content.
Conclusions
Five sludge samples of organic high-liquid-limit silt with organic contents ranging from 12 to 27% were prepared by adding various doses of dry soil powder into sewage sludge. Specific gravity, unit weight, liquid limit, plastic limit, particle gradation and oedometer tests were carried out. The main conclusions were obtained as follows.
The liquid limit, plastic limit, plasticity index and activity of the sludge increase linearly with the organic content. The specific gravity decreases linearly with the organic content. The unit weight decreases with the organic content following a power function.
The compression curves of sludge at different organic contents show an inverse S shape. The suction pressure decreases exponentially with the organic content, whose regression equation is expressed as . The suction pressure decreases exponentially with the liquid limit and reduces linearly with the plasticity index.
Under the same normalised water content w0/wL ≈ 1.0, when , the ICL of high organic content lies above that for low organic content, and the higher the organic content, the larger will be the void index. Moreover, the ICL of the organic sludge is an inverse S shape rather than the slightly concave upward shape for inorganic reconstituted clay.
When , it is obvious that the void index increases linearly with the organic content. The effect of the organic content on the void index weakens gradually when . When , the organic content has little effect on the void index. An average ICL proposed for sludges with different organic contents is expressed as .
Intrinsic compression parameters and increase linearly with the organic content, whose regression equations are expressed as and .
Acknowledgements
The authors acknowledge the financial support of Key Scientific Research Foundation of the Education Department of Anhui Province (KJ2020A0080, gxyq2020036) and Talent Introduction Projects of Anhui University of Science and Technology (JZYJ201601).

